Unlock document.
This document is partially blurred.
Unlock all pages and 1 million more documents.
Get Access

Answers and Solutions: 6 - 11
or in part.
SOLUTION TO SPREADSHEET PROBLEM
6-15 The detailed solution for the spreadsheet problem is available in the file Ch06-P15 Build
a Model Solution.xlsx on the textbook’s Web site.
Assume that you recently graduated and landed a job as a financial planner with Cicero
Services, an investment advisory company. Your first client recently inherited some assets
and has asked you to evaluate them. The client owns a bond portfolio with $1 million
invested in zero coupon Treasury bonds that mature in 10 years. The client also has $2
million invested in the stock of Blandy, Inc., a company that produces meat-and-potatoes
frozen dinners. Blandy’s slogan is “Solid food for shaky times.”
Unfortunately, Congress and the president are engaged in an acrimonious dispute over the budget
and the debt ceiling. The outcome of the dispute, which will not be resolved until the end of the
year, will have a big impact on interest rates one year from now. Your first task is to determine
the risk of the client’s bond portfolio. After consulting with the economists at your firm, you
have specified five possible scenarios for the resolution of the dispute at the end of the year. For
each scenario, you have estimated the probability of the scenario occurring and the impact on
interest rates and bond prices if the scenario occurs. Given this information, you have calculated
the rate of return on 10-year zero coupon Treasury bonds for each scenario. The probabilities and
returns are shown below:
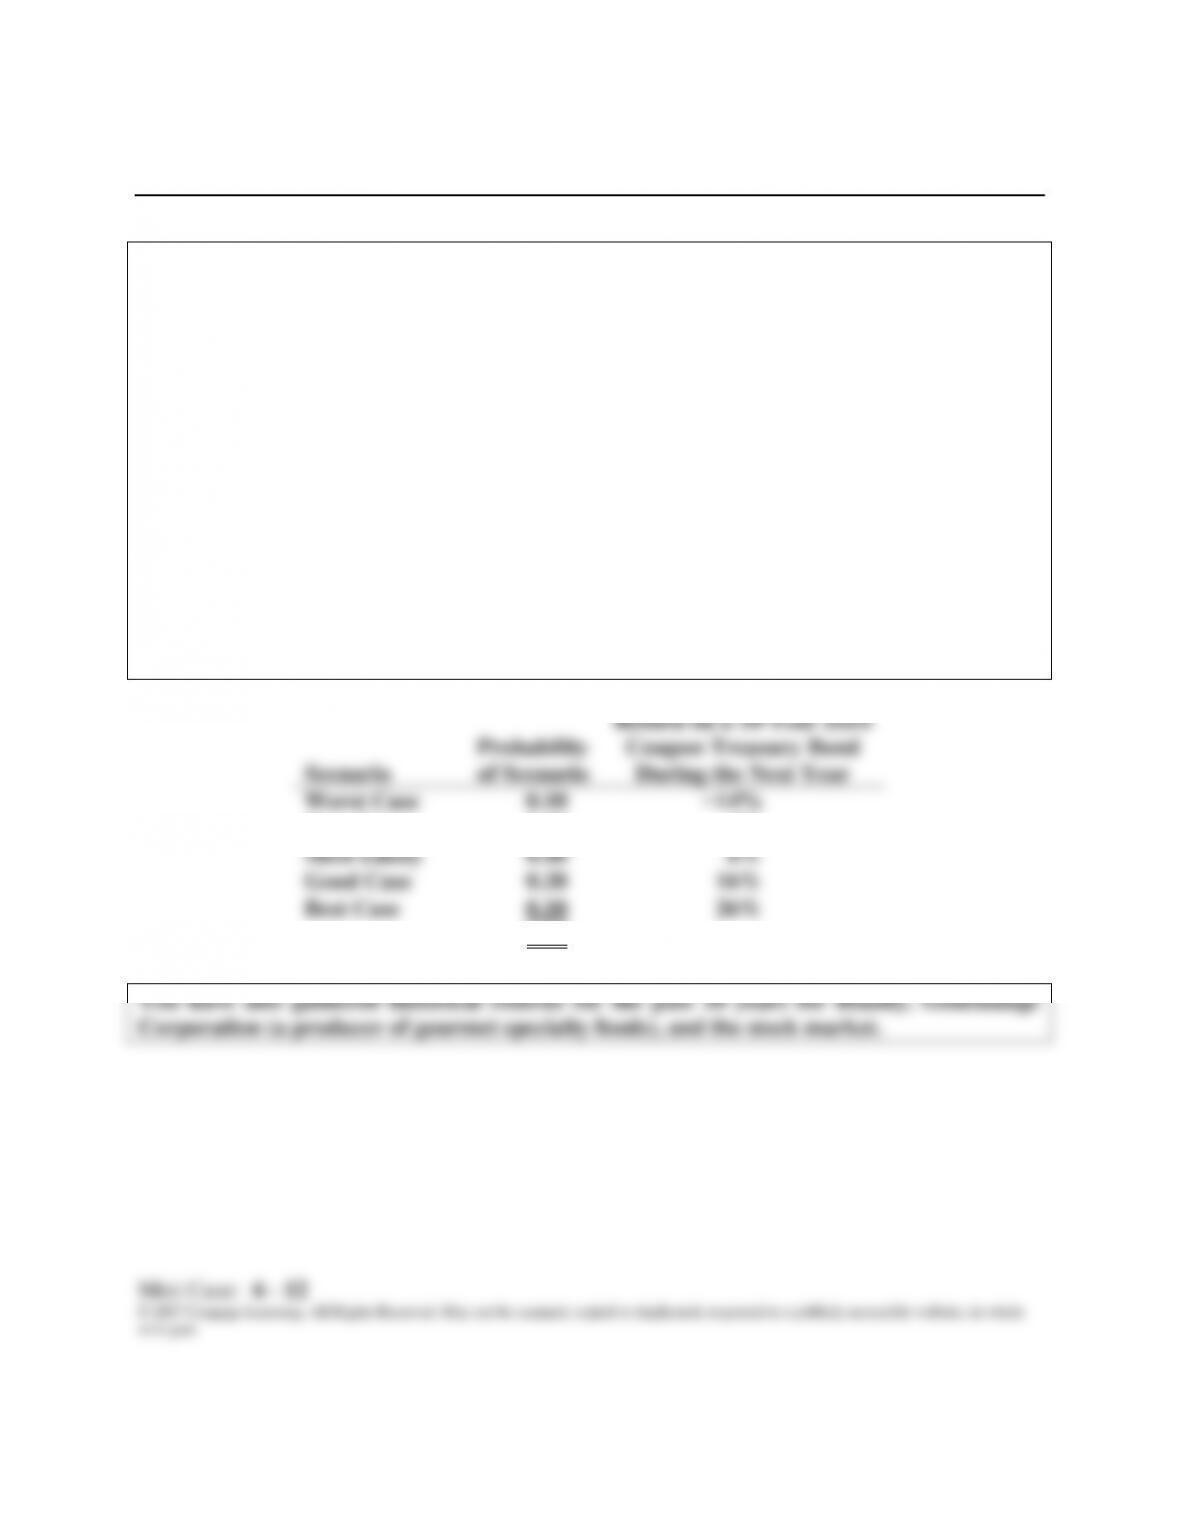
Scenario
Probability
of Scenario
Return on a 10-Year Zero
Coupon Treasury Bond
During the Next Year
Worst Case
0.10
−14%
Poor Case
0.20
−4%
Most Likely
0.40
6%
Good Case
0.20
16%
Best Case
0.10
26%
1.00
MINI CASE

Mini Case: 6 - 13
or in part.
Mini Case: 6 - 14
© 2017 Cengage Learning. All Rights Reserved. May not be scanned, copied or duplicated, or posted to a publicly accessible website, in whole
or in part.
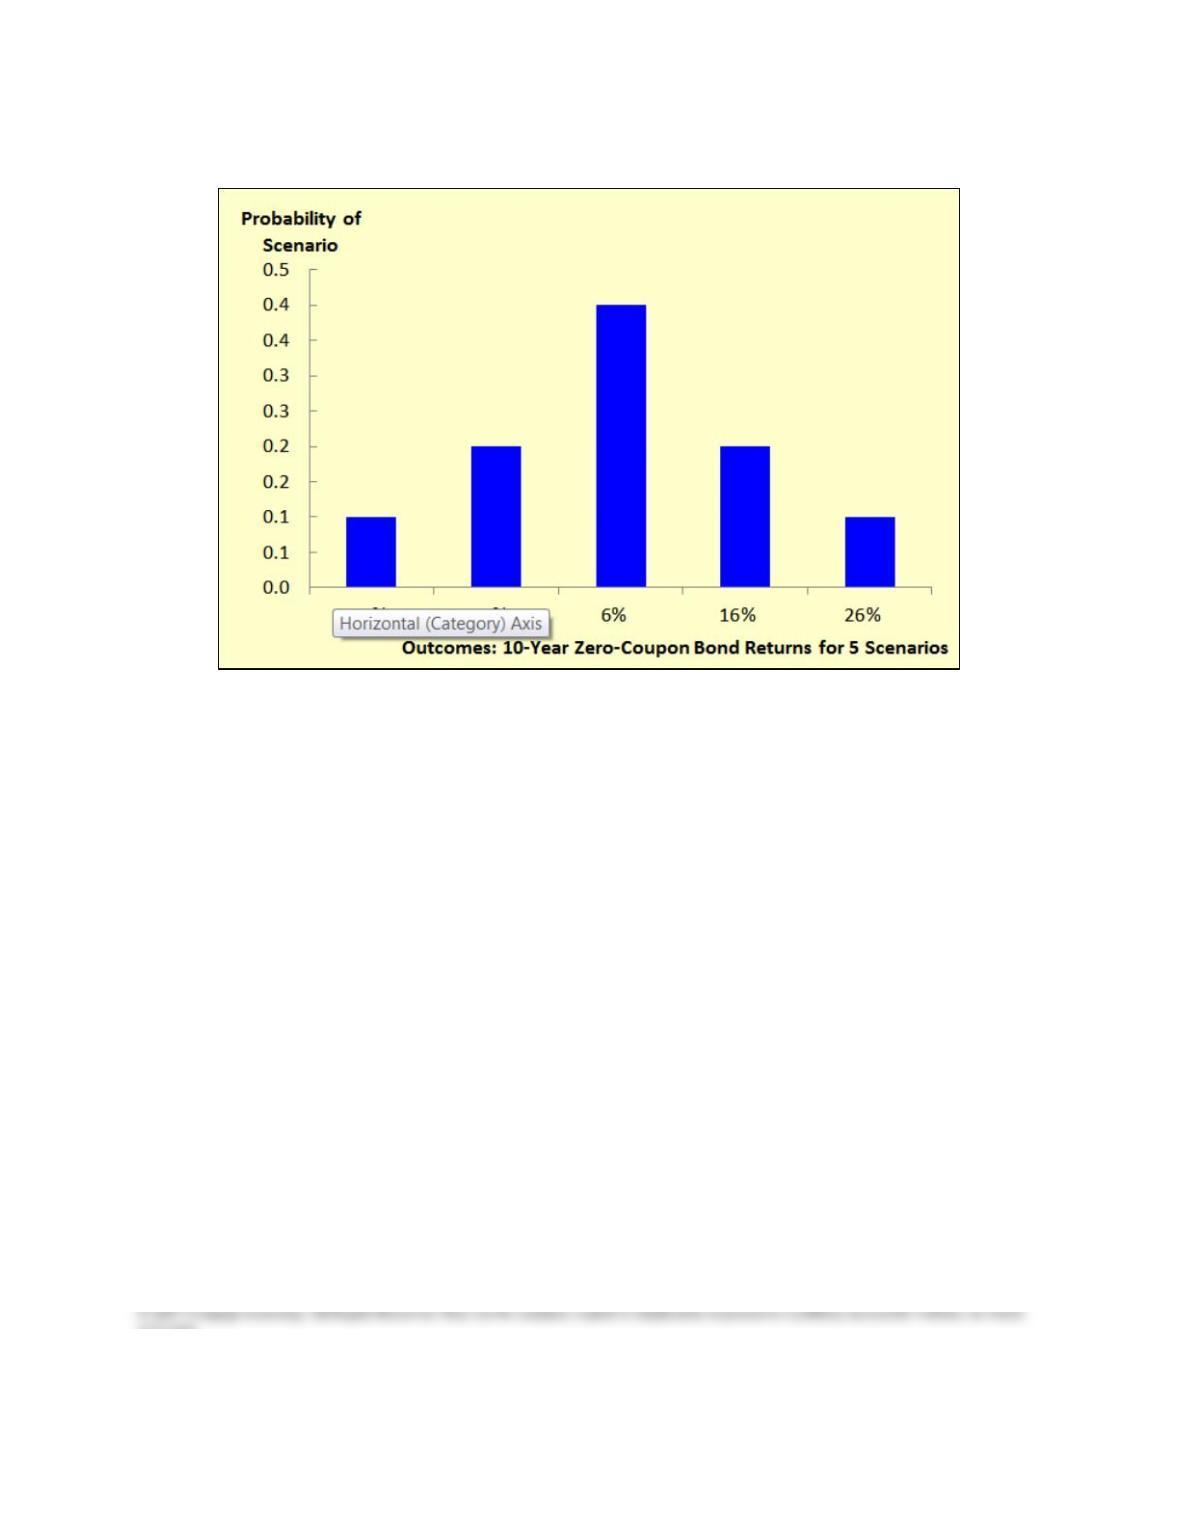
Answer: Here is the probability distribution for the five possible outcomes:
or in part.
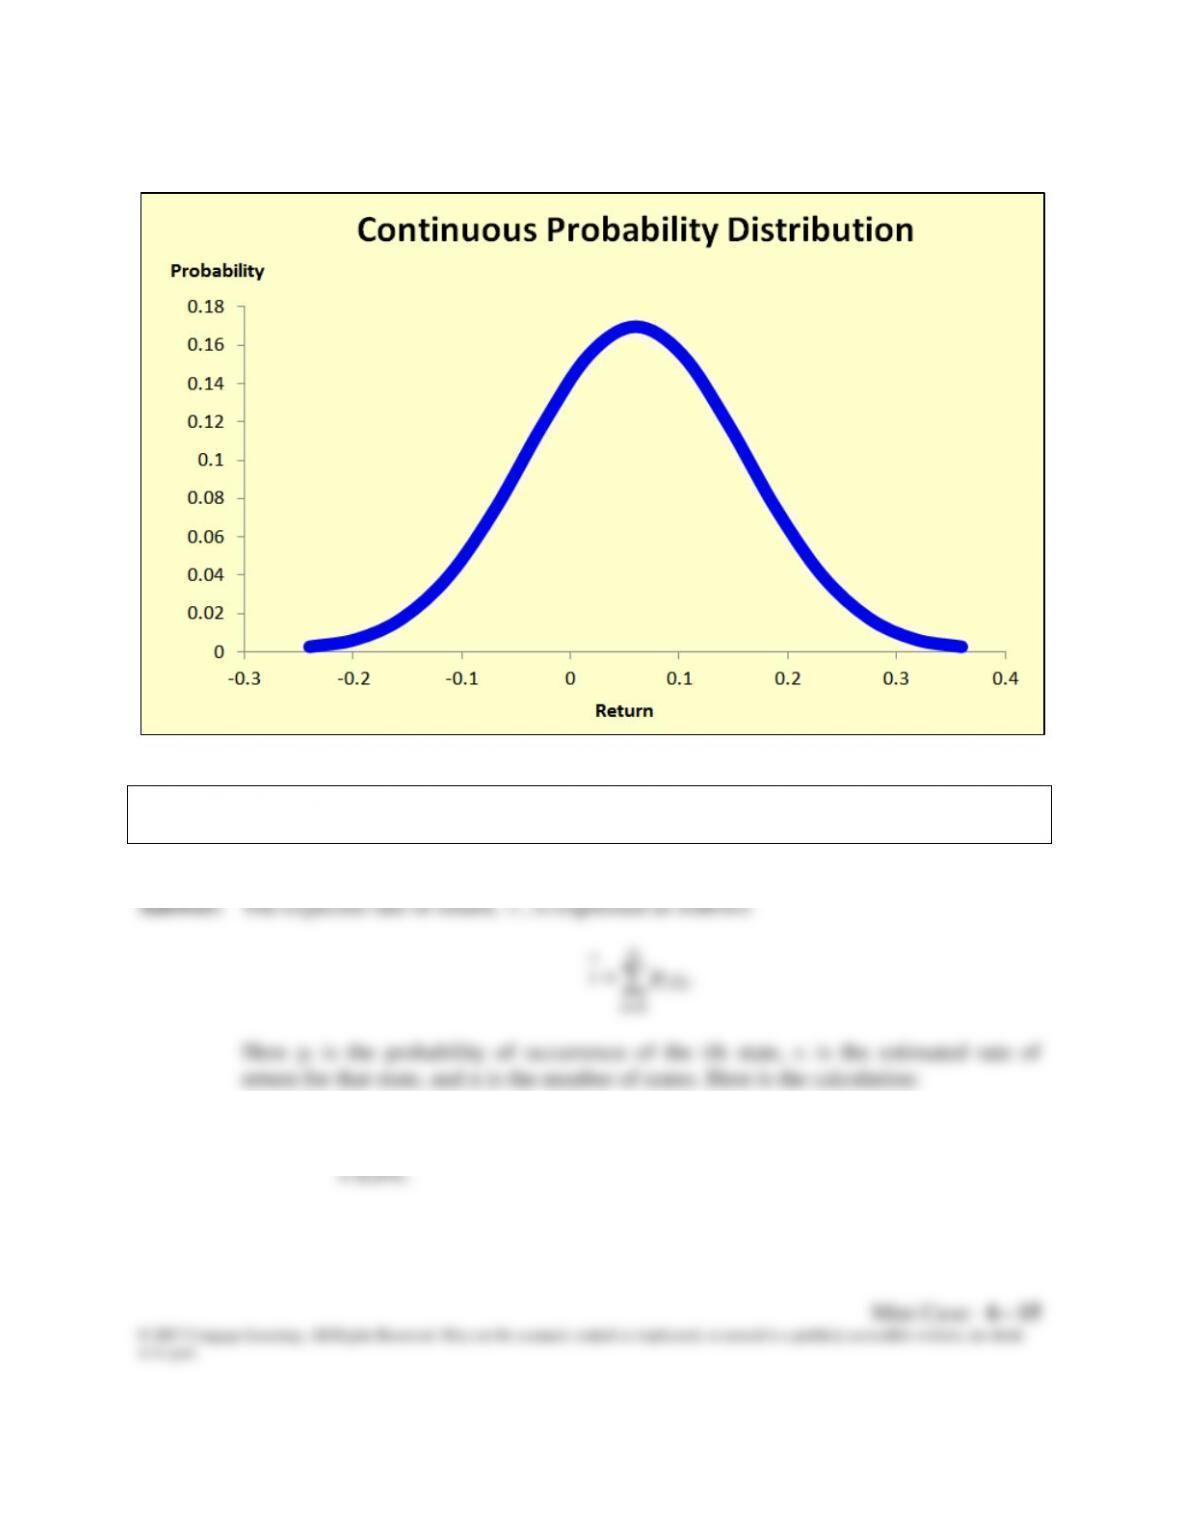
A continuous distribution might look like this:
c. Use the scenario data to calculate the expected rate of return for the 10-year zero
coupon Treasury bonds during the next year.
1=i
Here pi is the probability of occurrence of the ith state, ri is the estimated rate of
return for that state, and n is the number of states. Here is the calculation:
r
= 0.1(-14.0%) + 0.2(-4.0%) + 0.4(6.0%) + 0.2(16.0%) + 0.1(26.0%)
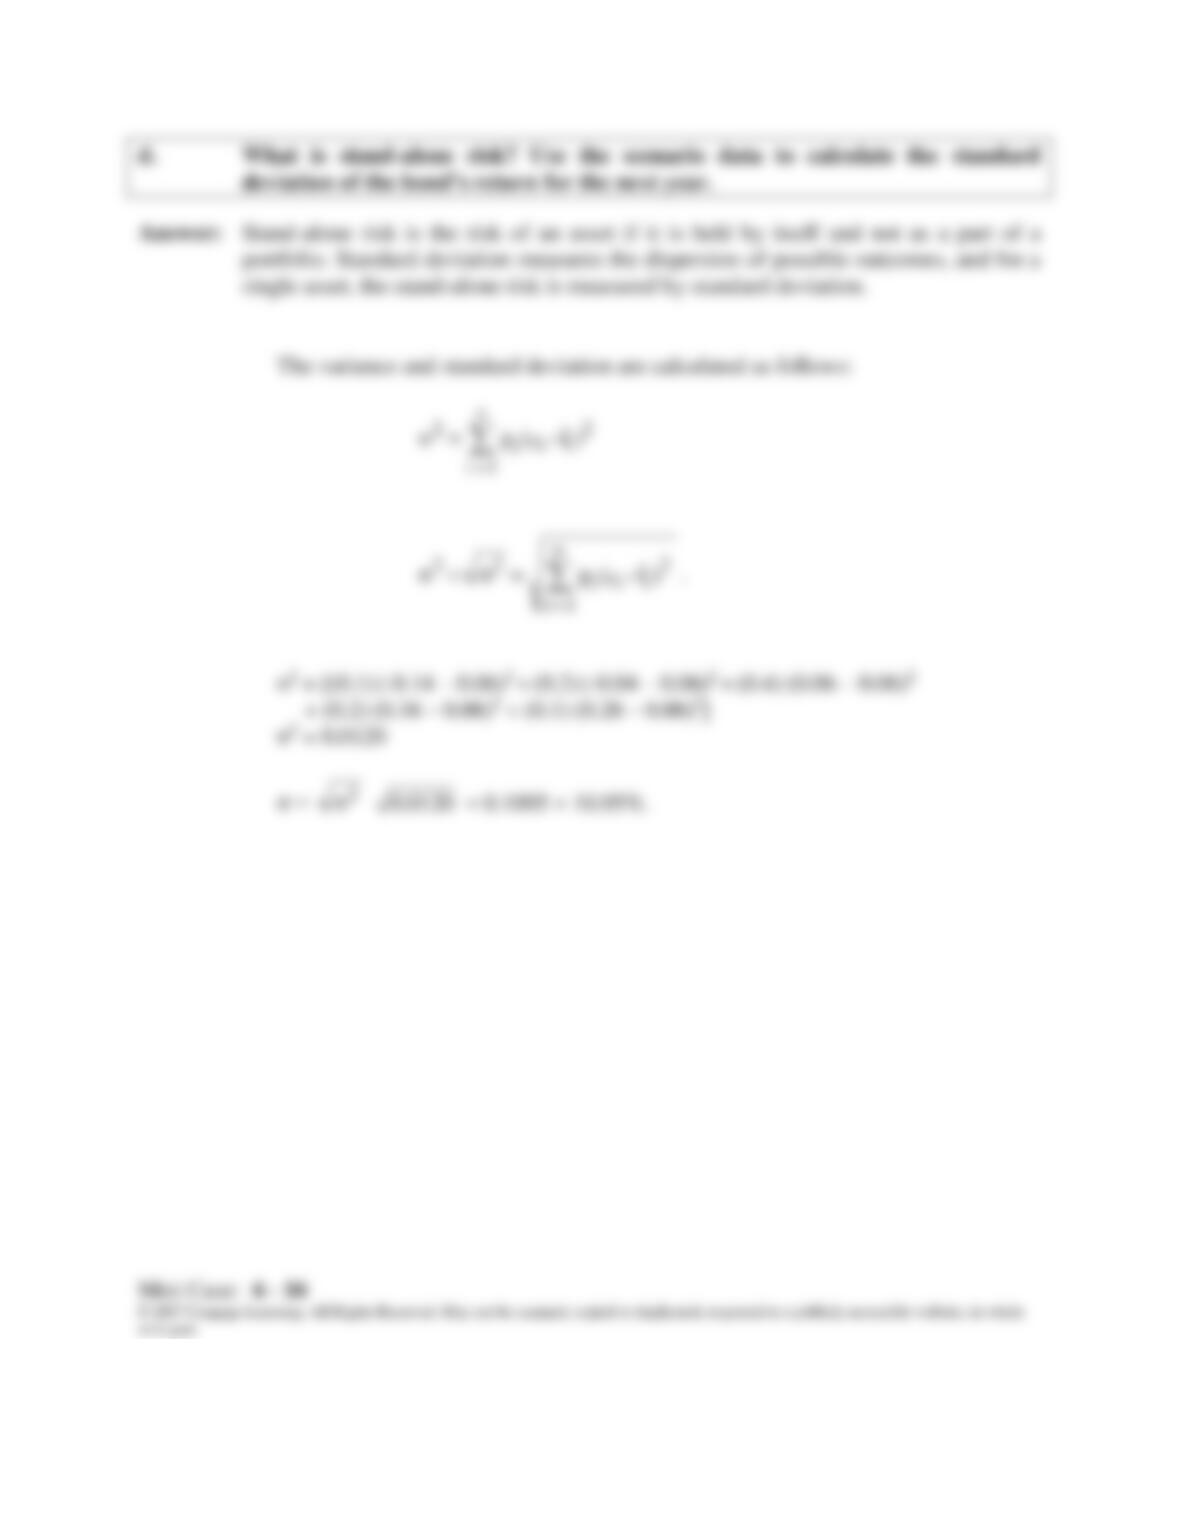
d. What is stand-alone risk? Use the scenario data to calculate the standard
deviation of the bond’s return for the next year.
)r
ˆ
-
r
(
p
=
σi
i2
i
n
1 = i
2
e. Your client has decided that the risk of the bond portfolio is acceptable and
wishes to leave it as it is. Now your client has asked you to use historical returns
to estimate the standard deviation of Blandy’s stock returns. (Note: Many
analysts use 4 to 5 years of monthly returns to estimate risk and many use 52
weeks of weekly returns; some even use a year or less of daily returns. For the
sake of simplicity, use Blandy’s 10 annual returns.)
Answer: The formulas are shown below:
or in part.
f. Your client is shocked at how much risk Blandy stock has and would like to
reduce the level of risk. You suggest that the client sell 25% of the Blandy stock
and create a portfolio with 75% Blandy stock and 25% in the high-risk
Gourmange stock. How do you suppose the client will react to replacing some of
the Blandy stock with high-risk stock? Show the client what the proposed
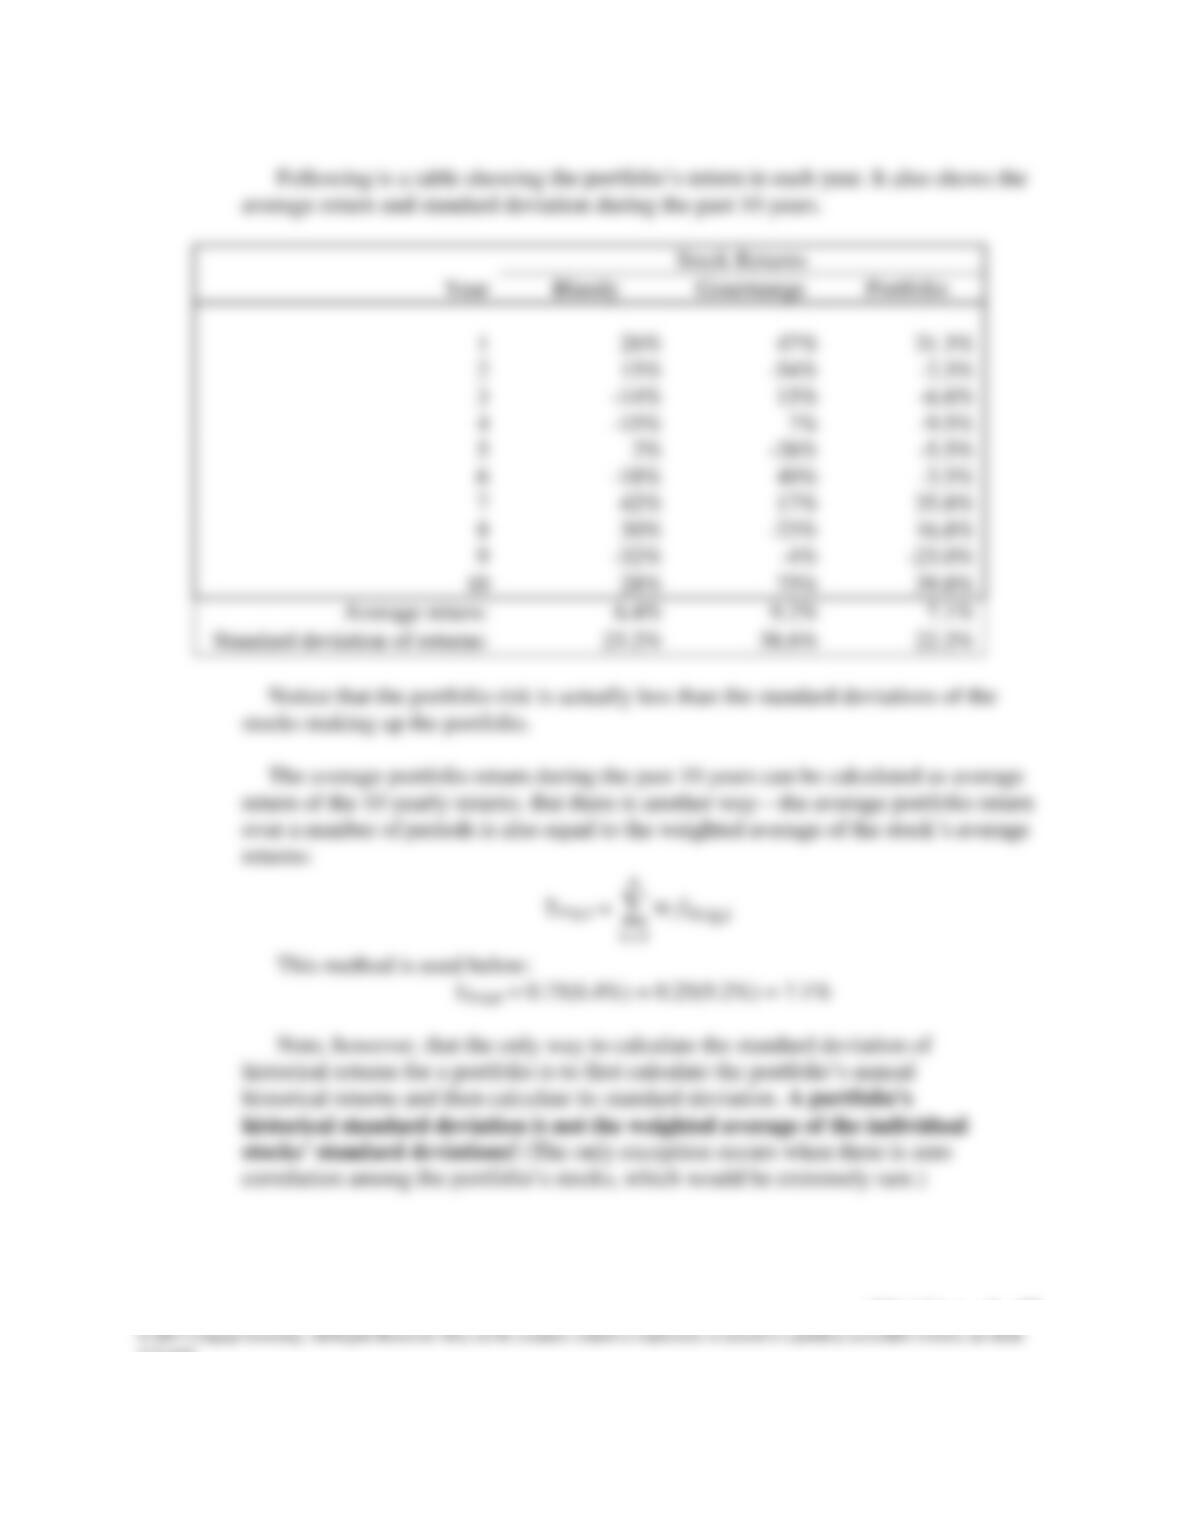
portfolio return would have been in each of year of the sample. Then calculate
the average return and standard deviation using the portfolio’s annual returns.
How does the risk of this two-stock portfolio compare with the risk of the
individual stocks if they were held in isolation?
Answer: To find historical returns on the portfolio, we first find each annual return for the
portfolio using the portfolio weights and the annual stock returns:
n
Mini Case: 6 - 20
or in part.
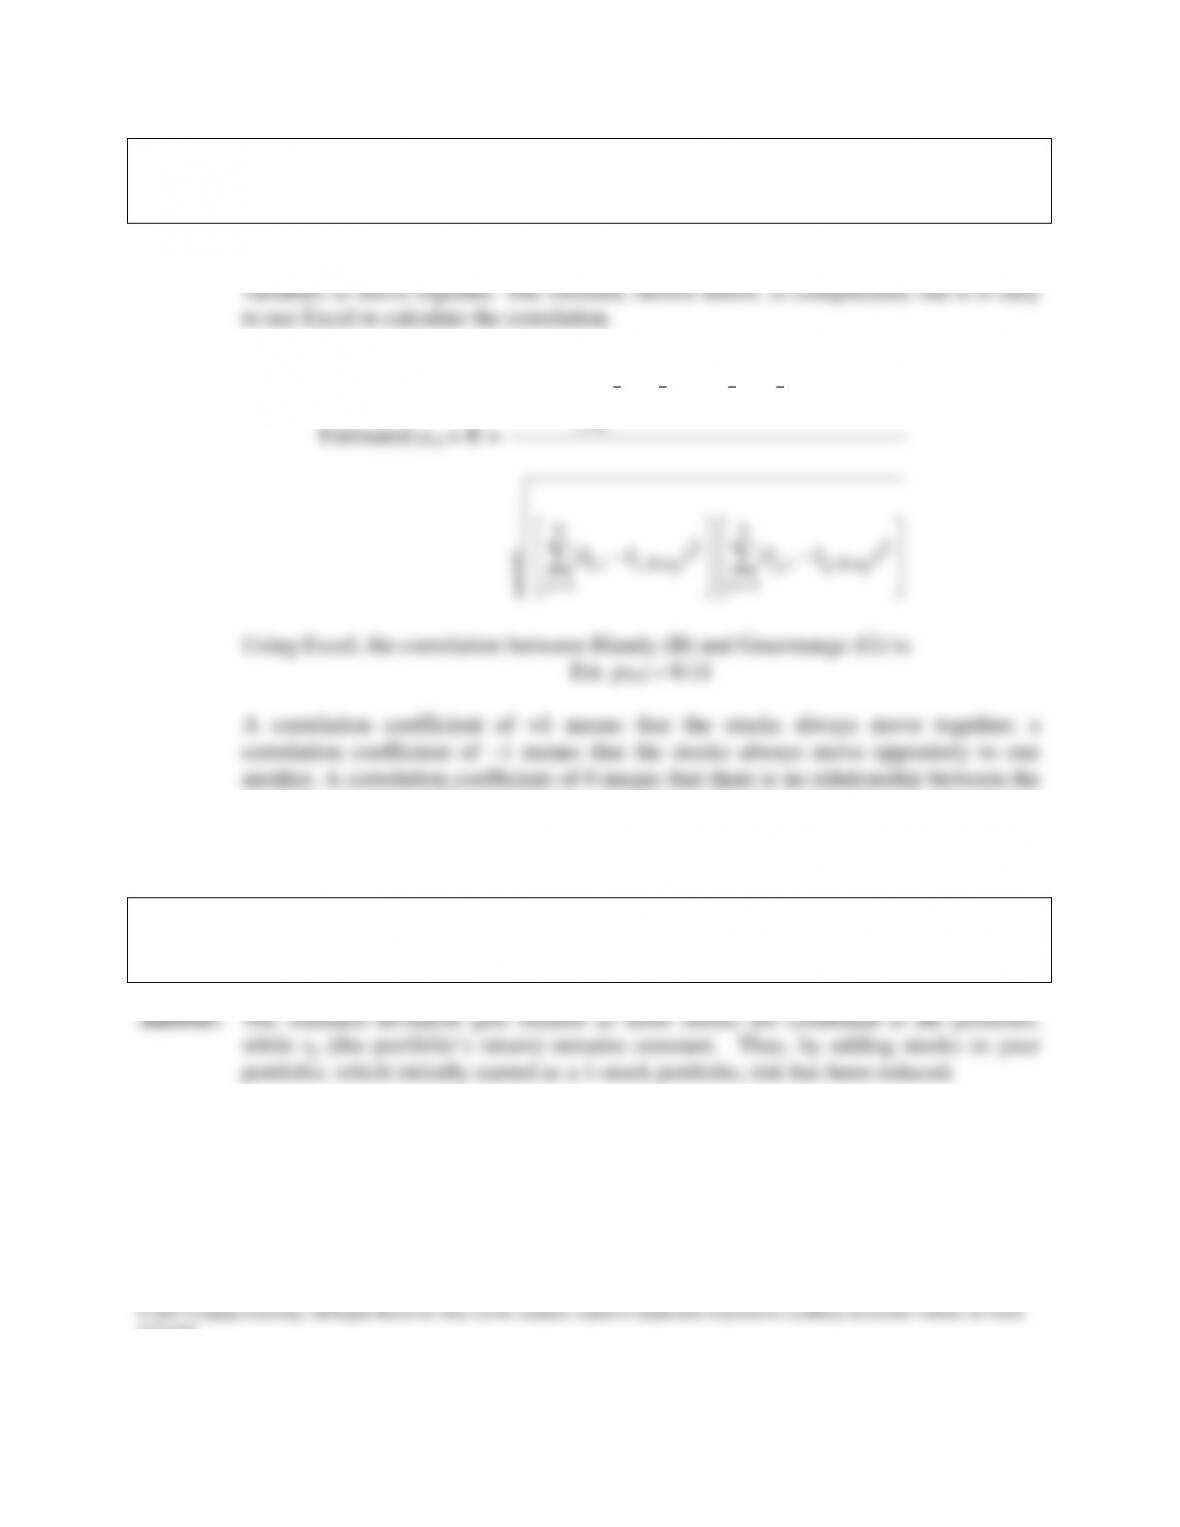
g. Explain correlation to your client. Calculate the estimated correlation between
Blandy and Gourmange. Does this explain why the portfolio standard deviation
was less than Blandy’s standard deviation?
Answer: Loosely speaking, the correlation (ρ) coefficient measures the tendency of two
T
)rr)(rr(
stocks’ movements. The correlation coefficient of 0.11 means that sometime when
Blandy is up, Gourmange is down, and vice versa. This makes the total risk of the
portfolio less than the risk of holding either stock by itself.
h. Suppose an investor starts with a portfolio consisting of one randomly selected
stock. As more and more randomly selected stocks are added to the portfolio,
what happens to the portfolio’s risk?


