Answers and Solutions: 6 – 1
or in part.
Chapter 6
Risk and Return
6-1 a. Stand-alone risk is only a part of total risk and pertains to the risk an investor takes by
holding only one asset. Risk is the chance that some unfavorable event will occur.
For instance, the risk of an asset is essentially the chance that the asset’s cash flows
will be unfavorable or less than expected. A probability distribution is a listing, chart
or graph of all possible outcomes, such as expected rates of return, with a probability
assigned to each outcome. When in graph form, the tighter the probability
distribution, the less uncertain the outcome.
b. The expected rate of return (^
r ) is the expected value of a probability distribution of
expected returns.
c. A continuous probability distribution contains an infinite number of outcomes and is
graphed from – and +.
d. The standard deviation (σ) is a statistical measure of the variability of a set of
observations. The variance (σ2) of the probability distribution is the sum of the
squared deviations about the expected value adjusted for deviation.
e. A risk averse investor dislikes risk and requires a higher rate of return as an
inducement to buy riskier securities. A realized return is the actual return an investor
receives on their investment. It can be quite different than their expected return.
f. A risk premium is the difference between the rate of return on a risk-free asset and the
expected return on Stock i which has higher risk. The market risk premium is the
difference between the expected return on the market and the risk-free rate.
g. CAPM is a model based upon the proposition that any stock’s required rate of return
is equal to the risk free rate of return plus a risk premium reflecting only the risk
remaining after diversification.
or in part.
return of the individual stocks in the portfolio, with the weights being the fraction of
are not related to one another; that is, they are independent.
j. Market risk is that part of a security’s total risk that cannot be eliminated by
diversification. It is measured by the beta coefficient. Diversifiable risk is also
known as company specific risk, that part of a security’s total risk associated with
stock with a beta less than 1..
l. The security market line (SML) represents in a graphical form, the relationship
between the risk of an asset as measured by its beta and the required rates of return
for individual securities. The SML equation is essentially the CAPM, ri = rRF +
all stocks, and the higher the required return.
Answers and Solutions: 6 – 3
or in part.
n. Equilibrium is the condition under which the expected return on a security is just
equal to its required return,
r
= r, and the market price is equal to the intrinsic value.
The Efficient Markets Hypothesis (EMH) states (1) that stocks are always in
equilibrium and (2) that it is impossible for an investor to consistently “beat the
movements is fully reflected in current market prices. Thus, information about recent
trends in a stock’s price is of no use in selecting a stock. Semistrong-form efficiency
states that current market prices reflect all publicly available information. Therefore,
the only way to gain abnormal returns on a stock is to possess inside information
market return minus the risk free rate), a second factor for size (defined as the return
on a portfolio of small firms minus the return on a portfolio of big firms), and a third
factor for the book-to-market effect (defined as the return on a portfolio of firms with
a high book-to-market ratio minus the return on a portfolio of firms with a low book–
when predicting future events. Herding is the tendency of investors to follow the
crowd. When combined with overconfidence, anchoring and herding can contribute to
market bubbles.
6-2 a. The probability distribution for complete certainty is a vertical line.
6-3 Security A is less risky if held in a diversified portfolio because of its lower beta and
6-4 The risk premium on a high beta stock would increase more.
low (say, 0.5), then the product will be small; RPj will increase by only half the increase
6-5 According to the Security Market Line (SML) equation, an increase in beta will increase
a company’s expected return by an amount equal to the market risk premium times the
Answers and Solutions: 6 – 5
or in part.
SOLUTIONS TO END-OF-CHAPTER PROBLEMS
6-1 Investment Beta
($20,000/$55,000)(0.7) + ($35,000/$55,000)(1.3) = 1.08.
6-2 rRF = 4%; rM = 12%; b = 0.8; rs = ?
6-3 rRF = 5%; RPM = 7%; rM = ?
6-4 Predicted return = ai + bi(r¯ M,t r¯ RF,t) + ci(r¯ SMB,t) + di(r¯ HML,t)
6-5
r
= (0.1)(-50%) + (0.2)(-5%) + (0.4)(16%) + (0.2)(25%) + (0.1)(60%)
= 11.40%.
σ2 = (-50% – 11.40%)2(0.1) + (-5% – 11.40%)2(0.2) + (16% – 11.40%)2(0.4)
+ (25% – 11.40%)2(0.2) + (60% – 11.40%)2(0.1)
6-6 a.
r
m= (0.3)(15%) + (0.4)(9%) + (0.3)(18%) = 13.5%.
r
j= (0.3)(20%) + (0.4)(5%) + (0.3)(12%) = 11.6%.
or in part.
6-8 a. ri = rRF + (rM – rRF)bi = 5% + (12% – 5%)1.4 = 14.8%.
b. 1. rRF increases to 6%:
rM decreases by 1%, from 12% to 11%.
ri = rRF + (rM – rRF)bi = 4% + (12% – 5%)1.4 = 13.8%.
or in part.
6-9 Old portfolio beta =
5,0007$
000,70$
(b) +
5,0007$
000,5$
(0.8)
1.2 = 0.9333b + 0.0533
1.1467 = 0.9333b
1.229 = b.
New portfolio beta = 0.9333(1.229) + 0.0667(1.6) = 1.25.
Alternative Solutions:
1. Old portfolio beta = 1.2 = (0.0667)b1 + (0.0667)b2 +…+ (0.0667)b20
portfolio is:
1.2286(0.9333) + 1.6(0.0667) = 1.1575 = 1.253.
or in part.
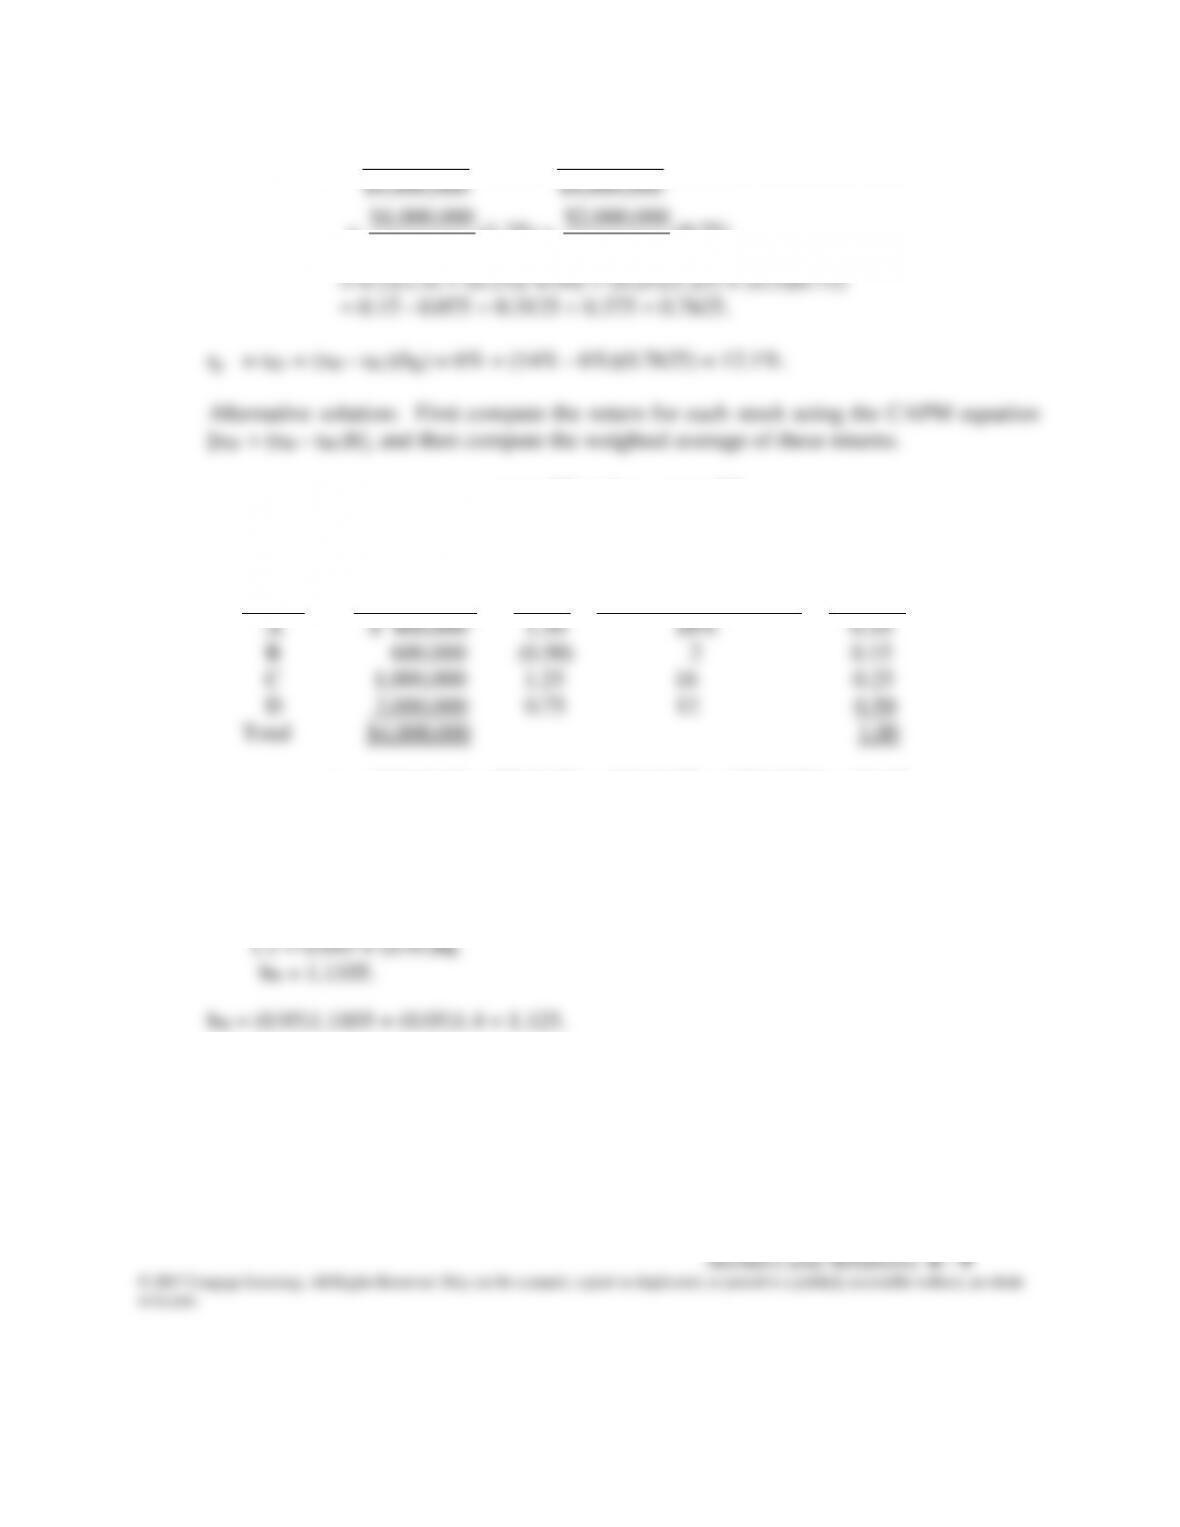
6-10 Portfolio beta =
$4,000,000
$400,000
(1.50) +
$4,000,000
$600,000
(-0.50)
+
$4,000,000
$1,000,000
(1.25) +
$4,000,000
$2,000,000
(0.75)
Stock Investment Beta r = rRF + (rM – rRF)b Weight
rp = 18%(0.10) + 2%(0.15) + 16%(0.25) + 12%(0.50) = 12.1%.
6-11 First, calculate the beta of what remains after selling the stock:
bp = 1.1 = ($100,000/$2,000,000)0.9 + ($1,900,000/$2,000,000)bR
or in part.
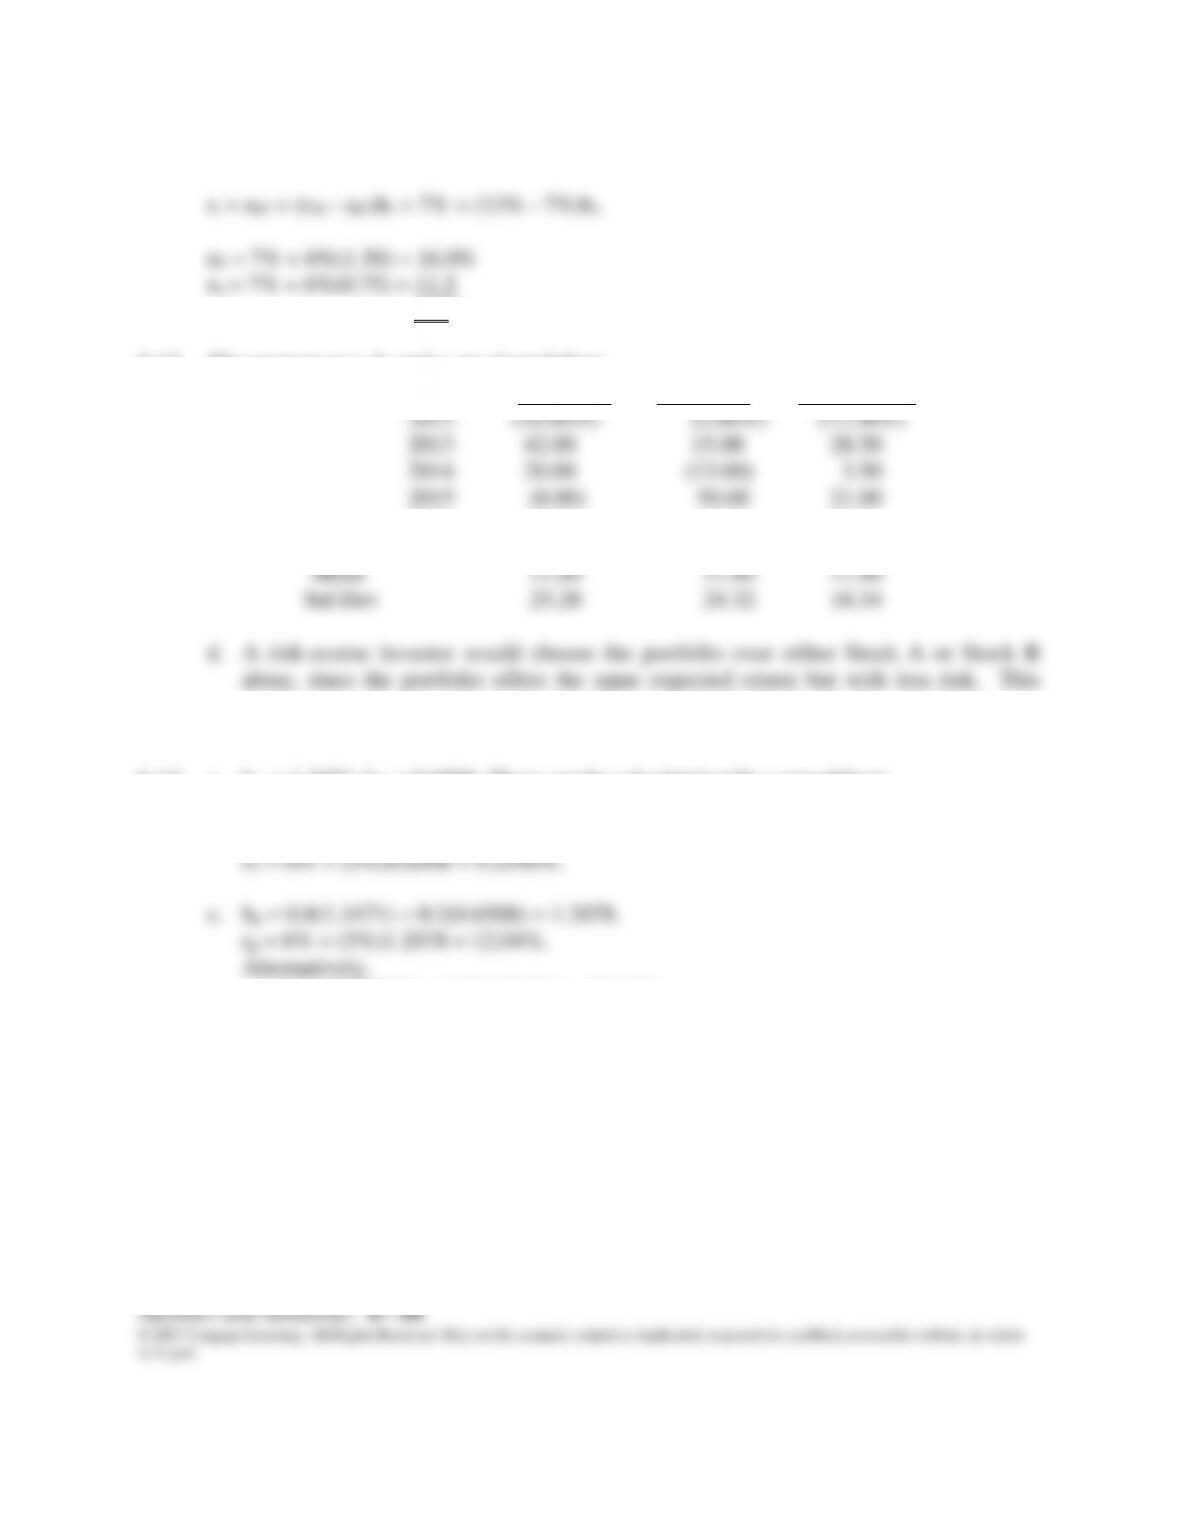
6-12 We know that bR = 1.50, bS = 0.75, rM = 13%, rRF = 7%.
4.5%
6-13 The answers to a, b, and c are given below:
¯rA ¯rB Portfolio
2016 25.00 12.00 18.50
result occurs because returns on A and B are not perfectly positively correlated (ρAB =
-0.13).
6-14 a. bX = 1.3471; bY = 0.6508. These can be calculated with a spreadsheet.
b. rX = 6% + (5%)1.3471 = 12.7355%.
rp = 0.8(12.7355%) + 0.2(9.254%) = 12.04%.