Unlock document.
This document is partially blurred.
Unlock all pages and 1 million more documents.
Get Access
Mini Case: 3 - 18
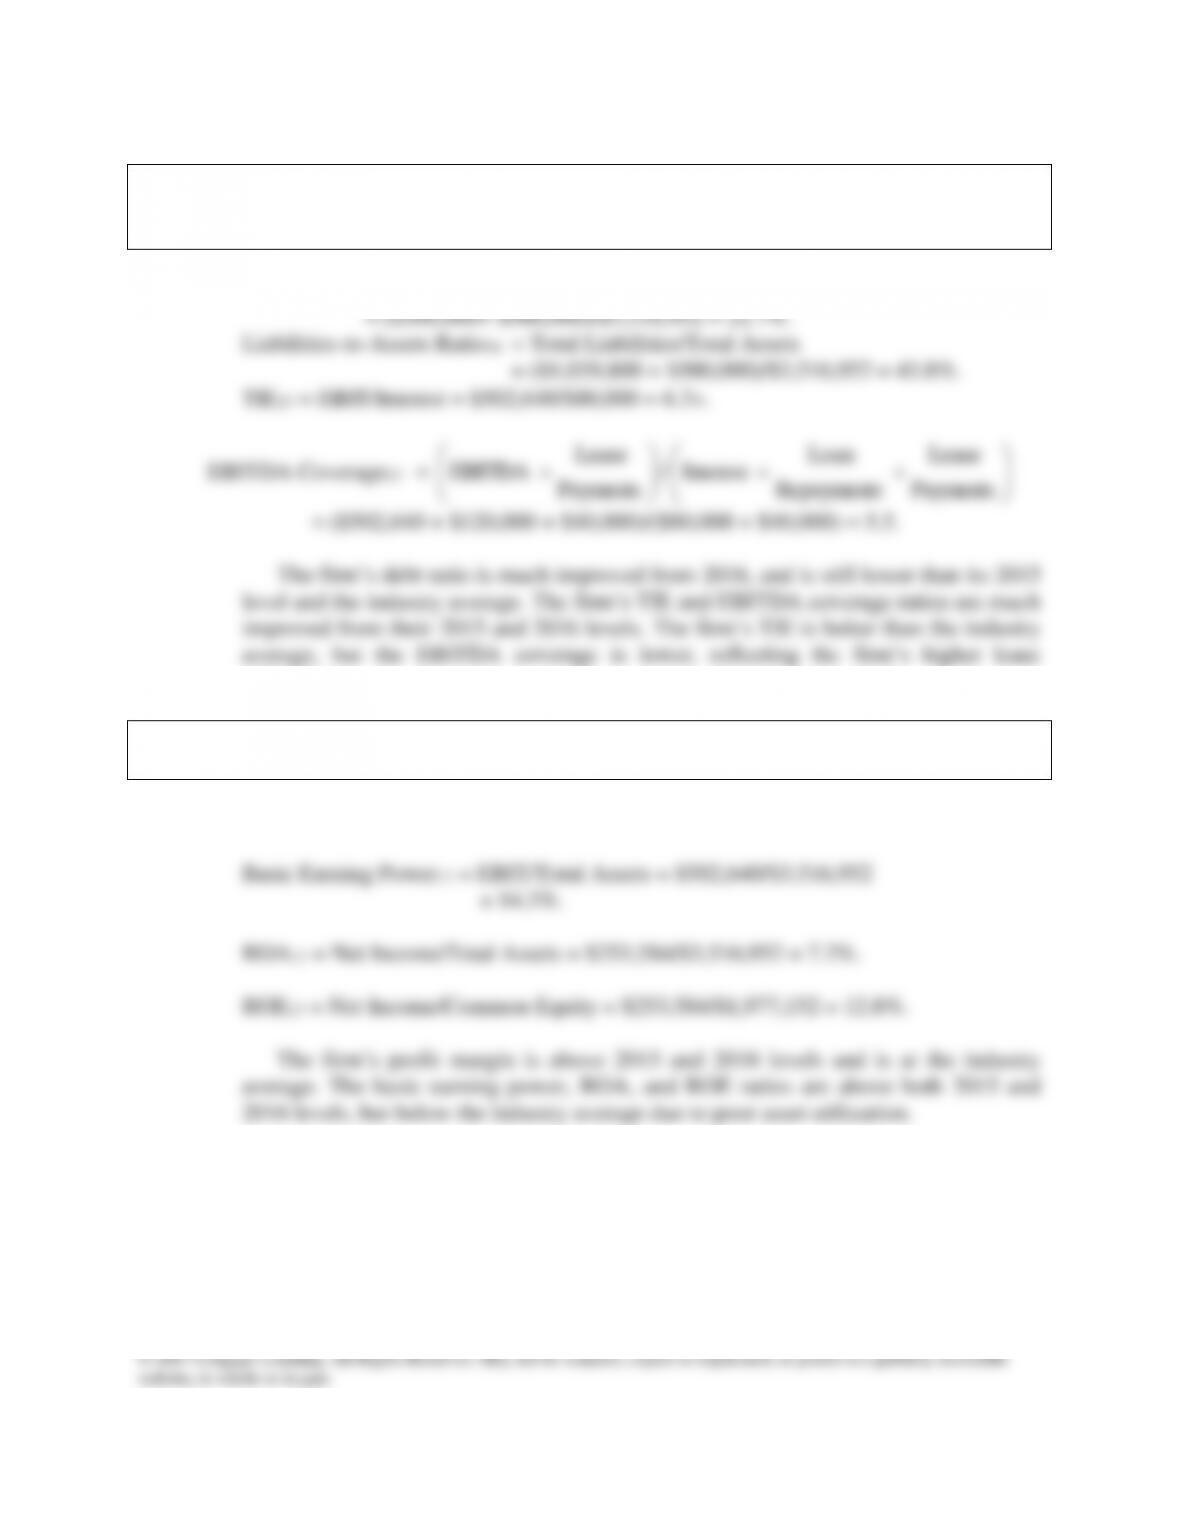
d. Calculate the 2017 debt ratio, liabilities-to-assets ratio, times-interest-earned,
and EBITDA coverage ratios. How does Computron compare with the industry
with respect to financial leverage? What can you conclude from these ratios?
Answer: Debt Ratio17 = Total Debt/Total Assets
obligations.
e. Calculate the 2017 profit margin, basic earning power (BEP), return on assets
(ROA), and return on equity (ROE). What can you say about these ratios?
Answer: Profit Margin17 = Net Income/Sales = $253,584/$7,035,600 = 3.6%.
Mini Case: 3 - 19
website, in whole or in part.
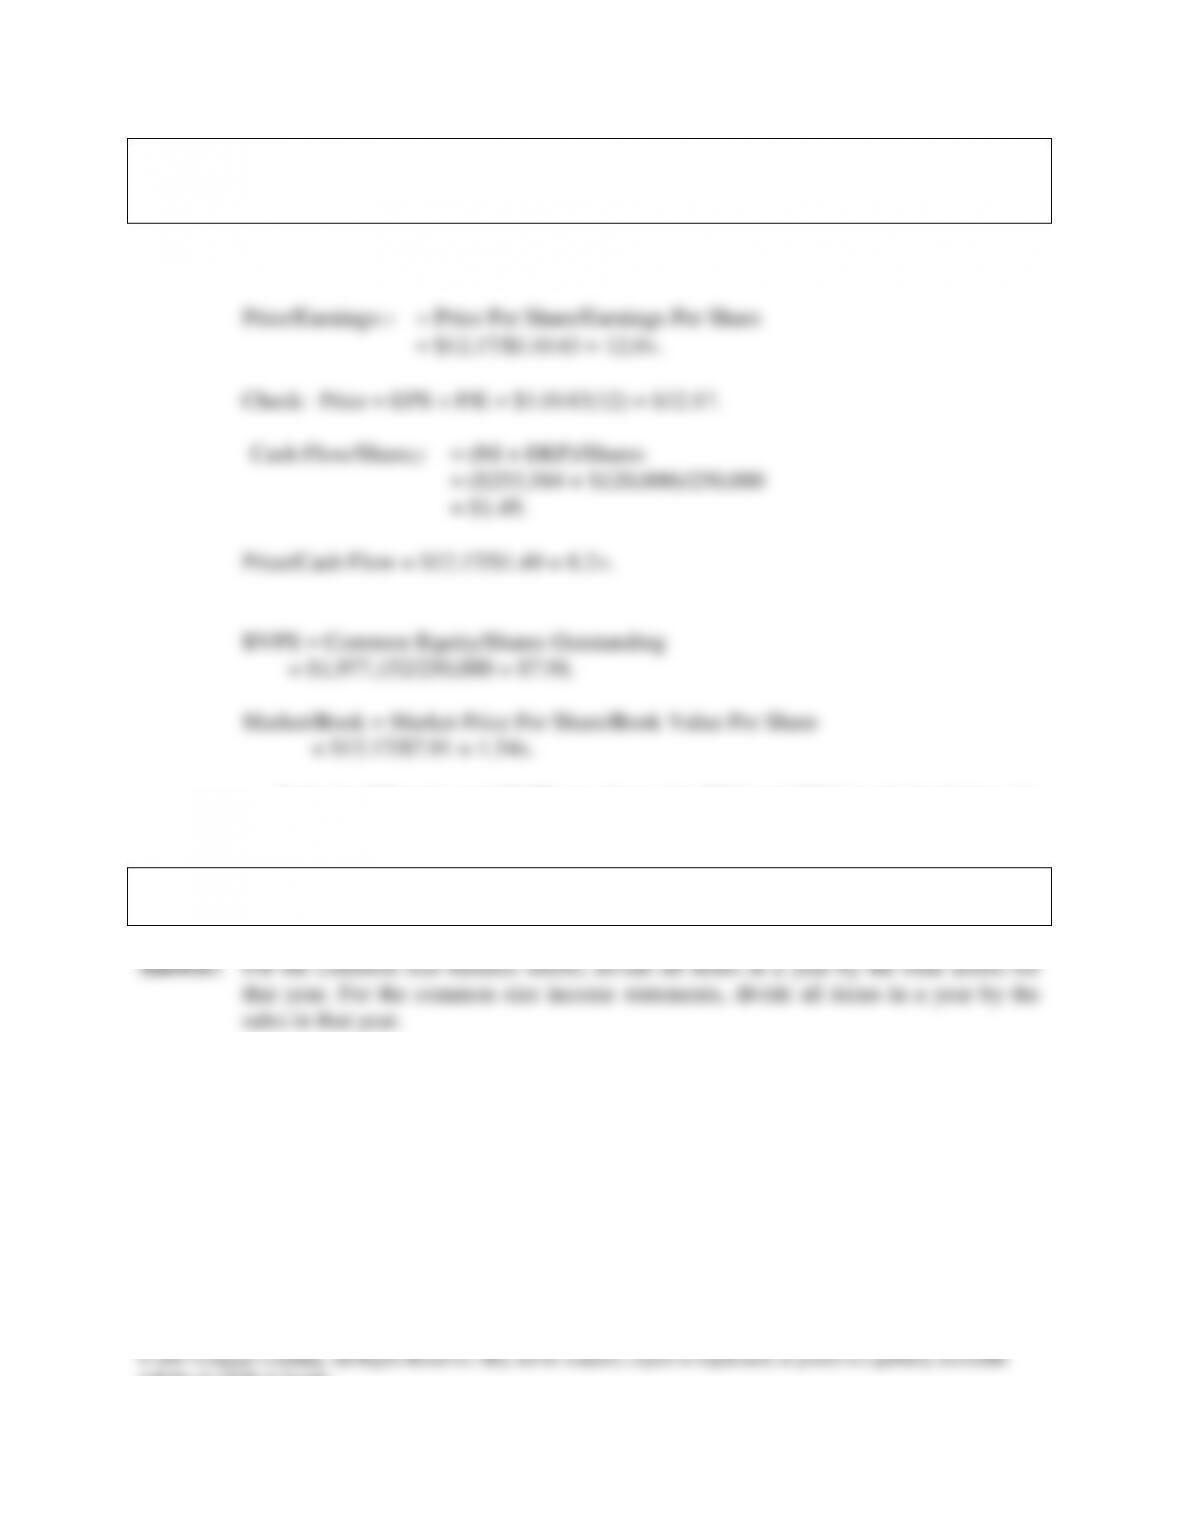
f. Calculate the 2017 price/earnings ratio, price/cash flow ratios, and market/book
ratio. Do these ratios indicate that investors are expected to have a high or low
opinion of the company?
Answer: EPS = Net Income/Shares Outstanding = $253,584/250,000 = $1.0143.
industry average.
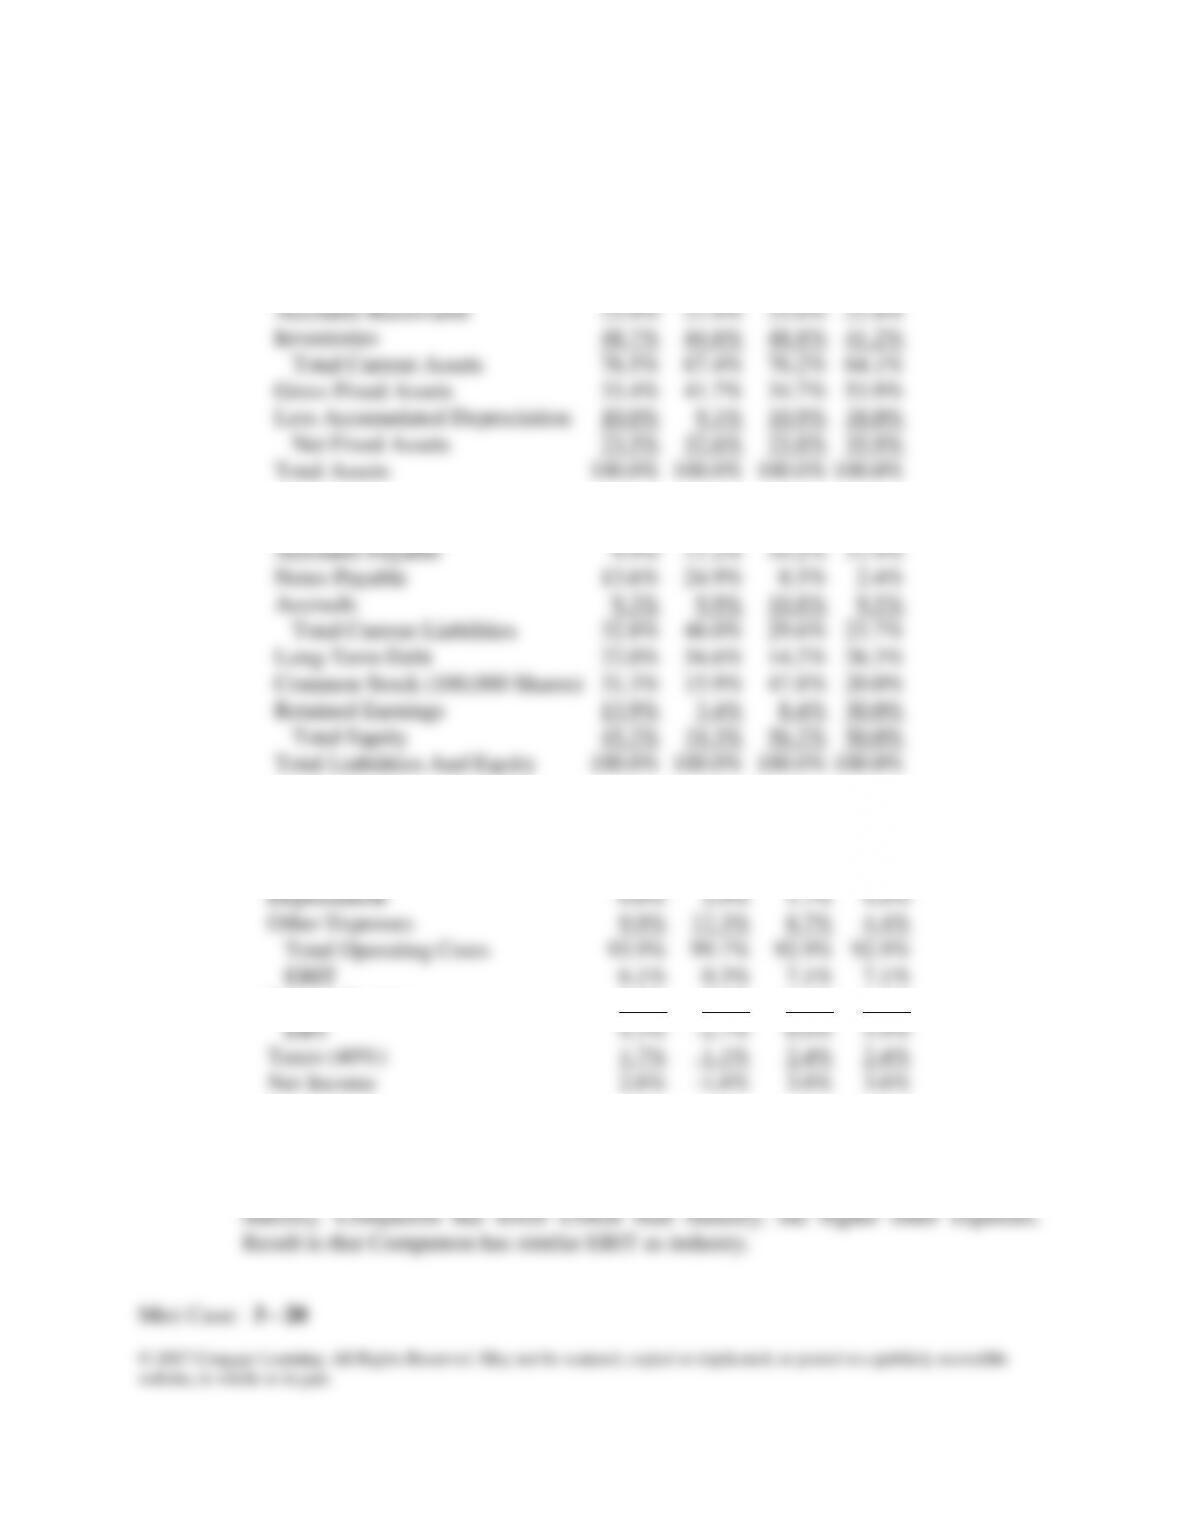
g. Perform a common size analysis and percent change analysis. What do these
analyses tell you about Computron?
Mini Case: 3 - 20
website, in whole or in part.
Common Size Balance Sheets
Assets
2015
2016
2017E
Ind.
Cash
0.6%
0.3%
0.4%
0.3%
Short Term Investments
3.3%
0.7%
2.0%
0.3%
Accounts Receivable
23.9%
21.9%
25.0%
22.4%
Inventories
48.7%
44.6%
48.8%
41.2%
Total Current Assets
76.5%
67.4%
76.2%
64.1%
Gross Fixed Assets
33.4%
41.7%
34.7%
53.9%
Less Accumulated Depreciation
10.0%
9.1%
10.9%
18.0%
Net Fixed Assets
23.5%
32.6%
23.8%
35.9%
Total Assets
100.0%
100.0%
100.0%
100.0%
Liabilities And Equity
2015
2016
2017E
Ind.
Accounts Payable
9.9%
11.2%
10.2%
11.9%
Notes Payable
13.6%
24.9%
8.5%
2.4%
Accruals
9.3%
9.9%
10.8%
9.5%
Total Current Liabilities
32.8%
46.0%
29.6%
23.7%
Long-Term Debt
22.0%
34.6%
14.2%
26.3%
Common Stock (100,000 Shares)
31.3%
15.9%
47.8%
20.0%
Retained Earnings
13.9%
3.4%
8.4%
30.0%
Total Equity
45.2%
19.3%
56.2%
50.0%
Total Liabilities And Equity
100.0%
100.0%
100.0%
100.0%
Common Size Income Statement
2015
2016
2017E
Ind.
Sales
100.0%
100.0%
100.0%
100.0%
Cost Of Goods Sold
83.4%
85.4%
82.4%
84.5%
Depreciation
0.6%
2.0%
1.7%
4.0%
Other Expenses
9.9%
12.3%
8.7%
4.4%
Total Operating Costs
93.9%
99.7%
92.9%
92.9%
EBIT
6.1%
0.3%
7.1%
7.1%
Interest Expense
1.8%
3.0%
1.1%
1.1%
EBT
4.3%
-2.7%
6.0%
5.9%
Taxes (40%)
1.7%
-1.1%
2.4%
2.4%
Net Income
2.6%
-1.6%
3.6%
3.6%
Computron has higher proportion of inventory and current assets than
industry. Computron has slightly more equity (which means less debt) than industry.
Computron has more short-term debt than industry, but less long-term debt than
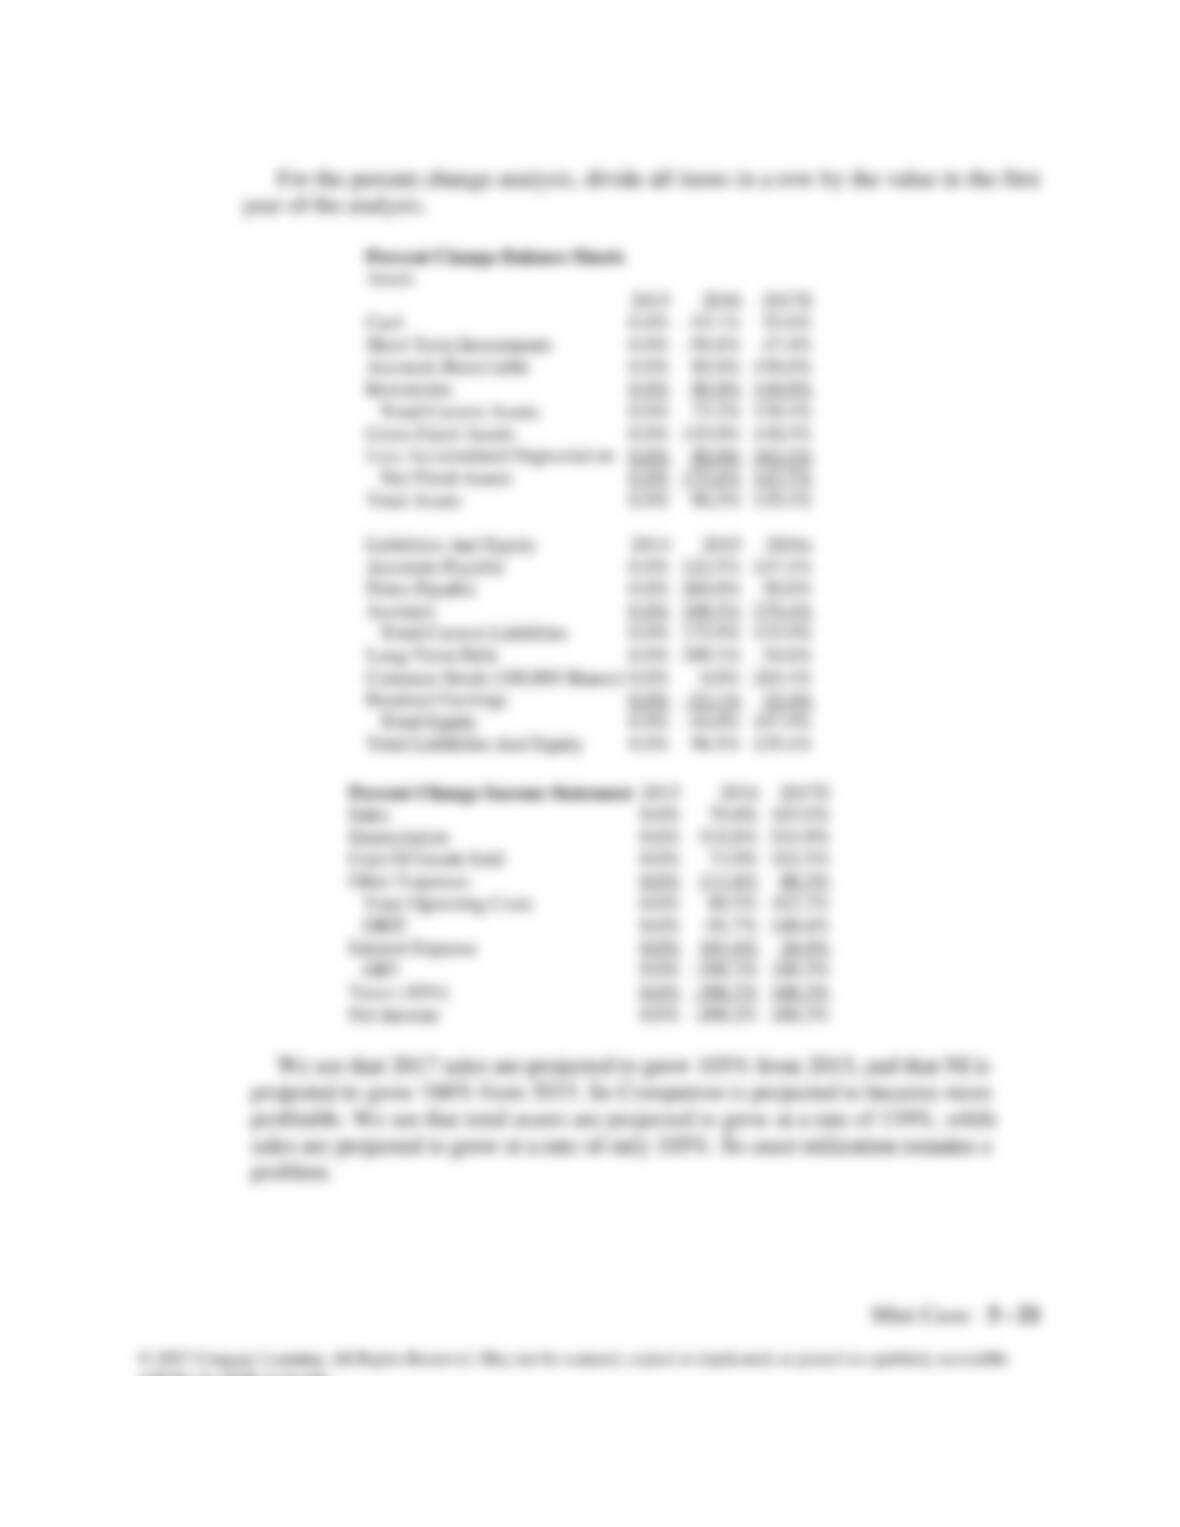
For the percent change analysis, divide all items in a row by the value in the first
year of the analysis.
Percent Change Balance Sheets
Assets
2015
2016
2017E
Cash
0.0%
-19.1%
55.6%
Short Term Investments
0.0%
-58.8%
47.4%
Accounts Receivable
0.0%
80.0%
150.0%
Inventories
0.0%
80.0%
140.0%
Total Current Assets
0.0%
73.2%
138.4%
Gross Fixed Assets
0.0%
145.0%
148.5%
Less Accumulated Depreciation
0.0%
80.0%
162.1%
Net Fixed Assets
0.0%
172.6%
142.7%
Total Assets
0.0%
96.5%
139.4%
Liabilities And Equity
2014
2015
2016e
Accounts Payable
0.0%
122.5%
147.1%
Notes Payable
0.0%
260.0%
50.0%
Accruals
0.0%
109.5%
179.4%
Total Current Liabilities
0.0%
175.9%
115.9%
Long-Term Debt
0.0%
209.2%
54.6%
Common Stock (100,000 Shares)
0.0%
0.0%
265.4%
Retained Earnings
0.0%
-52.1%
45.4%
Total Equity
0.0%
-16.0%
197.9%
Total Liabilities And Equity
0.0%
96.5%
139.4%
Mini Case: 3 - 22
website, in whole or in part.
h. Use the extended DuPont equation to provide a summary and overview of
Computron’s financial condition as projected for 2017. What are the firm’s
major strengths and weaknesses?
Answer: DuPont Equation =
Margin
Profit
Turnover
Assets Total
Multiplier
Equity
= 3.6% 2.0 ($3,516,952/$1,977,152)
= 3.6% 2.0 1.8 = 13.0%.
Strengths: The firm’s fixed assets turnover was above the industry average. However,
if the firm’s assets were older than other firms in its industry this could possibly
account for the higher ratio. (Computron’s fixed assets would have a lower historical
its profitability ratios are low (except profit margin); and its market value ratios are
low.
i. What are some potential problems and limitations of financial ratio analysis?
5. “Average” performance is not necessarily good.
6. Seasonal factors can distort ratios.
7. “Window dressing” techniques can make statements and ratios look better.
Mini Case: 3 - 23
website, in whole or in part.
j. What are some qualitative factors analysts should consider when evaluating a
company’s likely future financial performance?
Answer: Top analysts recognize that certain qualitative factors must be considered when
evaluating a company. These factors, as summarized by the American Association Of
Individual Investors (AAII), are as follows:
1. Are the company’s revenues tied to one key customer?


