Answers and Solutions: 3 – 1
website, in whole or in part.
Chapter 3
Analysis of Financial Statements
3-1 a. A liquidity ratio is a ratio that shows the relationship of a firm’s cash and other
current assets to its current liabilities. The current ratio is found by dividing current
assets by current liabilities. It indicates the extent to which current liabilities are
covered by those assets expected to be converted to cash in the near future. The
by dividing receivables by average sales per day. The fixed assets turnover ratio
measures how effectively the firm uses its plant and equipment. It is the ratio of sales
to net fixed assets. Total assets turnover ratio measures the turnover of all the firm’s
assets; it is calculated by dividing sales by total assets.
before the firm is unable to meet its annual interest costs. The EBITDA coverage
ratio is similar to the times-interest-earned ratio, but it recognizes that many firms
lease assets and also must make sinking fund payments. It is found by adding
EBITDA and lease payments then dividing this total by interest charges, lease
is the ratio of net income to total assets. Return on common equity is found by
dividing net income by common equity.
Answers and Solutions: 3 – 2
website, in whole or in part.
e. Market value ratios relate the firm’s stock price to its earnings and book value per
share. The price/earnings ratio is calculated by dividing price per share by earnings
profits. The price/cash flow is calculated by dividing price per share by cash flow per
share. This shows how much investors are willing to pay per dollar of cash flow.
Market-to-book ratio is simply the market price per share divided by the book value
per share. Book value per share is common equity divided by the number of shares
be found as the product of the profit margin times the total assets turnover. Window
dressing is a technique employed by firms to make their financial statements look
better than they really are. Seasonal factors can distort ratio analysis. At certain times
of the year a firm may have excessive inventories in preparation of a “season” of high
3-2 The emphasis of the various types of analysts is by no means uniform nor should it be.
Management is interested in all types of ratios for two reasons. First, the ratios point out
on the riskiness of equity commitments. Long-term creditors are more interested in the
debt ratio, TIE, and fixed-charge coverage ratios, as well as the profitability ratios. Short-
3-3 Given that sales have not changed, a decrease in the total assets turnover means that the
company’s assets have increased. Also, the fact that the fixed assets turnover ratio
Answers and Solutions: 3 – 3
3-4 Differences in the amounts of assets necessary to generate a dollar of sales cause asset
expenses incurred to produce sales. For example, one would expect a grocery store chain
3-5 a. Cash, receivables, and inventories, as well as current liabilities, vary over the year for
firms with seasonal sales patterns. Therefore, those ratios that examine balance sheet
be much larger than beginning-of-year equity, so the calculated rate of return on
equity will be different depending on whether end-of-year, beginning-of-year, or
being evaluated.
3-6 Firms within the same industry may employ different accounting techniques, which make
it difficult to compare financial ratios. More fundamentally, comparisons may be
misleading if firms in the same industry differ in their other investments. For example,
comparing PepsiCo and Coca-Cola may be misleading because apart from their soft drink
business, Pepsi also owns other businesses such as Frito-Lay, Pizza Hut, Taco Bell, and
KFC.
SOLUTIONS TO END-OF-CHAPTER PROBLEMS
3-1 DSO = 20 days; ADS = $20,000; AR = ?
.
000,400AR = $
000,20$
AR
= 20
365
S
AR
DSO =
3-2 TA = $200 million, notes payable =$5 million, and LT debt = $25 million.
debtTotal
$25$5
3-3 TA = $10,000,000,000; CL = $1,000,000,000; LT debt = $3,000,000,000; CE =
$6,000,000,000; Shares outstanding = 800,000,000; P0 = $75; M/B = ?
3-6 ROA = 12%; PM = 5%; ROE = 20%; S/TA = ?; A/E = ?
ROA = NI/A; PM = NI/S; ROE = NI/E
ROE = PM S/TA TA/E
NI/E = NI/S S/TA TA/E
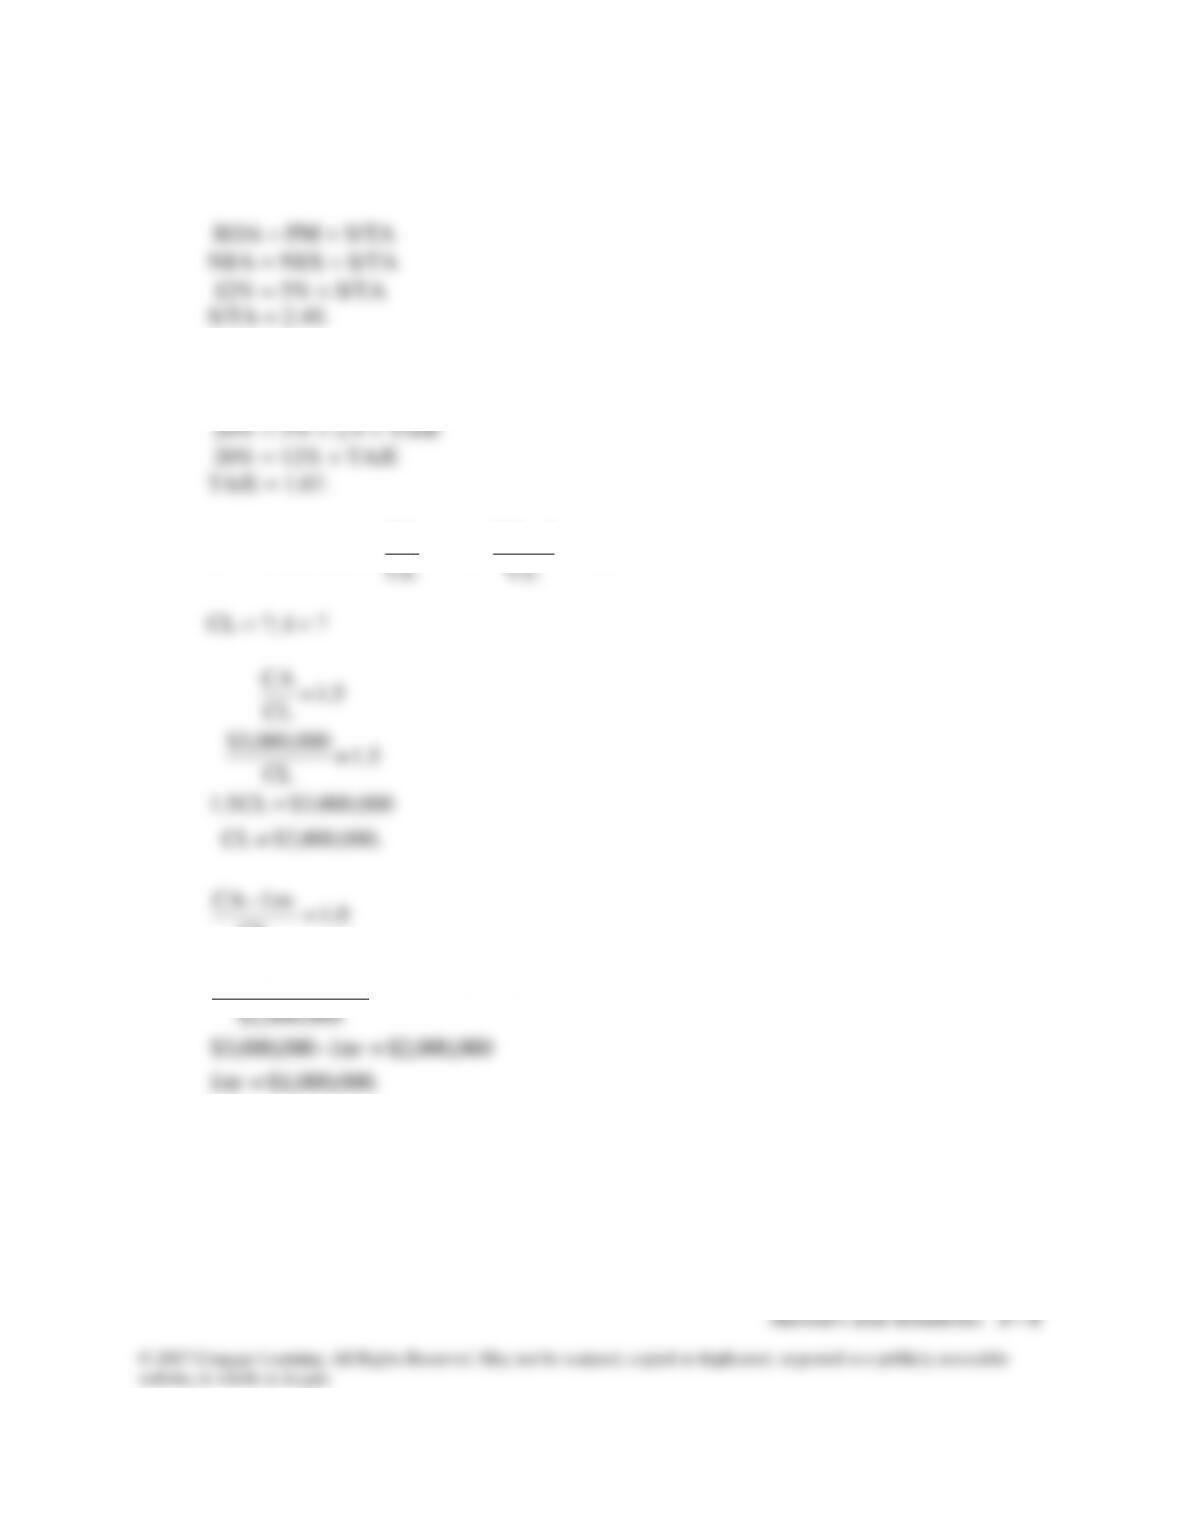
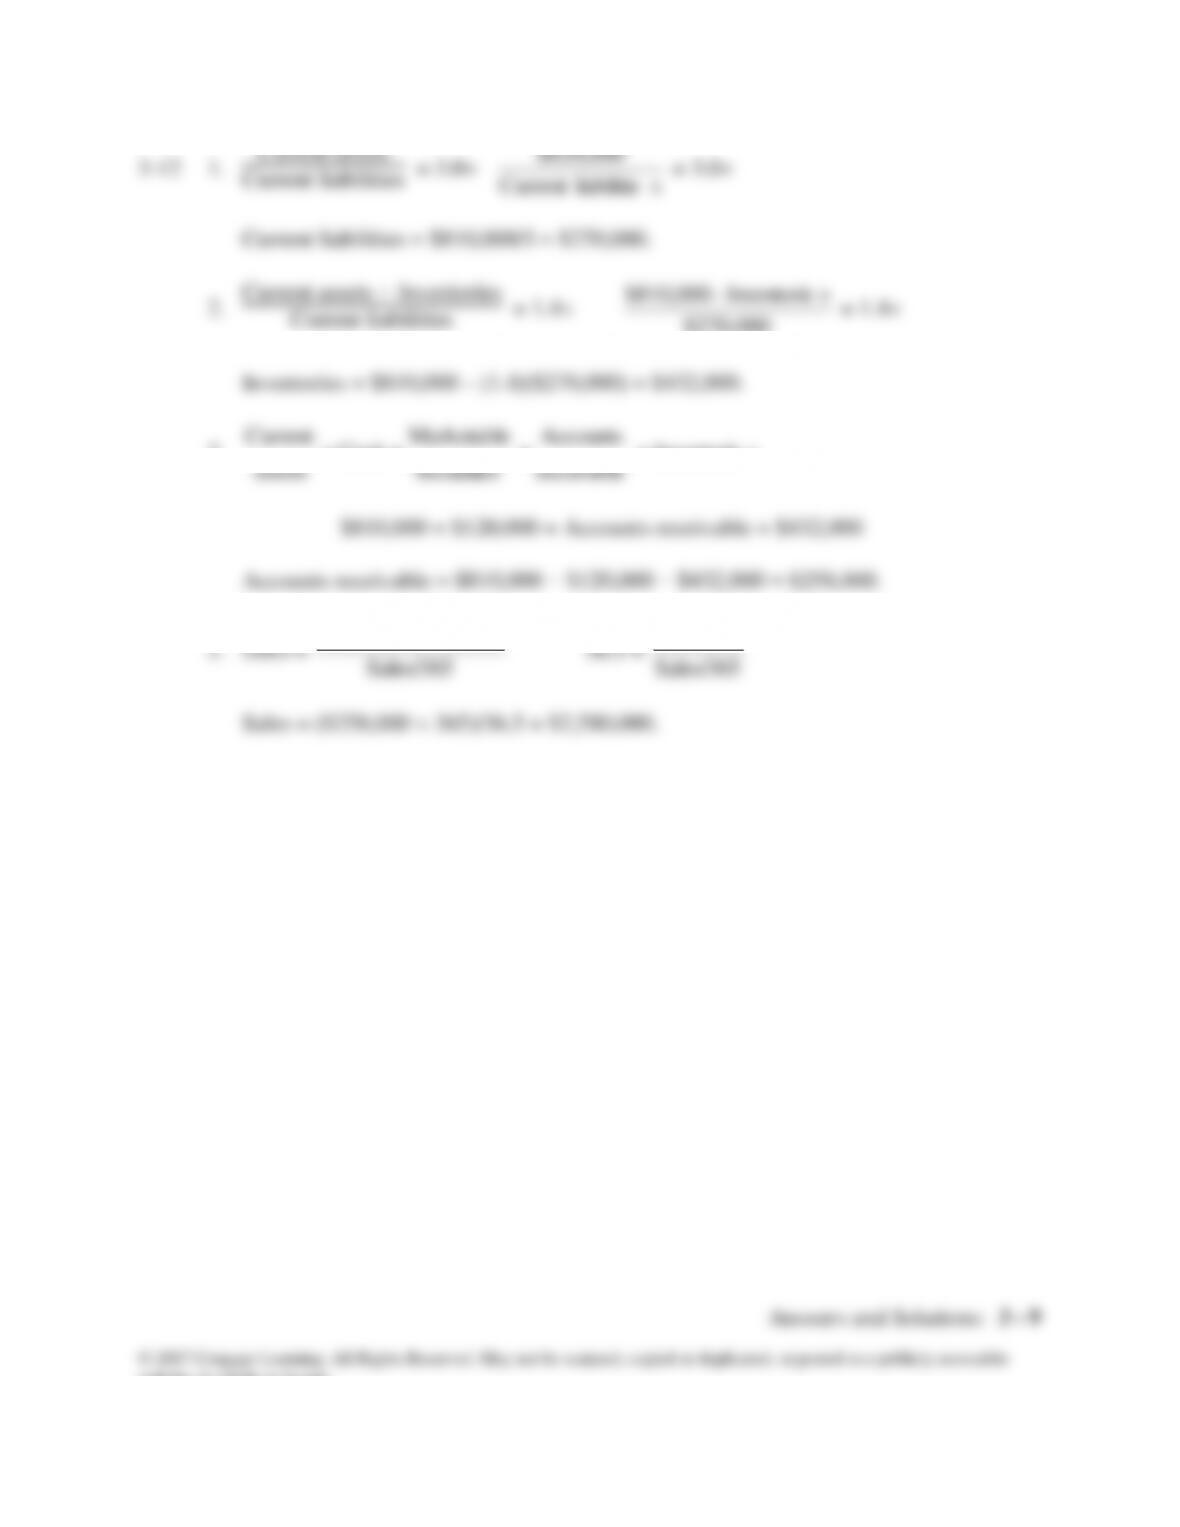
3-7 CA = $3,000,000;
CL
CA
= 1.5;
CL
I – CA
= 1.0;
CL = ?; I = ?
.$2,000,000 = CL
$3,000,000 = CL1.5
1.5 =
CL
$3,000,000
1.5 =
CL
CA
1.0 =
CL
nvI –CA
1.0 =
$2,000,000
nvI – $3,000,000
$2,000,000 = nvI – $3,000,000
.$1,000,000 = nvI
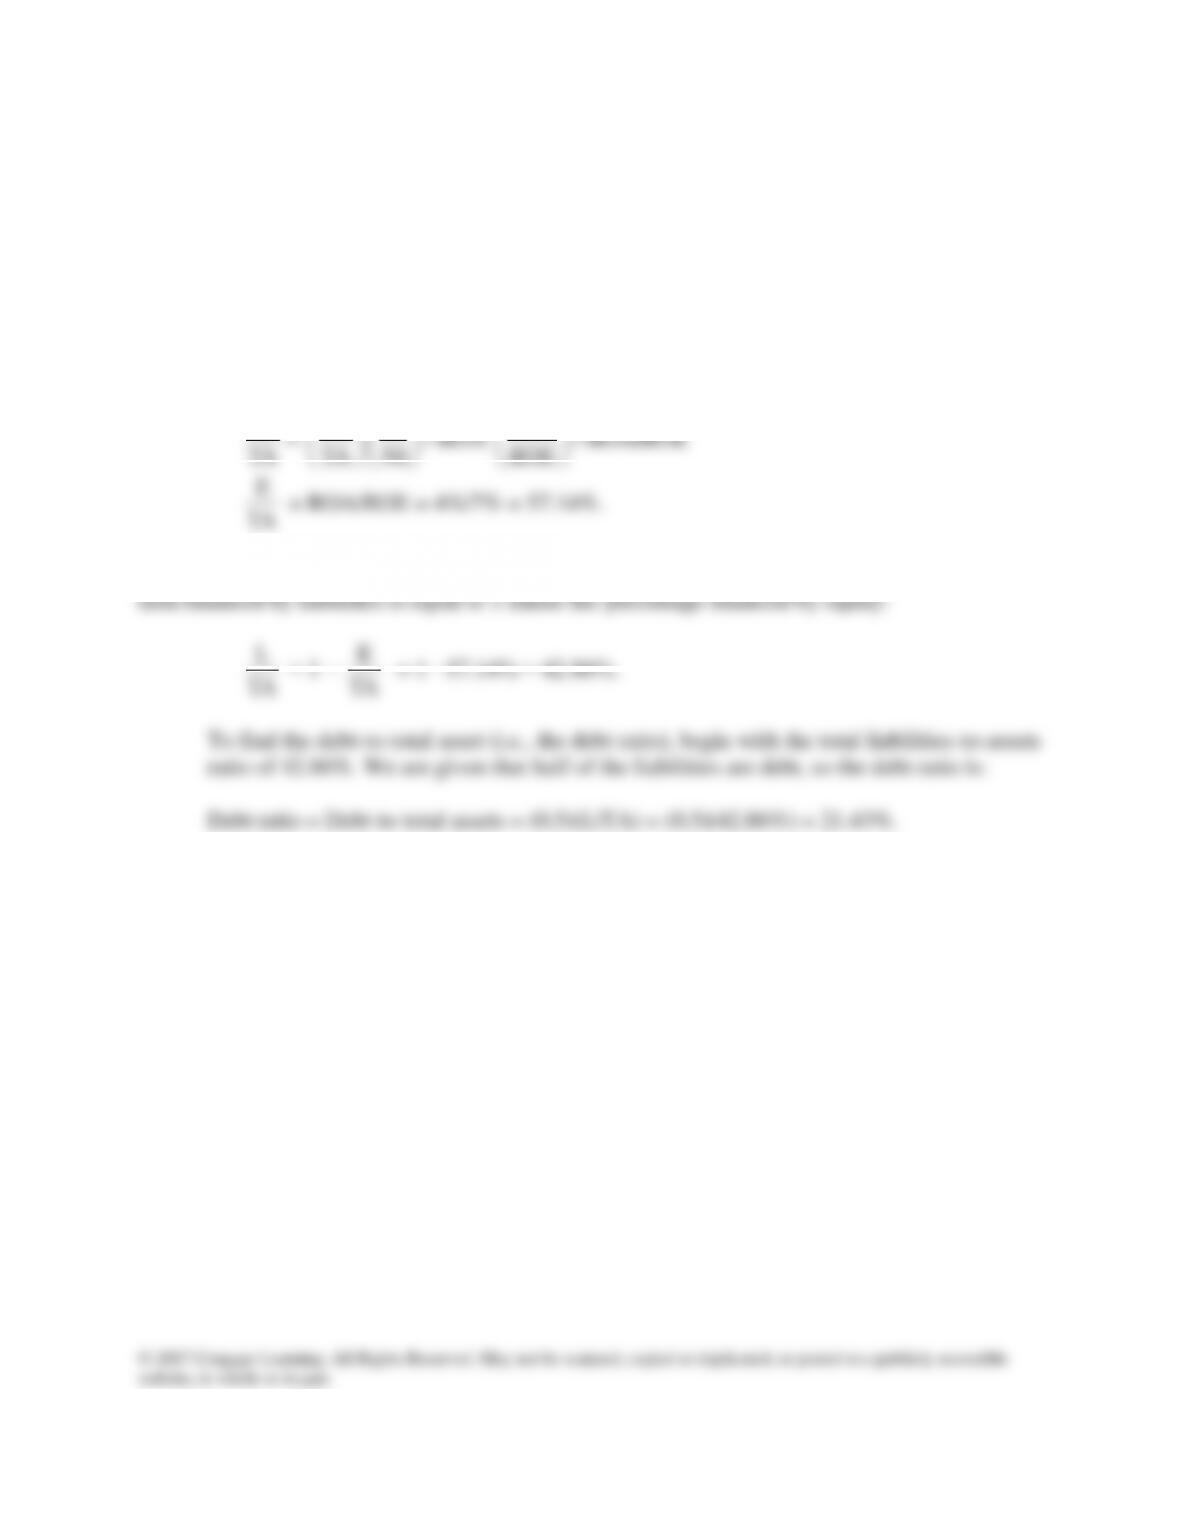
3-8 We are given ROA = 4%, ROE = 7%, and TAT = Sales/Total assets = 1.2.
From DuPont equation: ROA = Profit margin Total assets turnover
4% = Profit margin (1.2)
Profit margin = 4%/1.2 = 3.33%.
We can also calculate the company’s liabilities-to-assets (L/TA) ratio in a similar
manner, given the facts of the problem. We are given ROA = NI/TA and ROE= NI/E. We
begin by finding the percentage of assets financed by equity, E/TA:
ROA/ROE
ROE
1
ROA
NI
E
TA
NI
=
TA
E
TA
E
= ROA/ROE = 4%/7% = 57.14%.
By definition, L + E = Total liabilities & Equity = TA. Therefore, the percentage of the
Answers and Solutions: 3 – 7
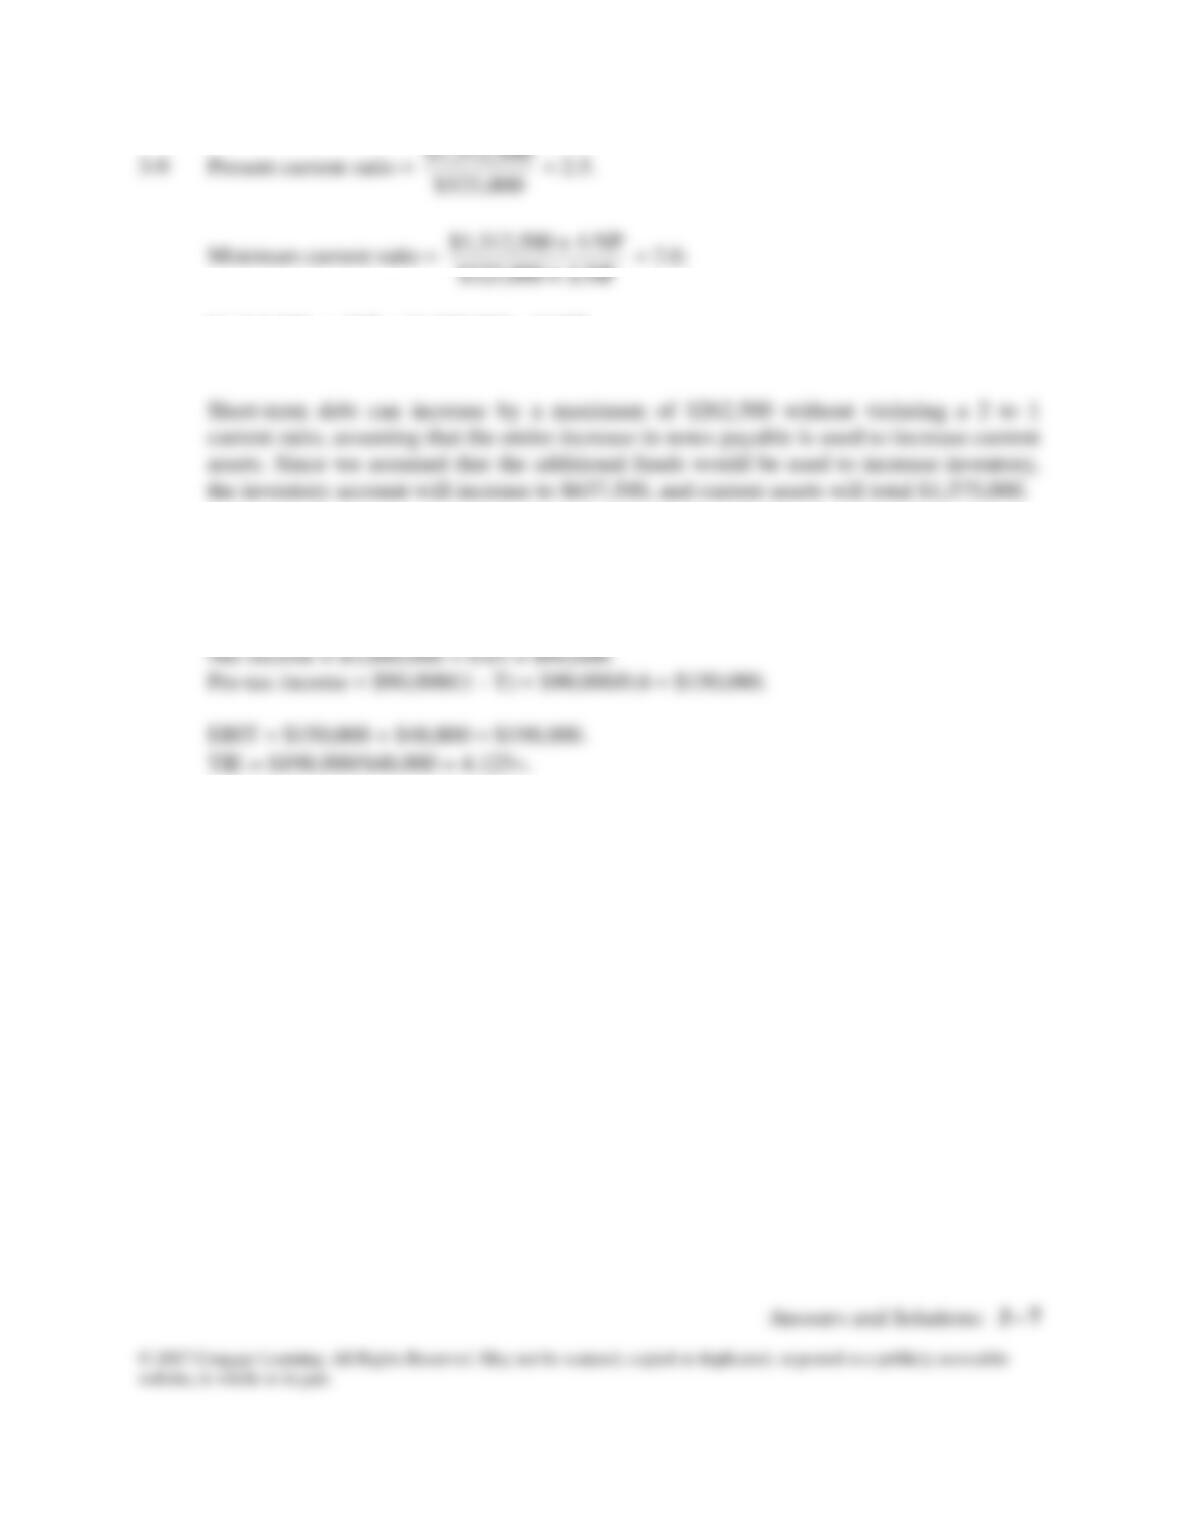
3-9 Present current ratio =
$525,000
$1,312,500
= 2.5.
Minimum current ratio =
NP + $525,000
NP + $1,312,500
= 2.0.
$1,312,500 + ∆NP = $1,050,000 + 2∆NP
∆NP = $262,500.
Quick ratio = ($1,575,000 – $637,500)/$787,500 = $937,500/$787,500 = 1.19.
3-10 TIE = EBIT/INT, so find EBIT and INT.
Interest = $600,000 0.08 = $48,000.
The loan will not be renewed and they will go bankrupt!
website, in whole or in part.
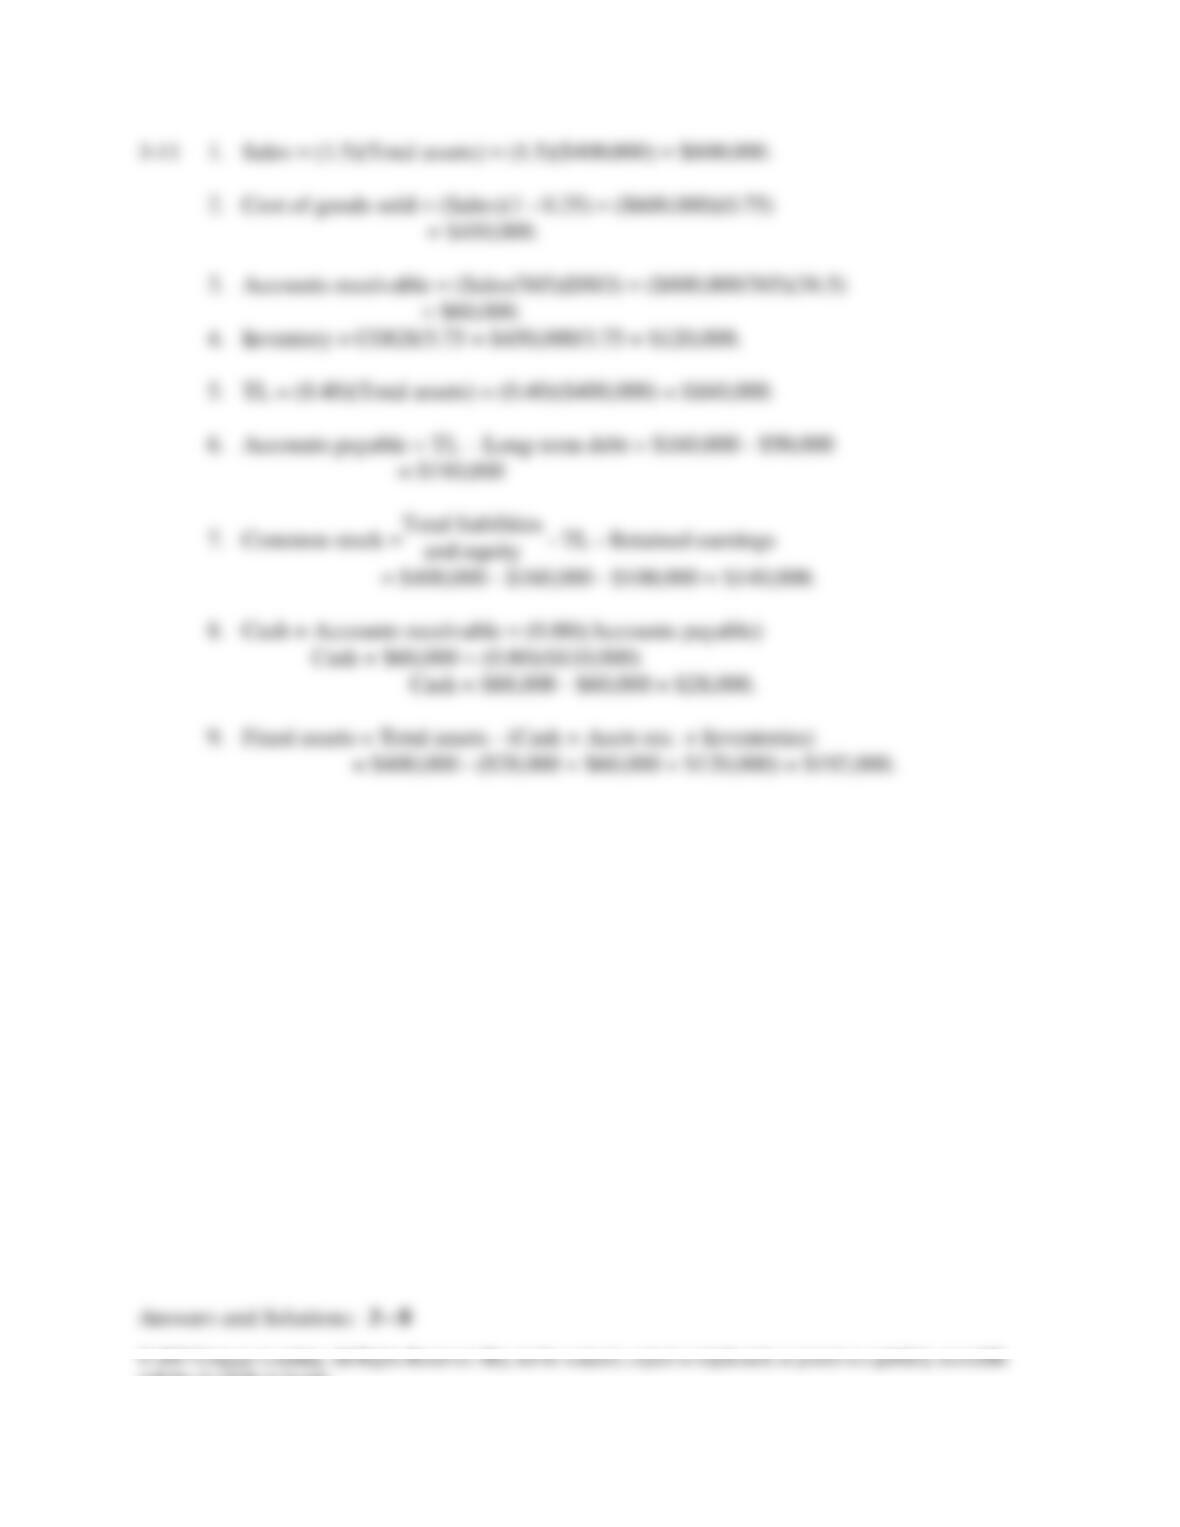
3-11 1. Sales = (1.5)(Total assets) = (1.5)($400,000) = $600,000.
2. Cost of goods sold = (Sales)(1 – 0.25) = ($600,000)(0.75)
5. TL = (0.40)(Total assets) = (0.40)($400,000) = $160,000.
and equity – TL – Retained earnings
= $400,000 – $160,000 – $100,000 = $140,000.
= $400,000 – ($28,000 + $60,000 + $120,000) = $192,000.
3-12 1. Current assets
Current liabilities
= 3.0
sliabilitieCurrent
$810,000
= 3.0
Current liabilities = $810,000/3 = $270,000.
2. Current assets − Inventories
Current liabilities
= 1.4
$270,000
sInventorie – $810,000
= 1.4
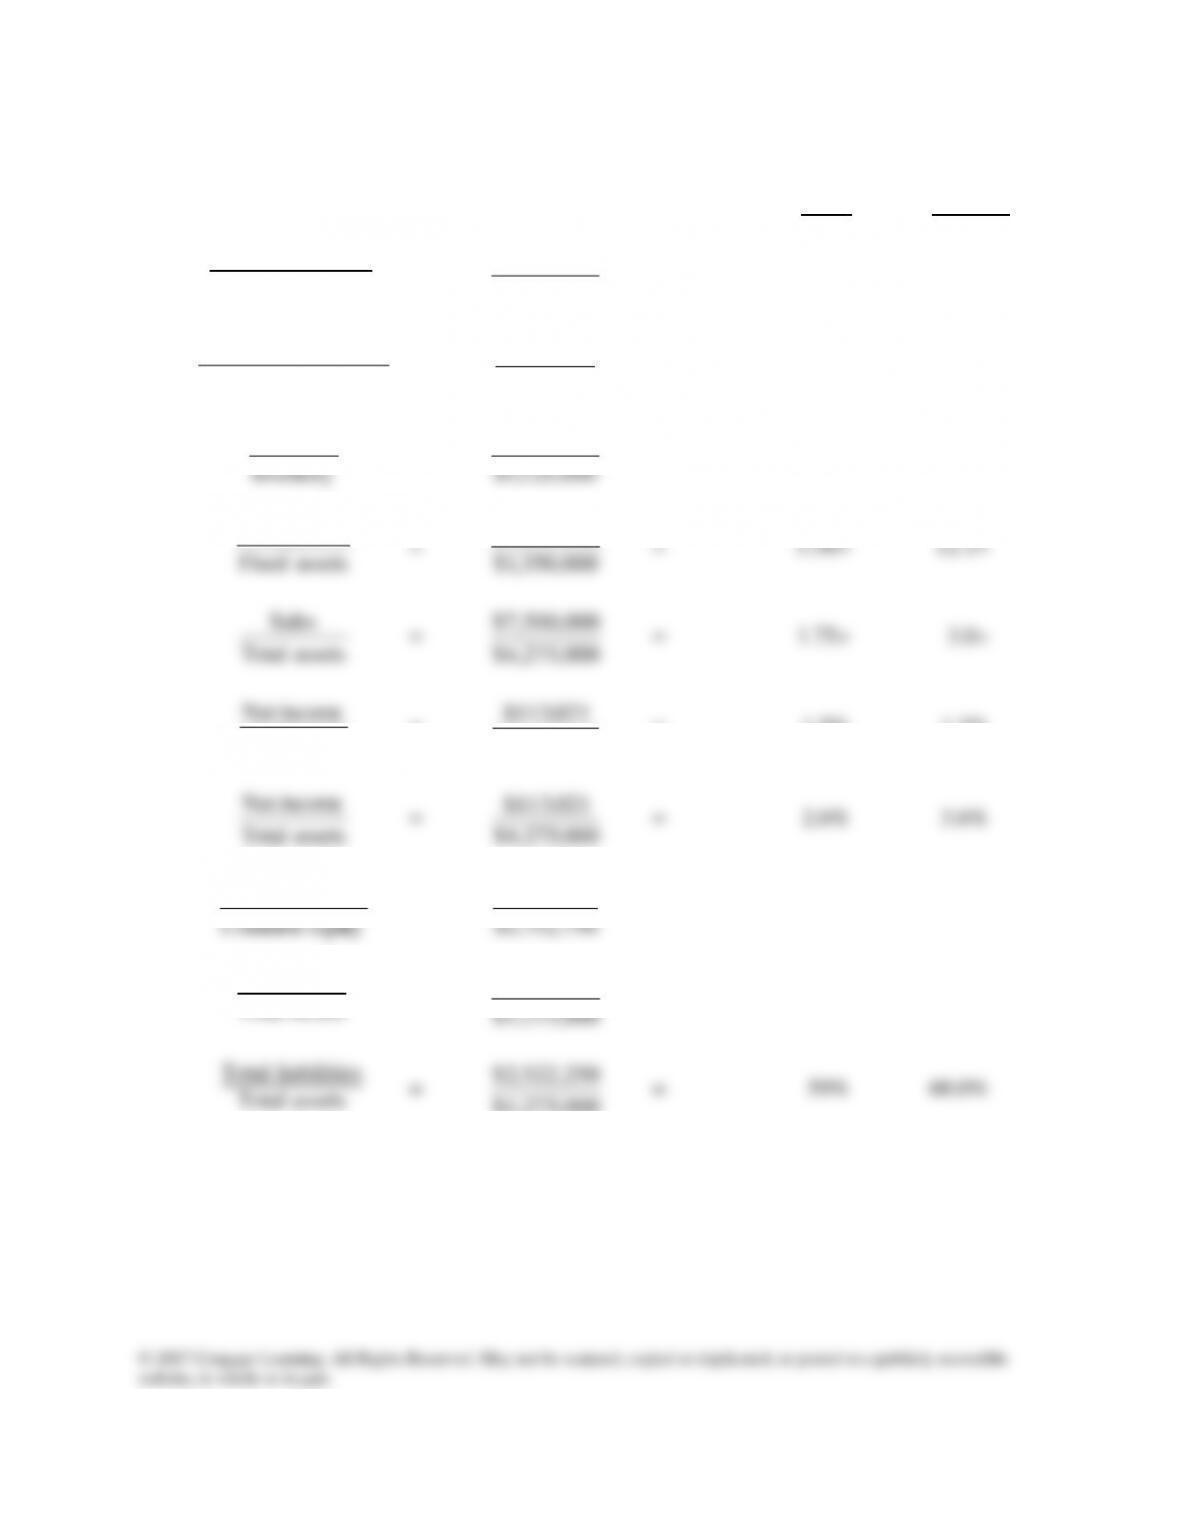
3-13 a. (Dollar amounts in thousands.)
Industry
Firm Average
Current assets
Current liabilities
=
005,453,1$
,000925,2$
= 2.01 2.0
536Sales/
receivable Accounts
=
548,20$
000,575,1$
= 77 days 35 days
Inventory
COGS
=
000,125,1$
000,375,6$
= 5.67 6.7
Sales
000,500,7$
Sales
incomeNet
=
000,500,7$
021,113$
= 1.5% 1.2%