Mini Case: 27 – 21
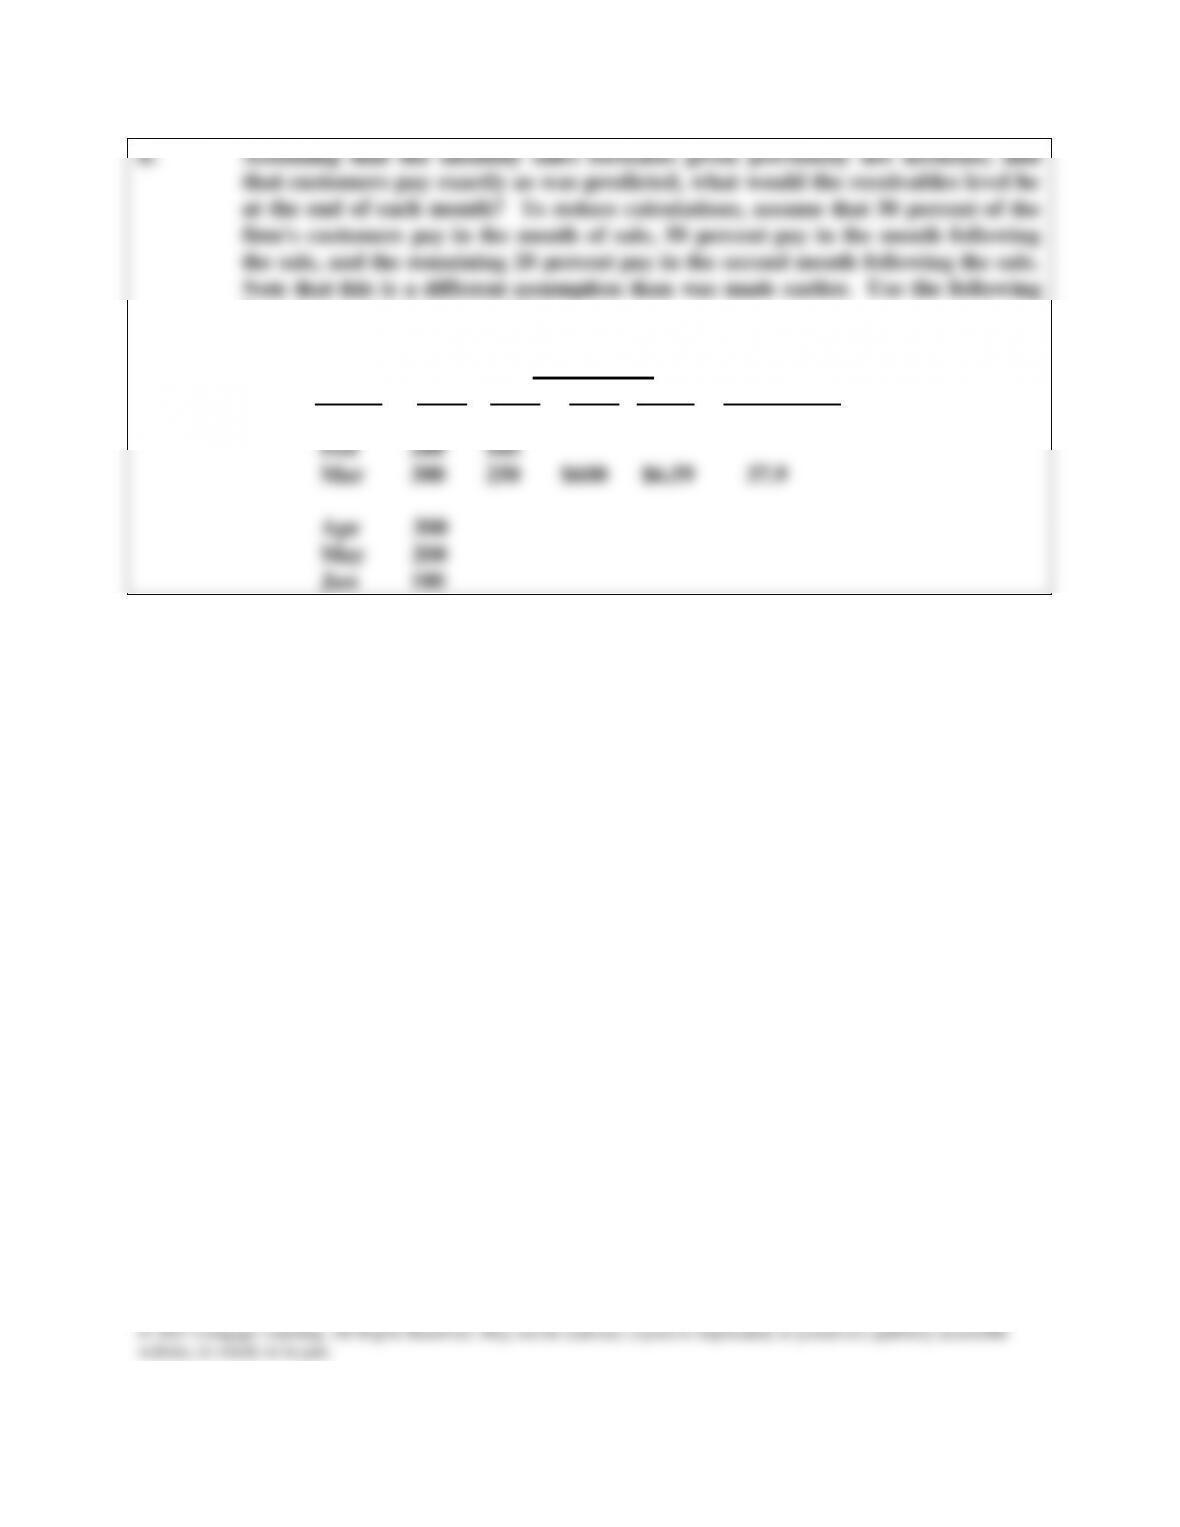
format to answer parts c and d:
E.O.M. Quarterly DSO =
Month Sales AR Sales ADS (AR)/(ADS)
Jan $100 $ 70
Mini Case: 27- 22
© 2017 Cengage Learning. All Rights Reserved. May not be scanned, copied or duplicated, or posted to a publicly accessible
website, in whole or in part.
Answer: (Note: from this point on, the solutions are expressed in thousands of dollars. Also,
the table given below is developed in the solutions to parts D and E.)
At the end of January, 30 percent of the $100 in sales will have been collected, so
(1 – 0.3)($100) = 0.7($100) = $70 will remain outstanding, that is, in the receivables
account. At the end of February, 30% + 50% = 80% of January’s sales will have been
collected, so receivables associated with January sales will be (1 – 0.3 – 0.5)($100) =
0.2($100) = $20. Of February’s $200 in sales, 30 percent will have been collected, so
0.7($200) = $140 will remain outstanding. Thus, the receivables balance at the end of
February will be $20 from January’s sales plus $140 from February’s sales, for a total
of $160.
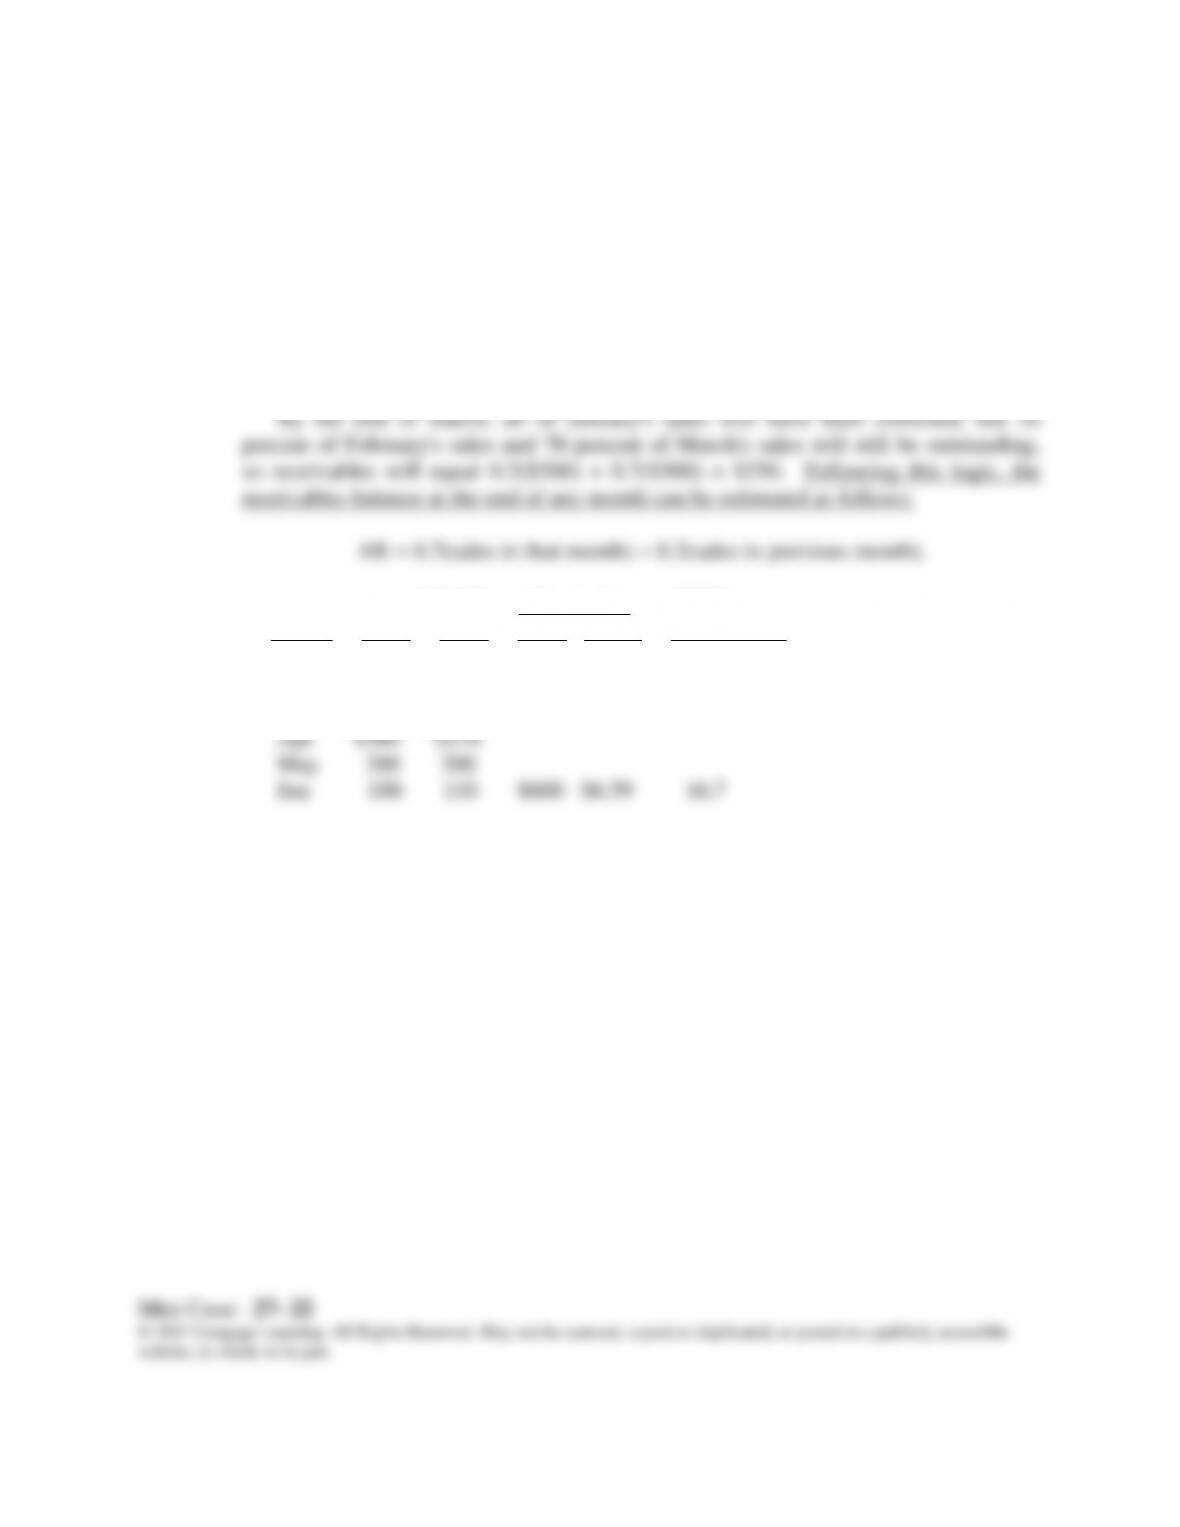
E.O.M. Quarterly DSO =
Month Sales AR Sales ADS (AR)/(ADS)
Jan $100 $ 70
Feb 200 160
Mar 300 250 $600 $6.59 37.9
website, in whole or in part.
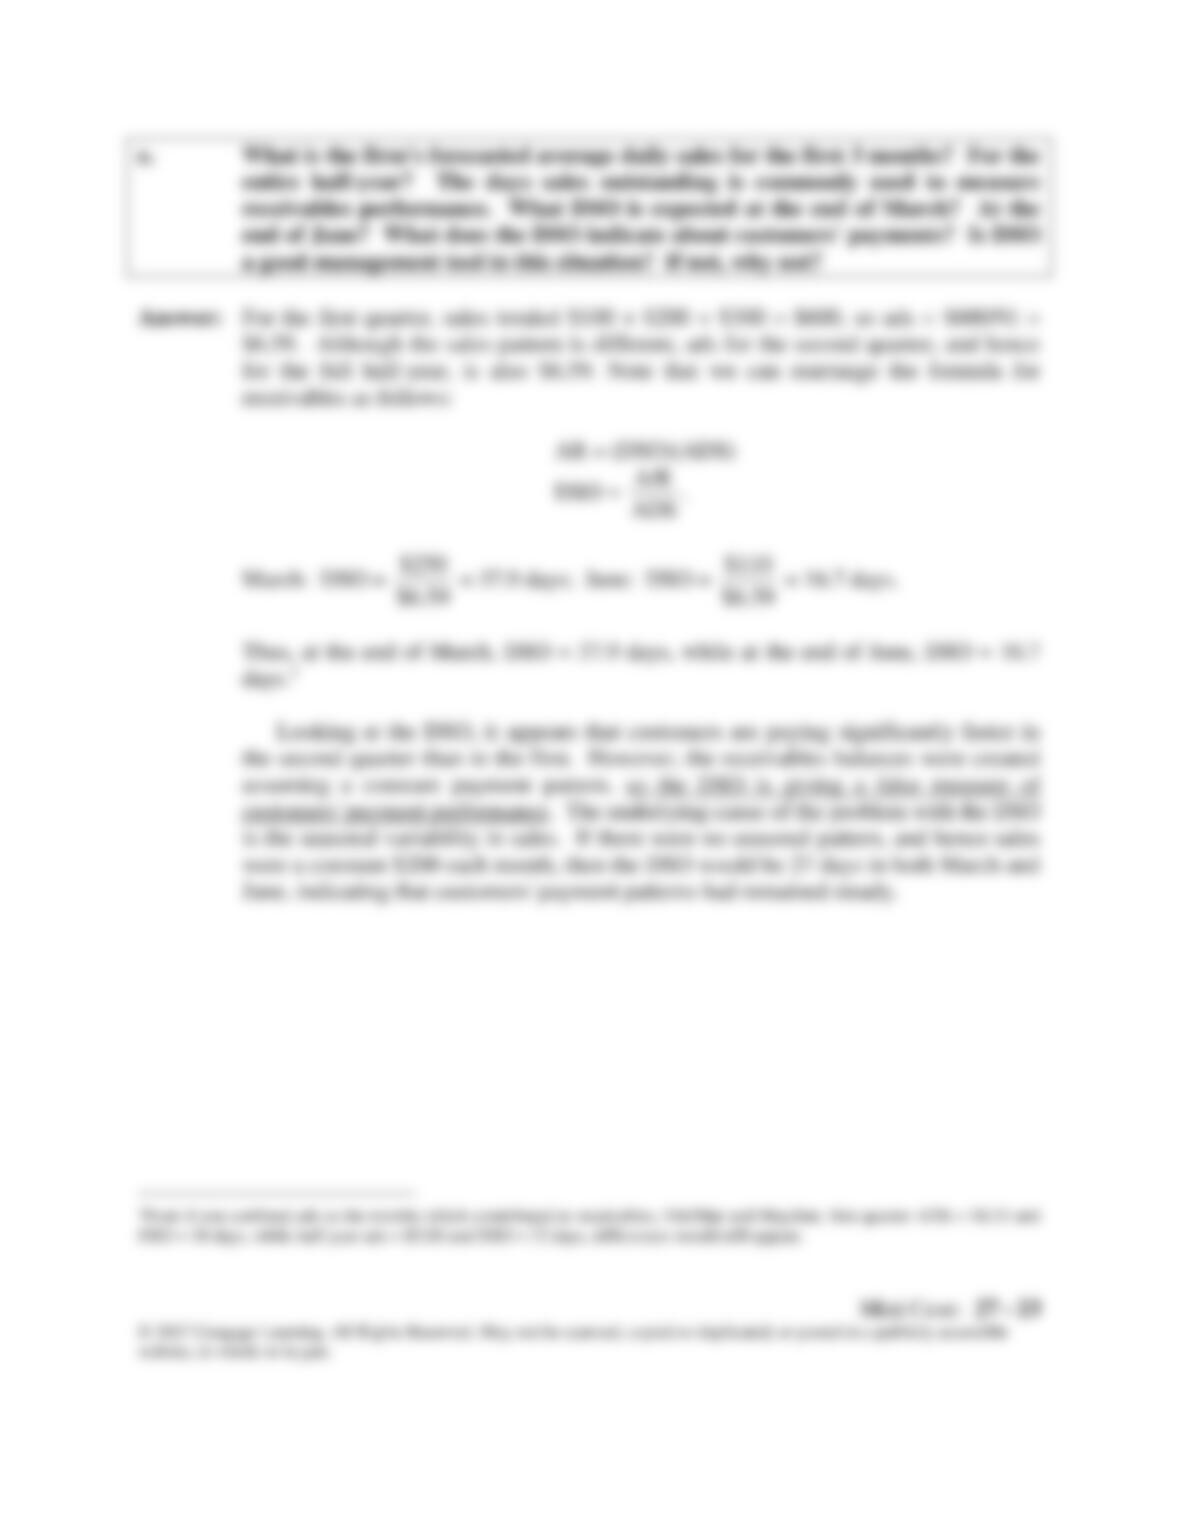
e. What is the firm’s forecasted average daily sales for the first 3 months? For the
entire half-year? The days sales outstanding is commonly used to measure
receivables performance. What DSO is expected at the end of March? At the
end of June? What does the DSO indicate about customers’ payments? Is DSO
a good management tool in this situation? If not, why not?
Answer: For the first quarter, sales totaled $100 + $200 + $300 = $600, so ads = $600/91 =
$6.59. Although the sales pattern is different, ads for the second quarter, and hence
for the full half-year, is also $6.59. Note that we can rearrange the formula for
receivables as follows:
AR = (DSO)(ADS)
DSO =
ADS
A/R
.
March: DSO =
59.6$
250$
= 37.9 days; June: DSO =
59.6$
110$
= 16.7 days.
assuming a constant payment pattern, so the DSO is giving a false measure of
customers’ payment performance. The underlying cause of the problem with the DSO
is the seasonal variability in sales. If there were no seasonal pattern, and hence sales
were a constant $200 each month, then the DSO would be 27 days in both March and
June, indicating that customers’ payment patterns had remained steady.
website, in whole or in part.
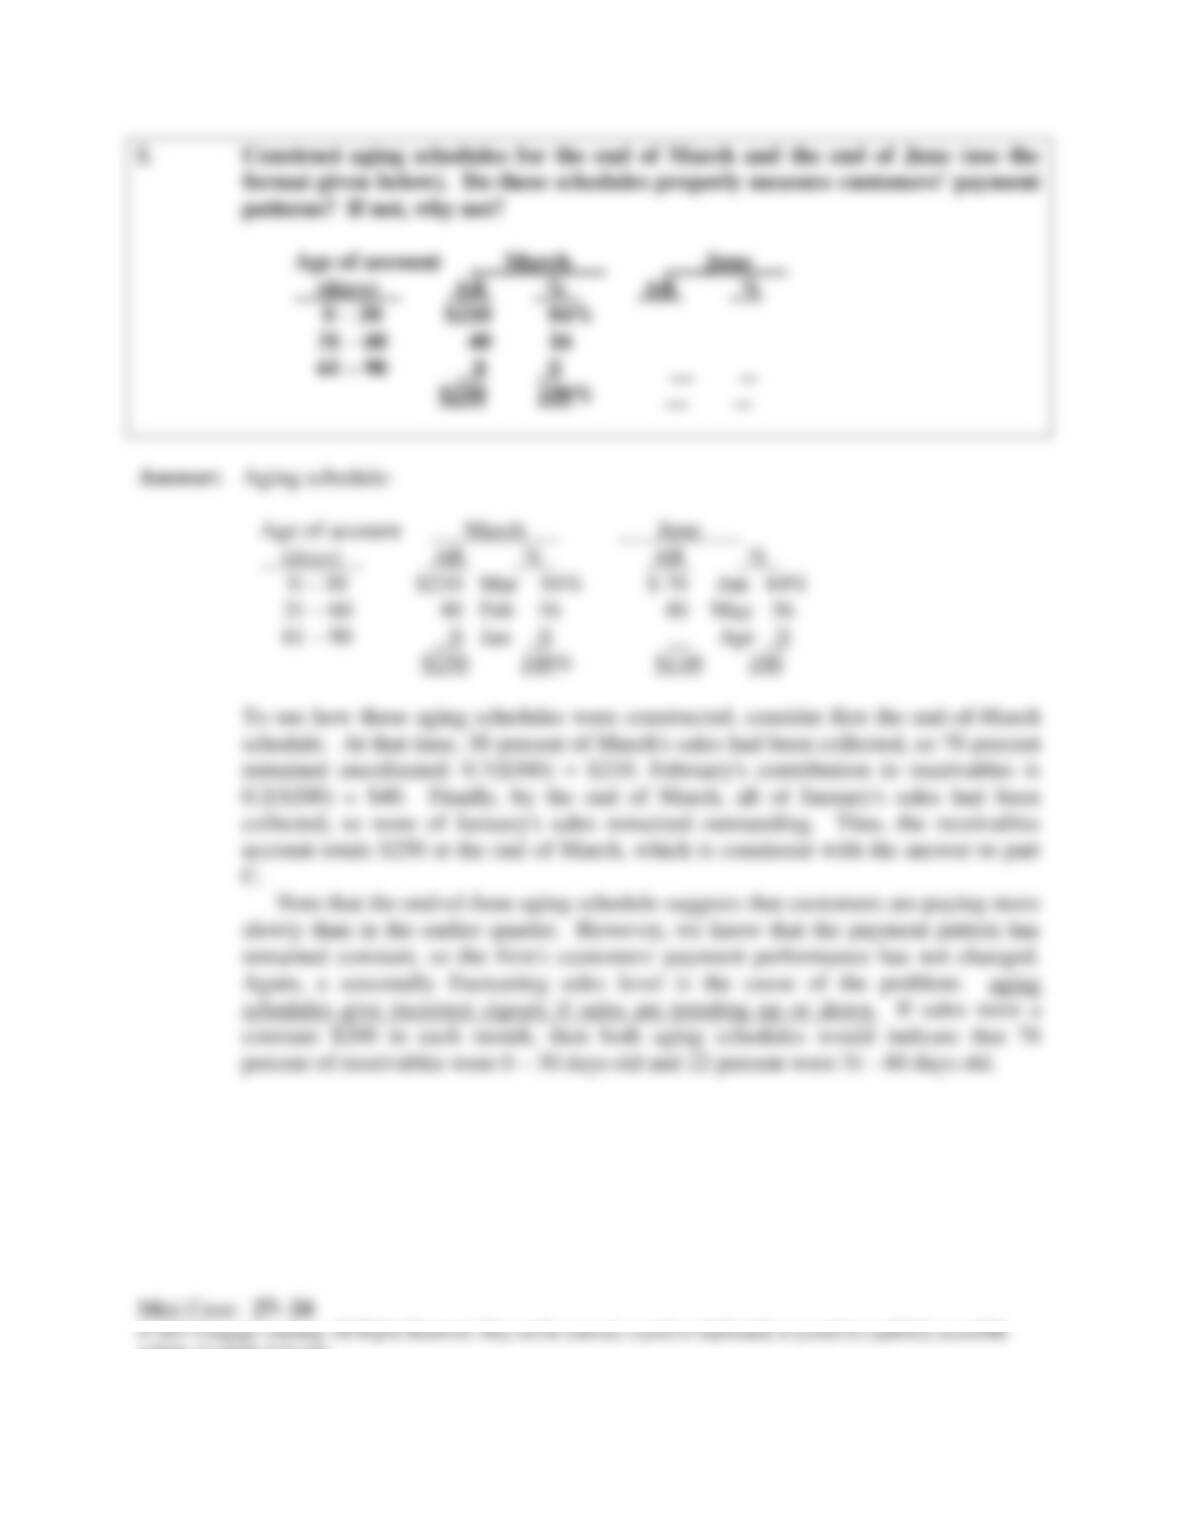
f. Construct aging schedules for the end of March and the end of June (use the
format given below). Do these schedules properly measure customers’ payment
61 – 90 0 0
$250 100%
Answer: Aging schedule:
To see how these aging schedules were constructed, consider first the end-of-March
schedule. At that time, 30 percent of March’s sales had been collected, so 70 percent
remained uncollected: 0.7($300) = $210. February’s contribution to receivables is
0.2($200) = $40. Finally, by the end of March, all of January’s sales had been
collected, so none of January’s sales remained outstanding. Thus, the receivables
constant $200 in each month, then both aging schedules would indicate that 78
percent of receivables were 0 – 30 days old and 22 percent were 31 – 60 days old.
Mini Case: 27 – 25
g. Construct the uncollected balances schedules for the end of March and the end
of June. Use the format given below. Do these schedules properly measure
customers’ payment patterns?
March
June
Month
Sales
Contribution
to AR
AR–to–
Sales Ratio
Month
Sales
Contribution
to A/R
AR–to–
Sales
Ratio
January
$100
$ 0
0%
April
February
200
40
20
May
March
300
210
70
June
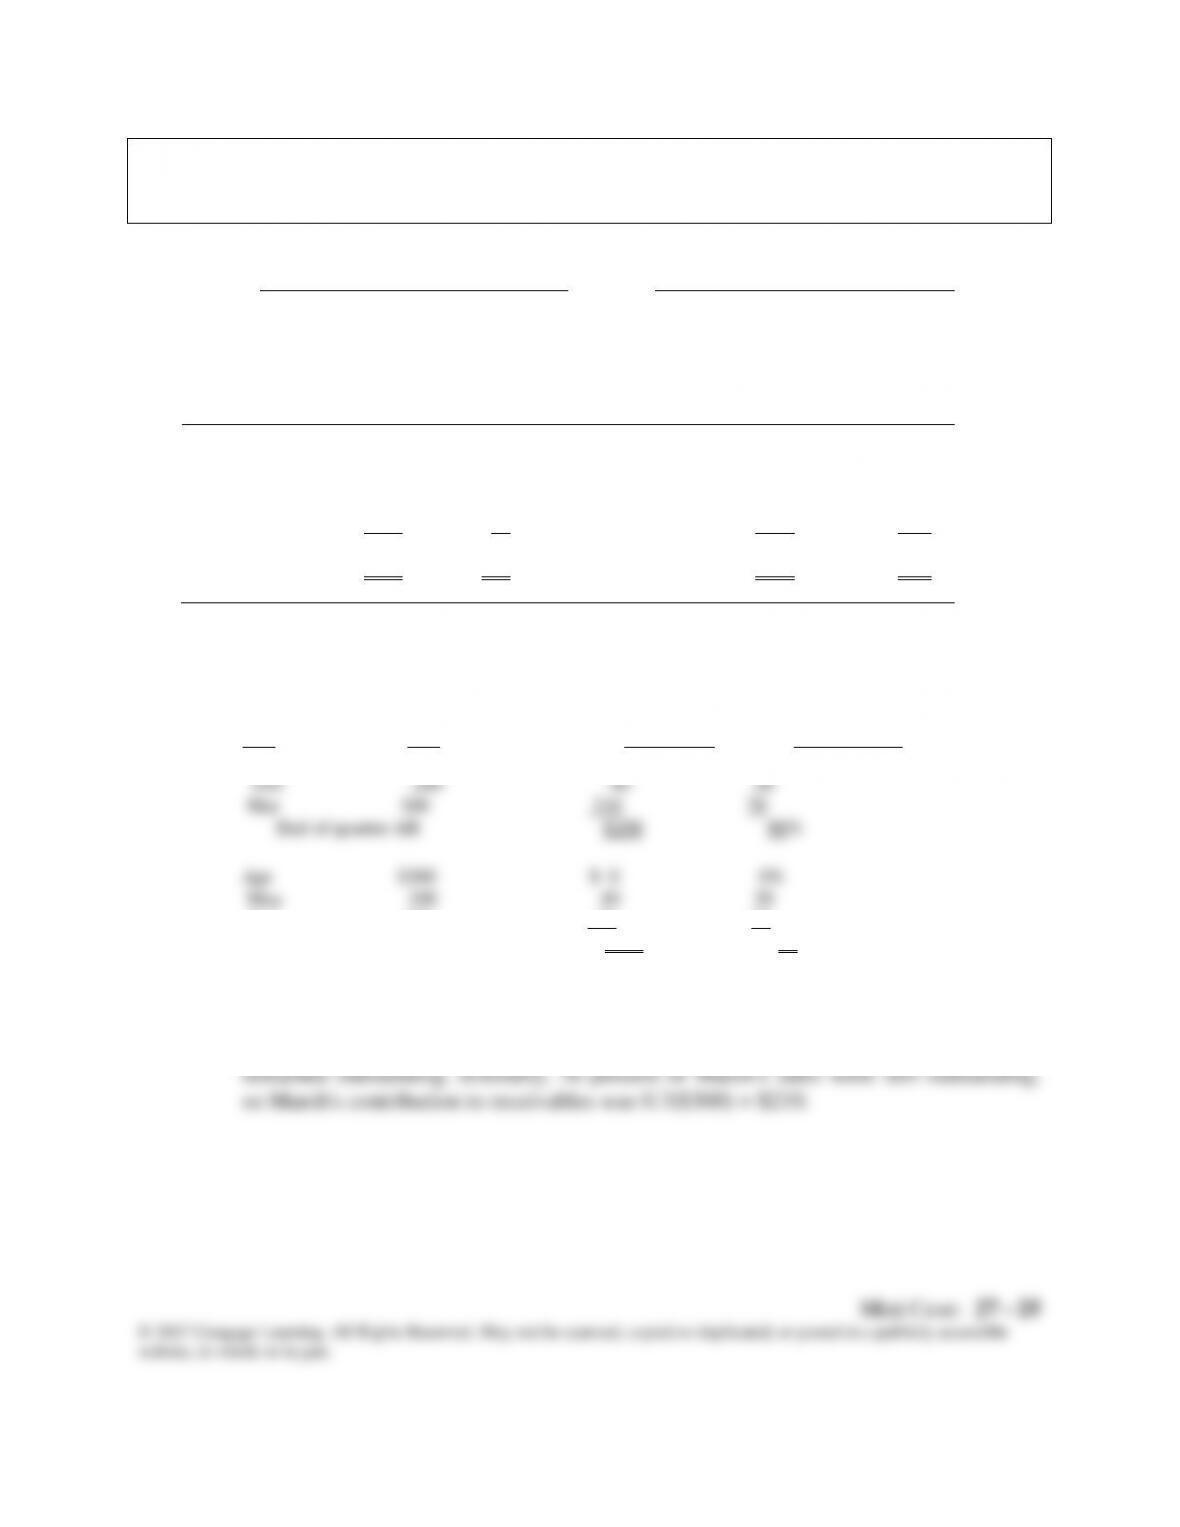
Answer: Uncollected balances schedules:
Contribution to Ratio of month’s
Month Sales end-of-period AR AR to month’s sales
(1) (2) (3) (4)
Jan $100 $ 0 0%
Jun 100 70 70
end of quarter AR $110 90%
In column 3 above, the contribution of each month’s sales to the firm’s receivables
balance is identified. To illustrate, at the end of March, all of January’s sales had
been collected, but only 80 percent of February’s sales had been collected, so $40
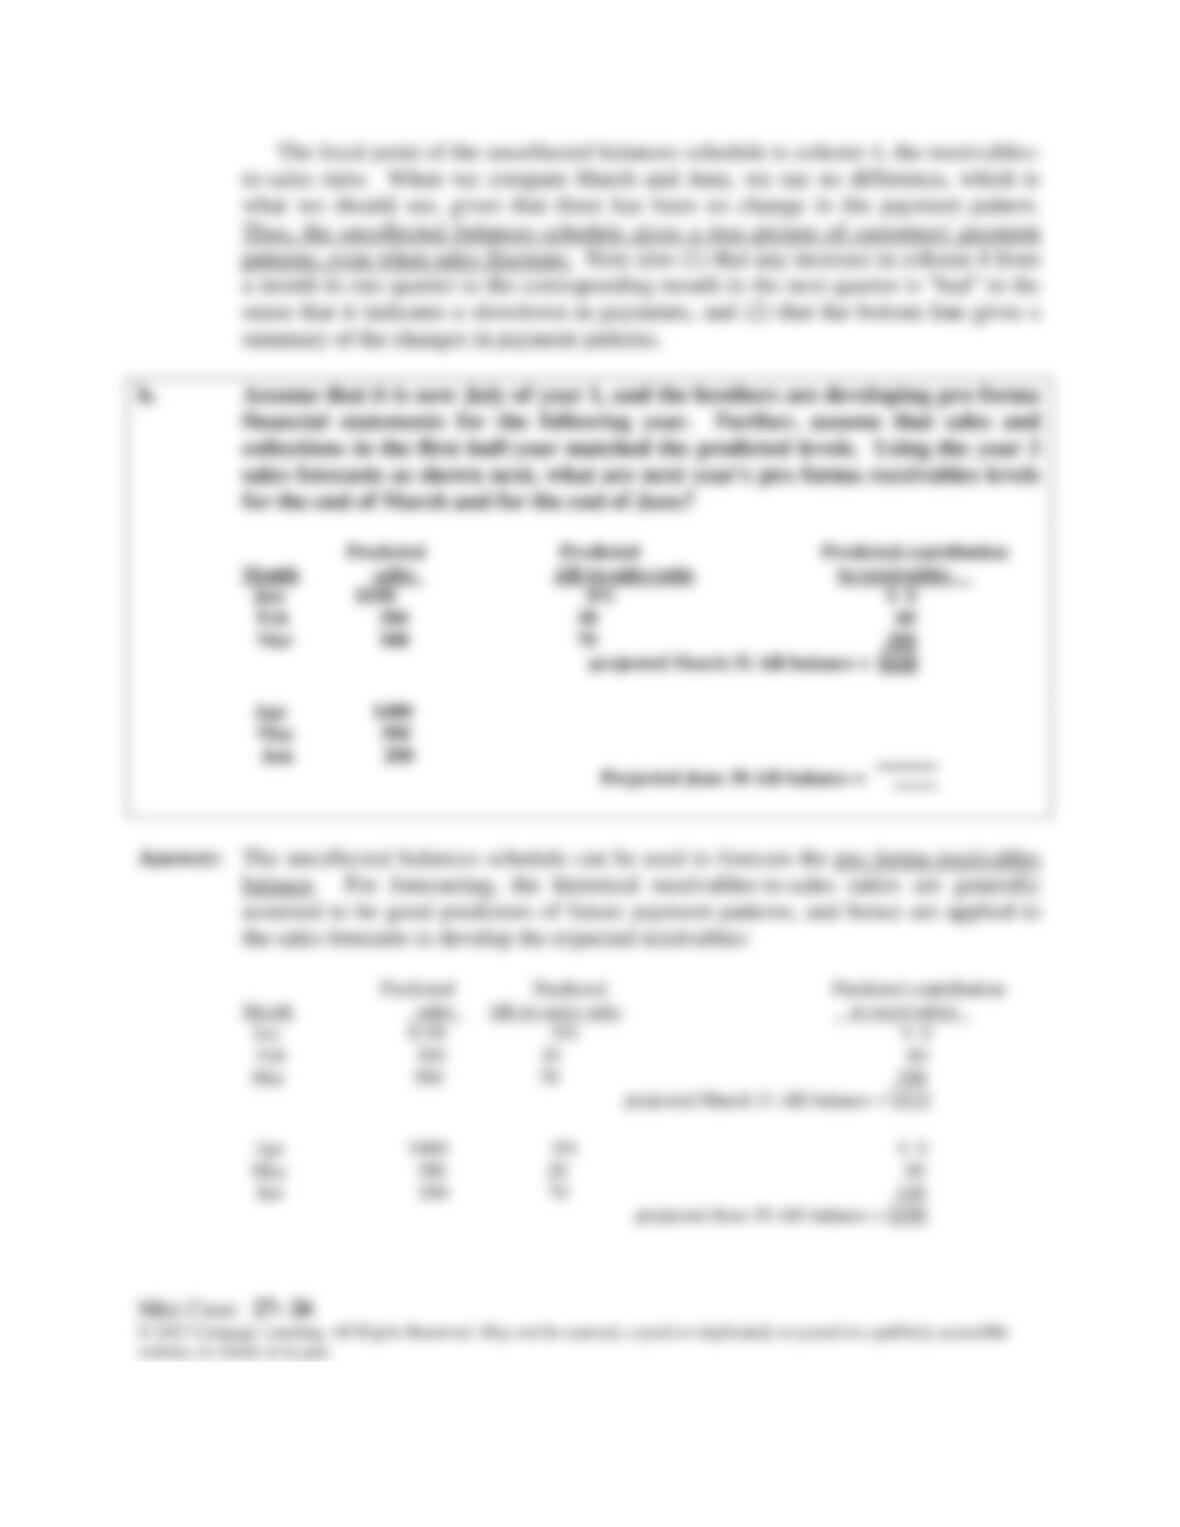
h. Assume that it is now July of year 1, and the brothers are developing pro forma
financial statements for the following year. Further, assume that sales and
collections in the first half-year matched the predicted levels. Using the year 2
sales forecasts as shown next, what are next year’s pro forma receivables levels
for the end of March and for the end of June?
Predicted Predicted Predicted contribution
Month sales AR–to-sales ratio to receivables
Jan $150 0% $ 0
Feb 300 20 60
Mar 500 70 350
projected March 31 AR balance = $410
Apr $400
May 300
Jun 200
Projected June 30 AR balance =
Predicted Predicted Predicted contribution
Month sales AR–to-sales ratio to receivables
Jan $150 0% $ 0
Feb 300 20 60
projected June 30 AR balance = $200

Mini Case: 27 – 27
© 2017 Cengage Learning. All Rights Reserved. May not be scanned, copied or duplicated, or posted to a publicly accessible
website, in whole or in part.
website, in whole or in part.
i. Assume now that it is several years later. The brothers are concerned about the
firm’s current credit terms, which are now net 30, which means that contractors
buying building products from the firm are not offered a discount, and they are
change would entail (1) changing the credit terms to 2/10, net 20, (2) employing
stricter credit standards before granting credit, and (3) enforcing collections
with greater vigor than in the past. Thus, cash customers and those paying
within 10 days would receive a 2 percent discount, but all others would have to
pay the full amount after only 20 days. The brothers believe that the discount
percent to pay the full amount on day 20; for 10 percent to pay late on day 30;
and for bad debt losses to fall from 2 percent to 1 percent of gross sales. The
firm’s operating cost ratio will remain unchanged at 75 percent, and its cost of
carrying receivables will remain unchanged at 12 percent.
To begin the analysis, describe the four variables that make up a firm’s
collection policy.
Cash discounts generally produce two benefits: (1) they attract both new
customers and expanded sales from current customers, because people view discounts
as a price reduction, and (2) discounts cause a reduction in the days sales outstanding,
since both new customers and some established customers will pay more promptly in