
g. Write out the equation for the capital market line (CML) and draw it on the
graph. Interpret the CML. Now add a set of indifference curves, and illustrate
how an investor’s optimal portfolio is some combination of the risky portfolio
and the risk-free asset. What is the composition of the risky portfolio?

Mini Case: 25 – 18
© 2017 Cengage Learning. All Rights Reserved. May not be scanned, copied or duplicated, or posted to a publicly accessible
website, in whole or in part.
The figure above shows a set of indifference curves (i1, i2, and i3), with i1 touching
the CML. This point of tangency defines the optimal portfolio for this investor, and
he or she will buy a combination of the market portfolio and the risk-free asset.
The risky portfolio, m, must contain every asset in exact proportion to that asset’s
fraction of the total market value of all assets; that is, if security g is x percent of the
total market value of all securities, x percent of the market portfolio must consist of
security g.
h. What is the capital asset pricing model (CAPM)? What are the assumptions
that underlie the model?
Answer: The Capital Asset Pricing Model (CAPM) is an equilibrium model which specifies
the relationship between risk and required rates of return on assets when they are held
in well-diversified portfolios. The CAPM requires an extensive set of assumptions:
All assets are perfectly divisible and perfectly marketable at the going price, and
there are no transactions costs.
There are no taxes.
Mini Case: 25 – 19
RPM = rM − rRF
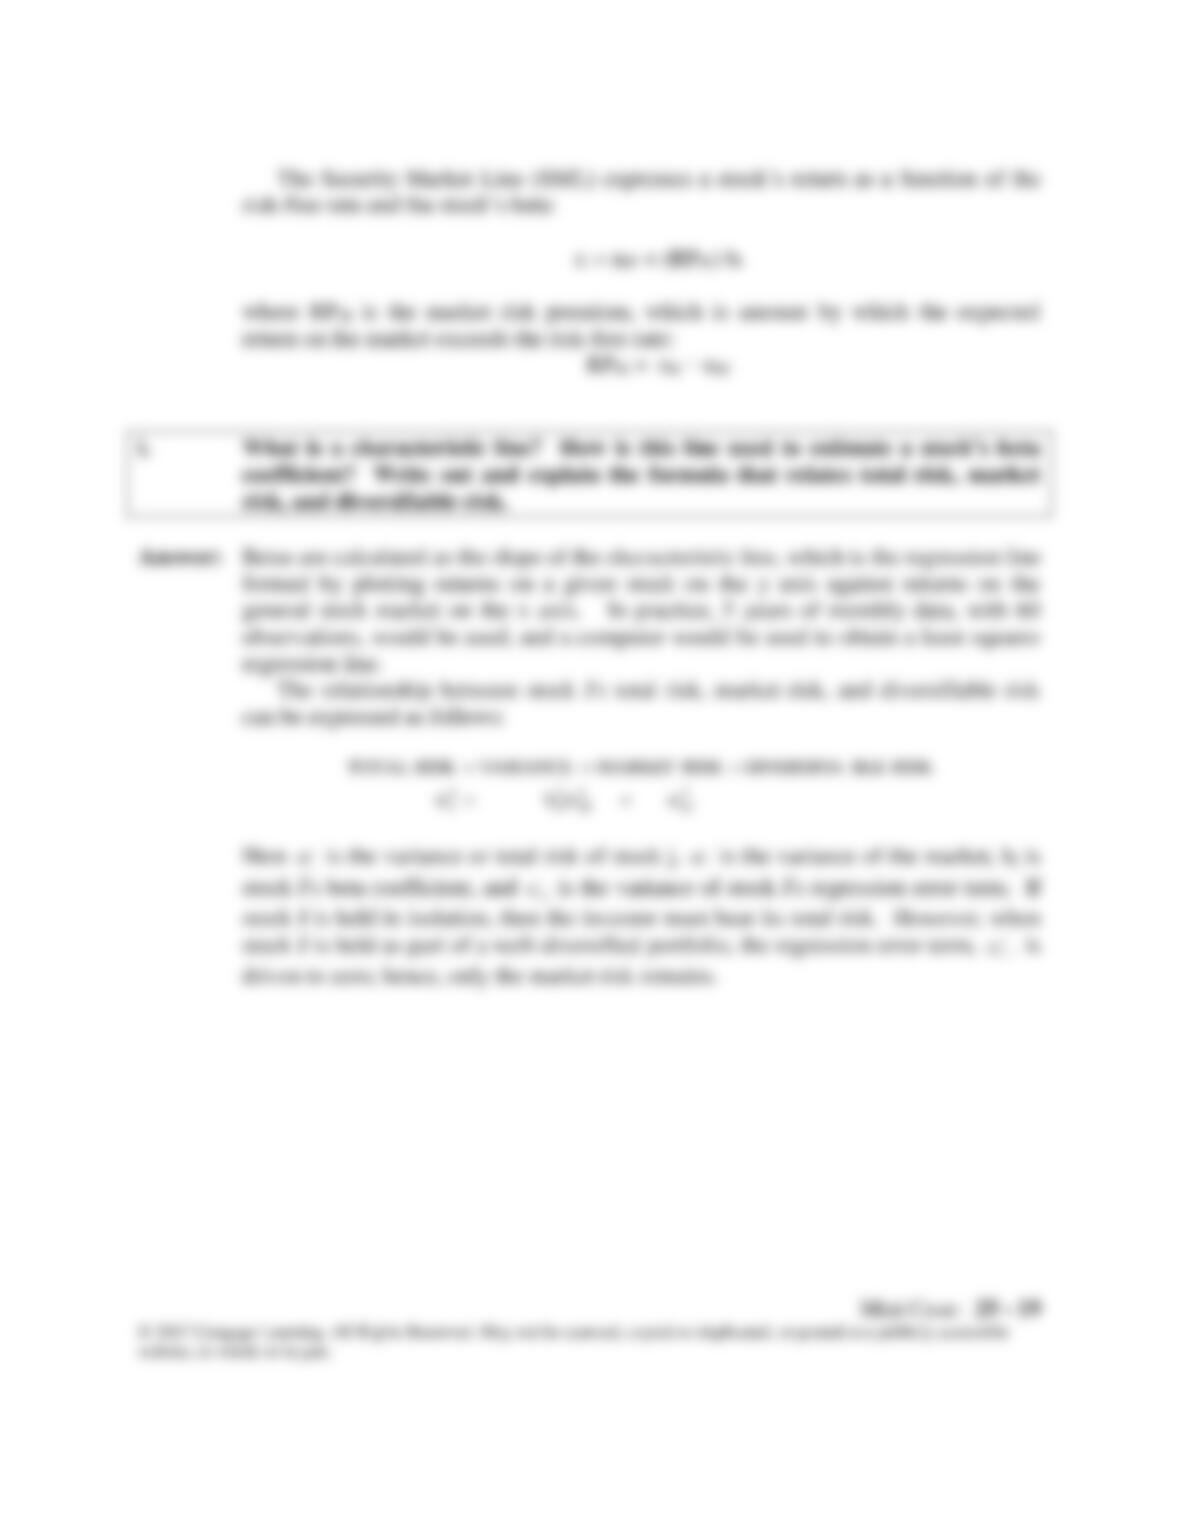
i. What is a characteristic line? How is this line used to estimate a stock’s beta
coefficient? Write out and explain the formula that relates total risk, market
risk, and diversifiable risk.
Answer: Betas are calculated as the slope of the characteristic line, which is the regression line
RISK BLEDIVERSIFIARISK MARKETVARIANCERISK TOTAL
2
stock J is held as part of a well-diversified portfolio, the regression error term,
2
eJ
is
j. What are two potential tests that can be conducted to verify the CAPM? What
are the results of such tests? What is roll’s critique of CAPM tests?
Answer: Since the CAPM was developed on the basis of a set of unrealistic assumptions,
estimators of future portfolio volatility.
The second type of test is based on the slope of the SML. As we have seen, the
CAPM states that a linear relationship exists between a security’s required rate of
return and its beta. Further, when the SML is graphed, the vertical axis intercept
should be rRF, and the required rate of return for a stock (or portfolio) with beta = 1.0
that attempt to assess the relative importance of market and company-specific risk do
not yield definitive results, so the irrelevance of diversifiable risk specified in the
CAPM model can be questioned.
Roll questioned whether it is even conceptually possible to test the CAPM. Roll
showed that the linear relationship which prior researchers had observed in graphs
resulted from the mathematical properties of the models being tested, hence that a
finding of linearity proved nothing about the validity of the CAPM. Roll’s work did
not disprove the CAPM theory, but he did show that it is virtually impossible to prove
that investors behave in accordance with the theory.
In general, evidence seems to support the CAPM model when it is applied to
portfolios, but the evidence is less convincing when the CAPM is applied to
individual stocks.

Mini Case: 25 – 21
k. Briefly explain the difference between the CAPM and the arbitrage pricing
theory (APT).
Answer: The CAPM is a single-factor model, while the Arbitrage Pricing Theory (APT) can
include any number of risk factors. It is likely that the required return is dependent
on many fundamental factors such as the GNP growth, expected inflation, and
changes in tax laws, and that different groups of stocks are affected differently by
these factors. Thus, the apt seems to have a stronger theoretical footing than does the
CAPM. However, the apt faces several major hurdles in implementation, the most