Unlock document.
This document is partially blurred.
Unlock all pages and 1 million more documents.
Get Access

Mini Case: 25 - 11
MINI CASE
You have been hired at the investment firm of Bowers & Noon. One of its clients doesn’t
understand the value of diversification or why stocks with the biggest standard deviations
don’t always have the highest expected returns. Your assignment is to address the client’s
concerns by showing the client how to answer the following questions.
a. Suppose asset A has an expected return of 10 percent and a standard deviation
of 20 percent. Asset B has an expected return of 16 percent and a standard
deviation of 40 percent. If the correlation between A and B is 0.35, what are the
expected return and standard deviation for a portfolio comprised of 30 percent
asset A and 70 percent asset B?
Answer:
%.2.14142.0
)16.0(7.0)1.0(3.0
r
ˆ
)w1(r
ˆ
wr
ˆBAAAP
306.0
)4.0)(2.0)(35.0)(7.0)(3.0(2)4.0(7.0)2.0(3.0
)W1(W2)W1(W
2222
BAAB
AA
2
B
2
A
2
A
2
Ap
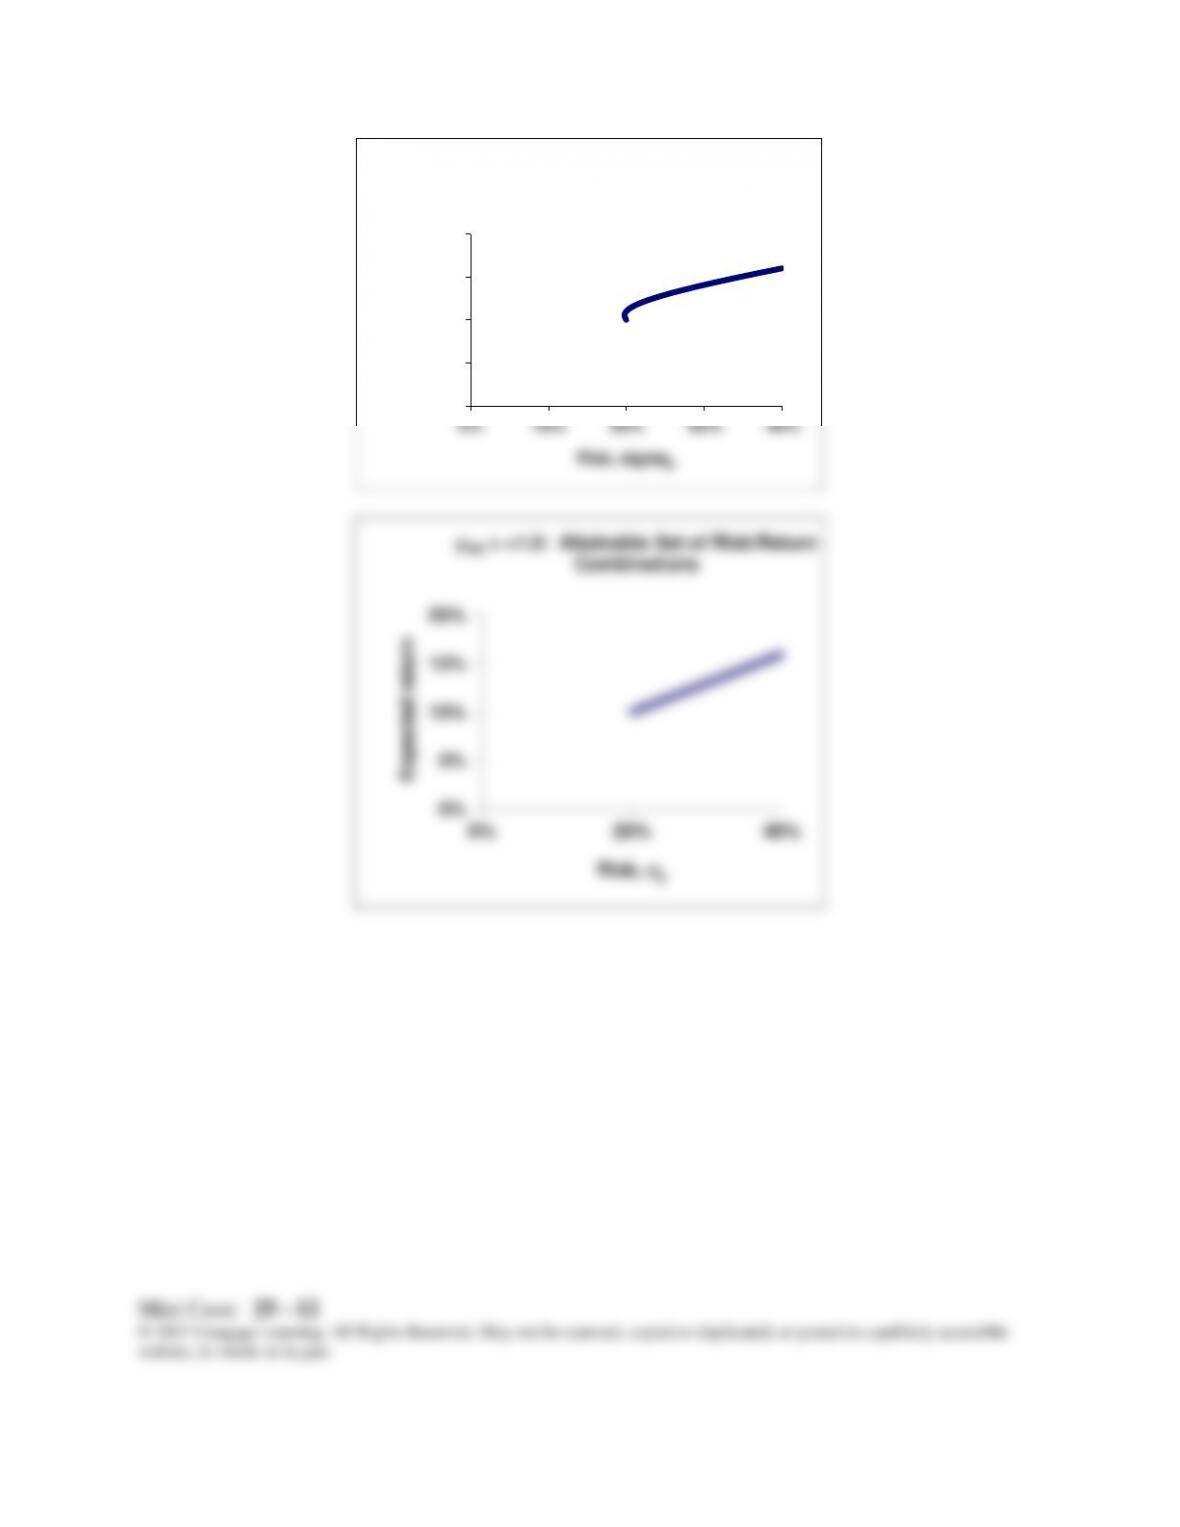
b. Plot the attainable portfolios for a correlation of 0.35. Now plot the attainable
portfolios for correlations of +1.0 and -1.0.
Answer:
Mini Case: 25 - 12
website, in whole or in part.
0%
5%
10%
15%
20%
0% 10% 20% 30% 40%
Expected return
Risk, sigmap
pAB = +0.35: Attainable Set of
Risk/Return Combinations
0%
5%
10%
15%
20%
0% 20% 40%
Expected return
Risk, p
AB = +1.0: Attainable Set of Risk/Return
Combinations
website, in whole or in part.
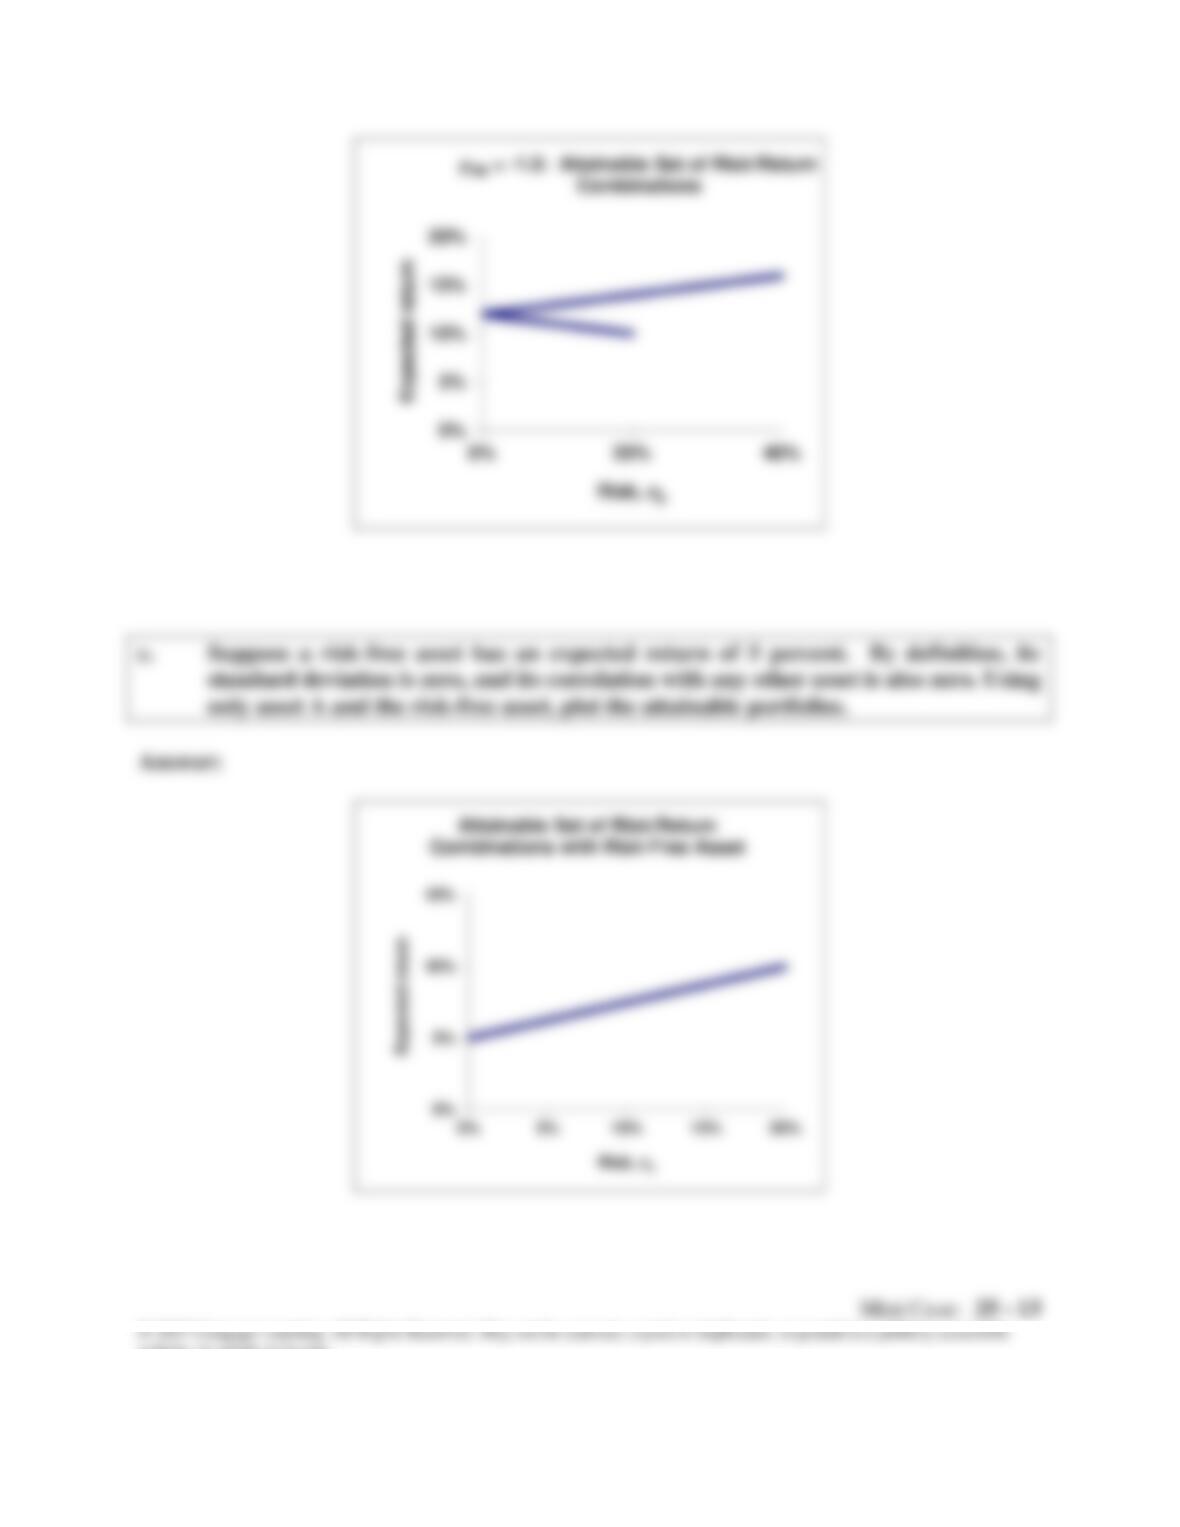
c. Suppose a risk-free asset has an expected return of 5 percent. By definition, its
standard deviation is zero, and its correlation with any other asset is also zero. Using
only asset A and the risk-free asset, plot the attainable portfolios.
Answer:
0%
5%
10%
15%
20%
0% 20% 40%
Expected return
Risk, p
AB = -1.0: Attainable Set of Risk/Return
Combinations
0%
5%
10%
15%
0% 5% 10% 15% 20%
Expected return
Risk, p
Attainable Set of Risk/Return
Combinations with Risk-Free Asset

d. Construct a reasonable, but hypothetical, graph which shows risk, as measured
by portfolio standard deviation, on the x axis and expected rate of return on the
y axis. Now add an illustrative feasible (or attainable) set of portfolios, and show
what portion of the feasible set is efficient. What makes a particular portfolio
efficient? Don't worry about specific values when constructing the graph—
merely illustrate how things look with "reasonable" data.
Answer:
The figure above shows the feasible set of portfolios. The points B, C, D, and E
portfolios) are inefficient because some other portfolio would provide either a higher
return with the same degree of risk or a lower level of risk for the same rate of return.
Expected Portfolio
Risk,
p
A
B
C
D
E
Return, kp
Efficient Set
Feasible, or
Attainable, Set
(A,B)
^
Expected Portfolio
Return
^
rP
risk, P
Mini Case: 25 - 15
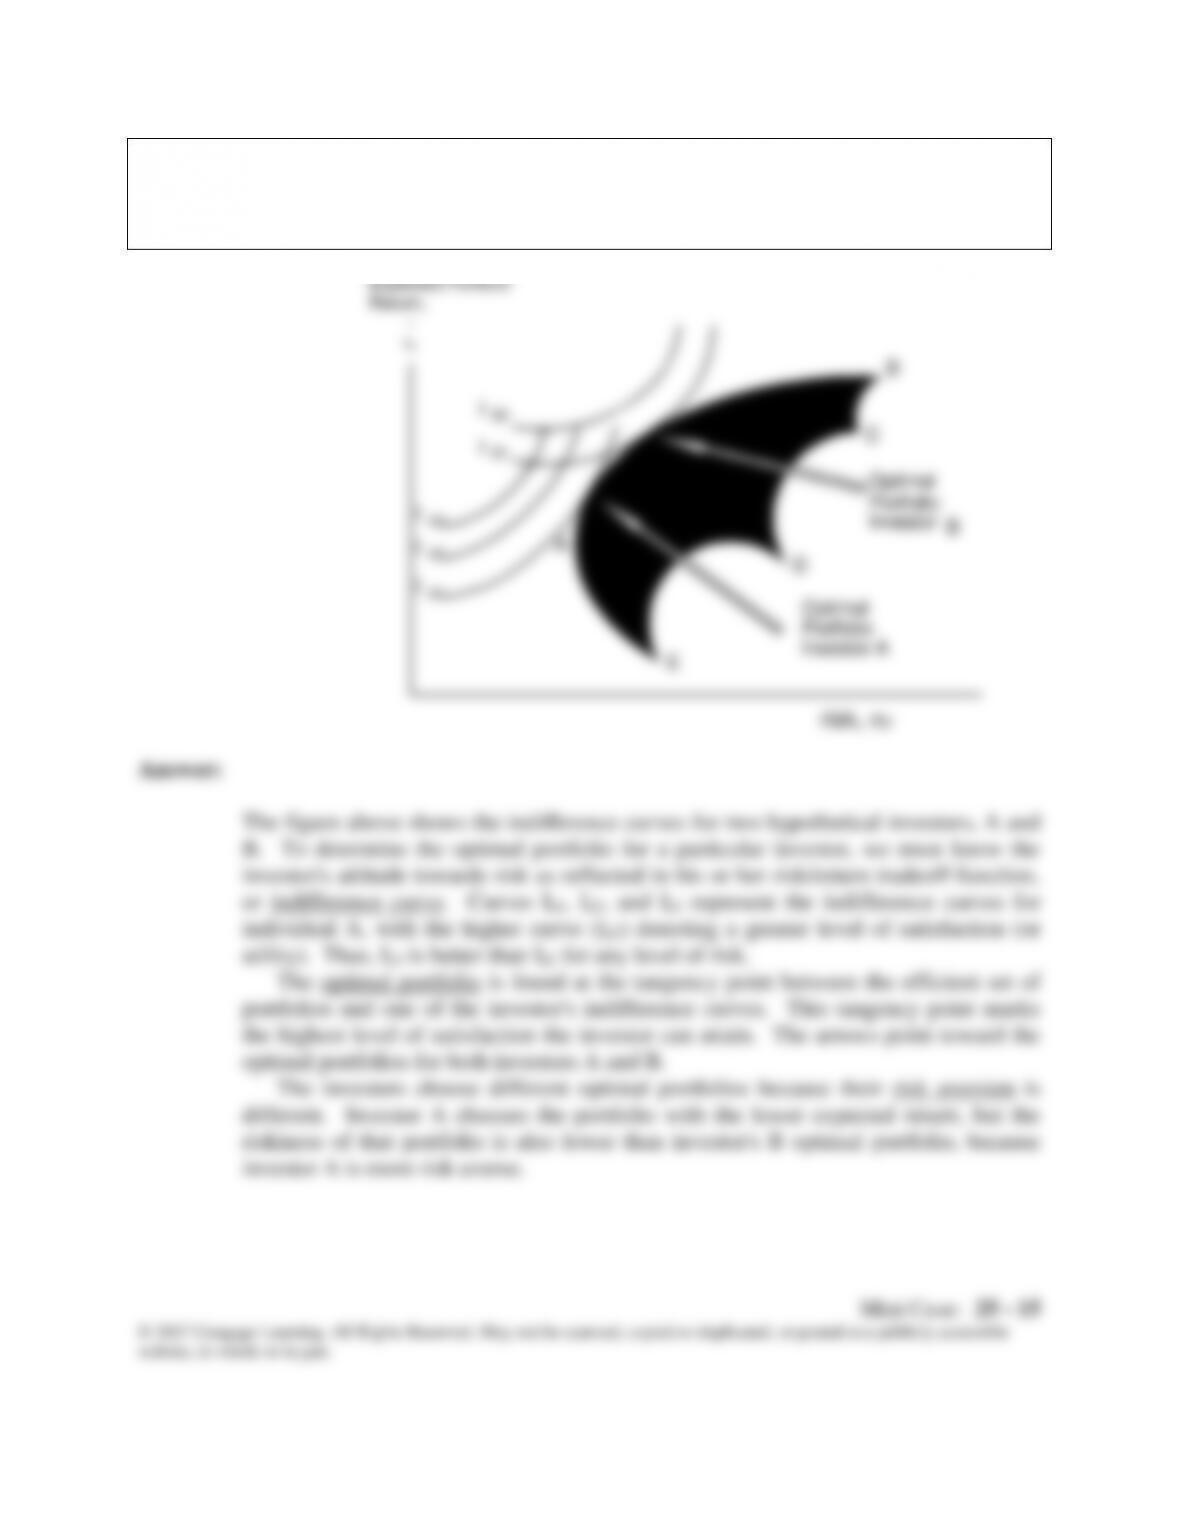
e. Now add a set of indifference curves to the graph created for part B. What do
these curves represent? What is the optimal portfolio for this investor? Finally,
add a second set of indifference curves which leads to the selection of a different
optimal portfolio. Why do the two investors choose different portfolios?
Answer:
The figure above shows the indifference curves for two hypothetical investors, A and
B. To determine the optimal portfolio for a particular investor, we must know the
investor's attitude towards risk as reflected in his or her risk/return tradeoff function,
optimal portfolios for both investors A and B.
The investors choose different optimal portfolios because their risk aversion is
different. Investor A chooses the portfolio with the lower expected return, but the
riskiness of that portfolio is also lower than investor's B optimal portfolio, because
investor A is more risk averse.
Expected Portfolio
Risk,
p
A
B
C
D
E
IA3
IA2
IA1
IB2
IB1
Optimal
Portfolio
Investor B
Optimal
Portfolio
Investor A
Return, kp
^
Expected Portfolio
Return,
^
rp
risk, P
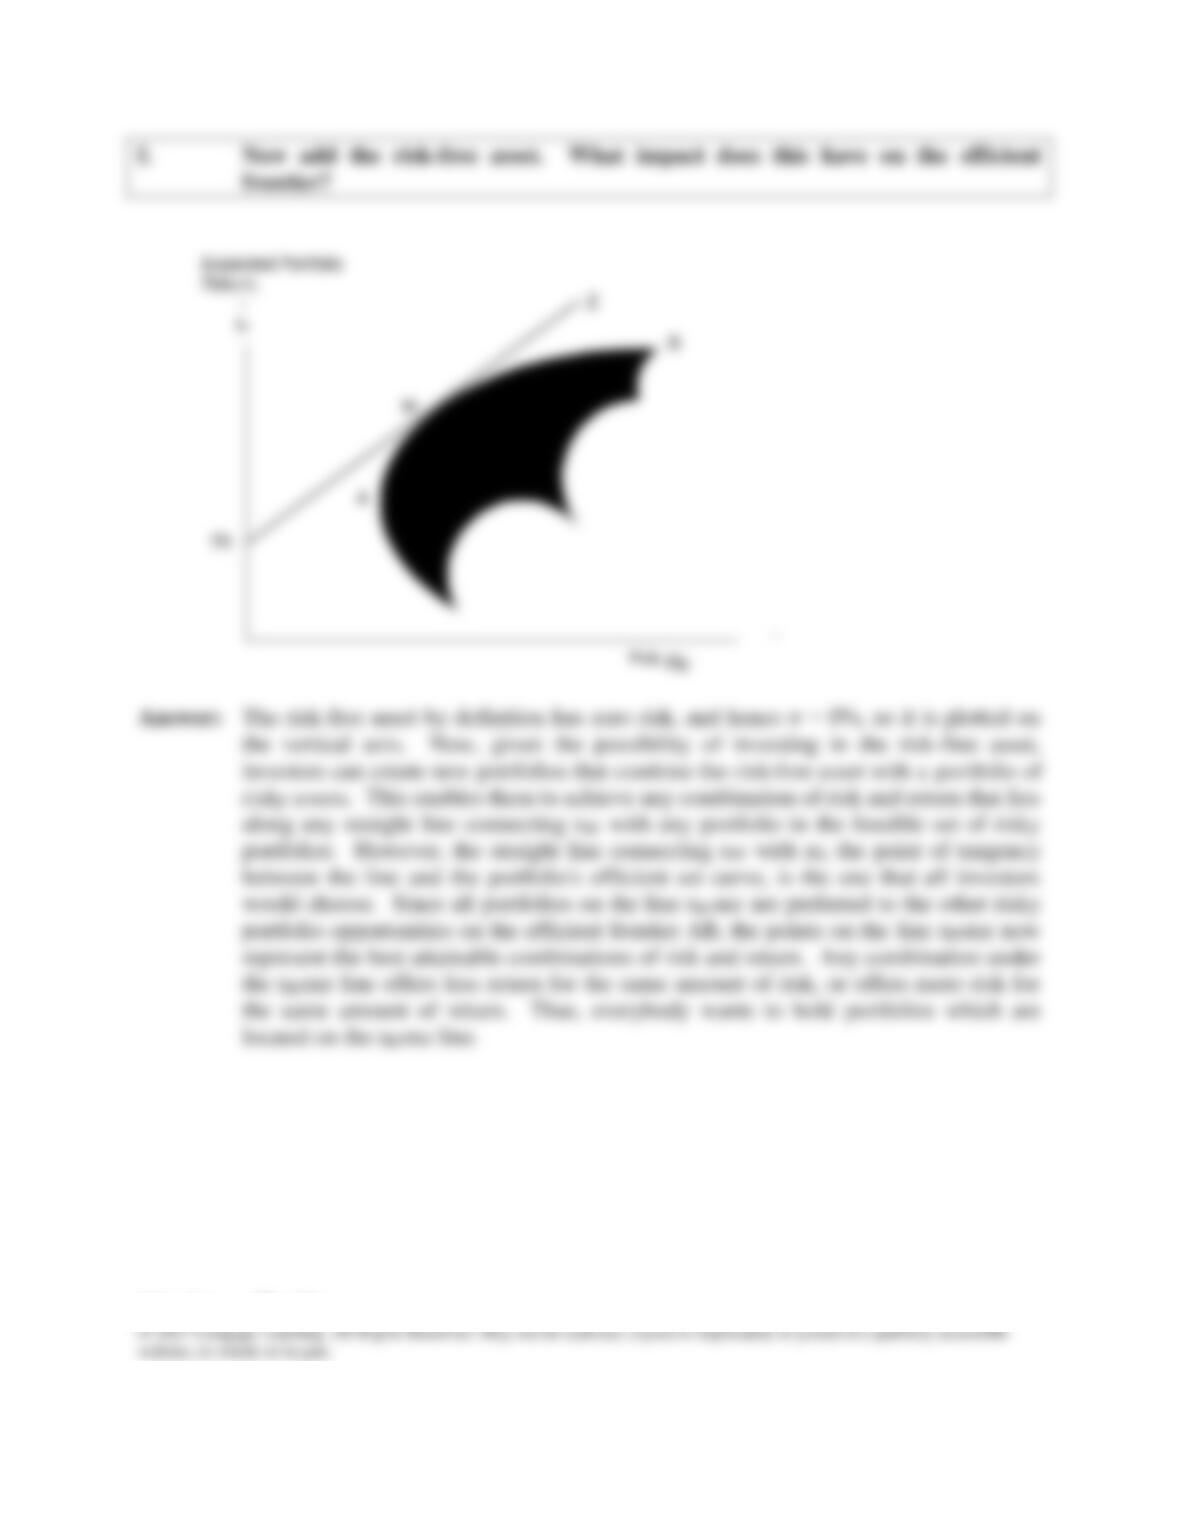
f. Now add the risk-free asset. What impact does this have on the efficient
along any straight line connecting rRF with any portfolio in the feasible set of risky
portfolios. However, the straight line connecting rRF with m, the point of tangency
between the line and the portfolio's efficient set curve, is the one that all investors
would choose. Since all portfolios on the line rRFmz are preferred to the other risky
portfolio opportunities on the efficient frontier AB, the points on the line rRFmz now


