
Answers and Solutions: 25 – 1
website, in whole or in part.
Chapter 25
Portfolio Theory and Asset Pricing Models
25-1 a. A portfolio is made up of a group of individual assets held in combination. An asset
that would be relatively risky if held in isolation may have little, or even no risk if
held in a well-diversified portfolio.
The feasible, or attainable, set represents all portfolios that can be constructed from a
potential portfolios.
b. An indifference curve is the risk/return trade-off function for a particular investor and
reflects that investor’s attitude toward risk. The indifference curve specifies an
investor’s required rate of return for a given level of risk. The greater the slope of the

Answers and Solutions: 25 – 2
© 2017 Cengage Learning. All Rights Reserved. May not be scanned, copied or duplicated, or posted to a publicly accessible
website, in whole or in part.
c. The Capital Asset Pricing Model (CAPM) is a general equilibrium market model
developed to analyze the relationship between risk and required rates of return on
assets when they are held in well-diversified portfolios. The SML is part of the
CAPM.
The Capital Market Line (CML) specifies the efficient set of portfolios an investor
can attain by combining a risk-free asset and the risky market portfolio M. The CML
states that the expected return on any efficient portfolio is equal to the riskless rate
plus a risk premium, and thus describes a linear relationship between expected return
and risk.
The beta coefficient (b) is a measure of a stock’s market risk. It measures the stock‘s
volatility relative to an average stock, which has a beta of 1.0.
e. Arbitrage Pricing Theory (APT) is an approach to measuring the equilibrium
risk/return relationship for a given stock as a function of multiple factors, rather than
25-2 Security A is less risky if held in a diversified portfolio because of its lower beta and
negative correlation with other stocks. In a single-asset portfolio, Security A would be
more risky because σA > σB and CVA > CVB.

Answers and Solutions: 25 – 3
SOLUTIONS TO END-OF-CHAPTER PROBLEMS
25-2 ri = rRF + (r1 rRF)bi1 + (r2 rRF)bij
p = w2A2A + (1wA)22B + 2wA (1wA)ABAB
= (0.32)(0.42) + (0.72)(0.62) + 2(0.3)(0.7)(0.2)(0.4)(0.6)
25-4 a.
.)rr(rb)rr(rr
M
iiM
RFMRFiRFMRFi
b. CML:
.
rr
rr p
M
RF
M
RF
p
SML:
.r
rr
rr iiM
M
RFM
RFi
With some arranging, the similarities between the CML and SML are obvious. When
in this form, both have the same market price of risk, or slope, (rM – rRF)/σM.
The measure of risk in the CML is σp. Since the CML applies only to efficient
portfolios, σp not only represents the portfolio’s total risk, but also its market risk.
However, the SML applies to all portfolios and individual securities. Thus, the
appropriate risk measure is not σi, the total risk, but the market risk, which in this
website, in whole or in part.
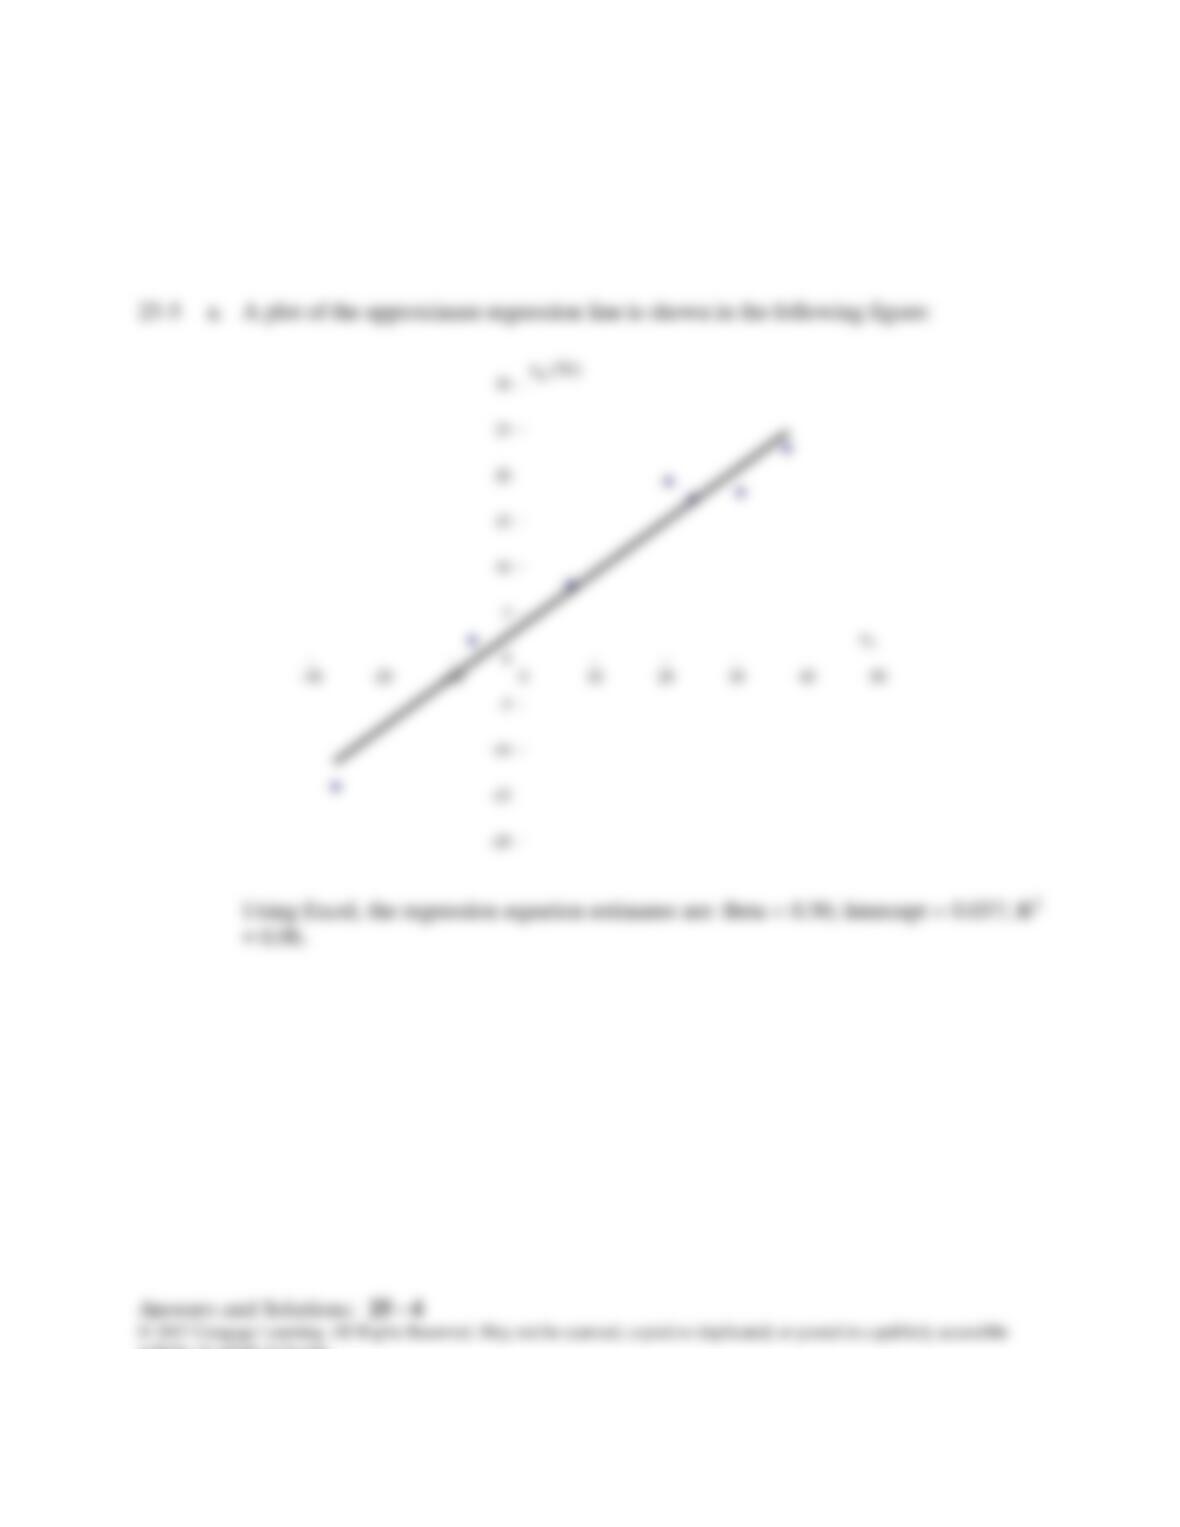
25-5 a. A plot of the approximate regression line is shown in the following figure:
-20
-15
-10
-5
0
5
10
15
20
25
30
-30 -20 -10 0 10 20 30 40 50
r
X
(%)
rY

Answers and Solutions: 25 – 5
b. The arithmetic average return for Stock X is calculated as follows:
%.6.10
7
)2.18…0.230.14(
rAvg
The arithmetic average rate of return on the market portfolio, determined similarly, is
12.1%.
For Stock X, the estimated standard deviation is 13.1 percent:
%.1.13
17
)6.102.18(…)6.100.23()6.100.14(222
X
The standard deviation of returns for the market portfolio is similarly determined to
be 22.6 percent. The results are summarized below:
Avg
Standard deviation, σ 13.1 22.6
Several points should be noted: (1) σM over this particular period is higher than the
historic average σM of about 15 percent, indicating that the stock market was
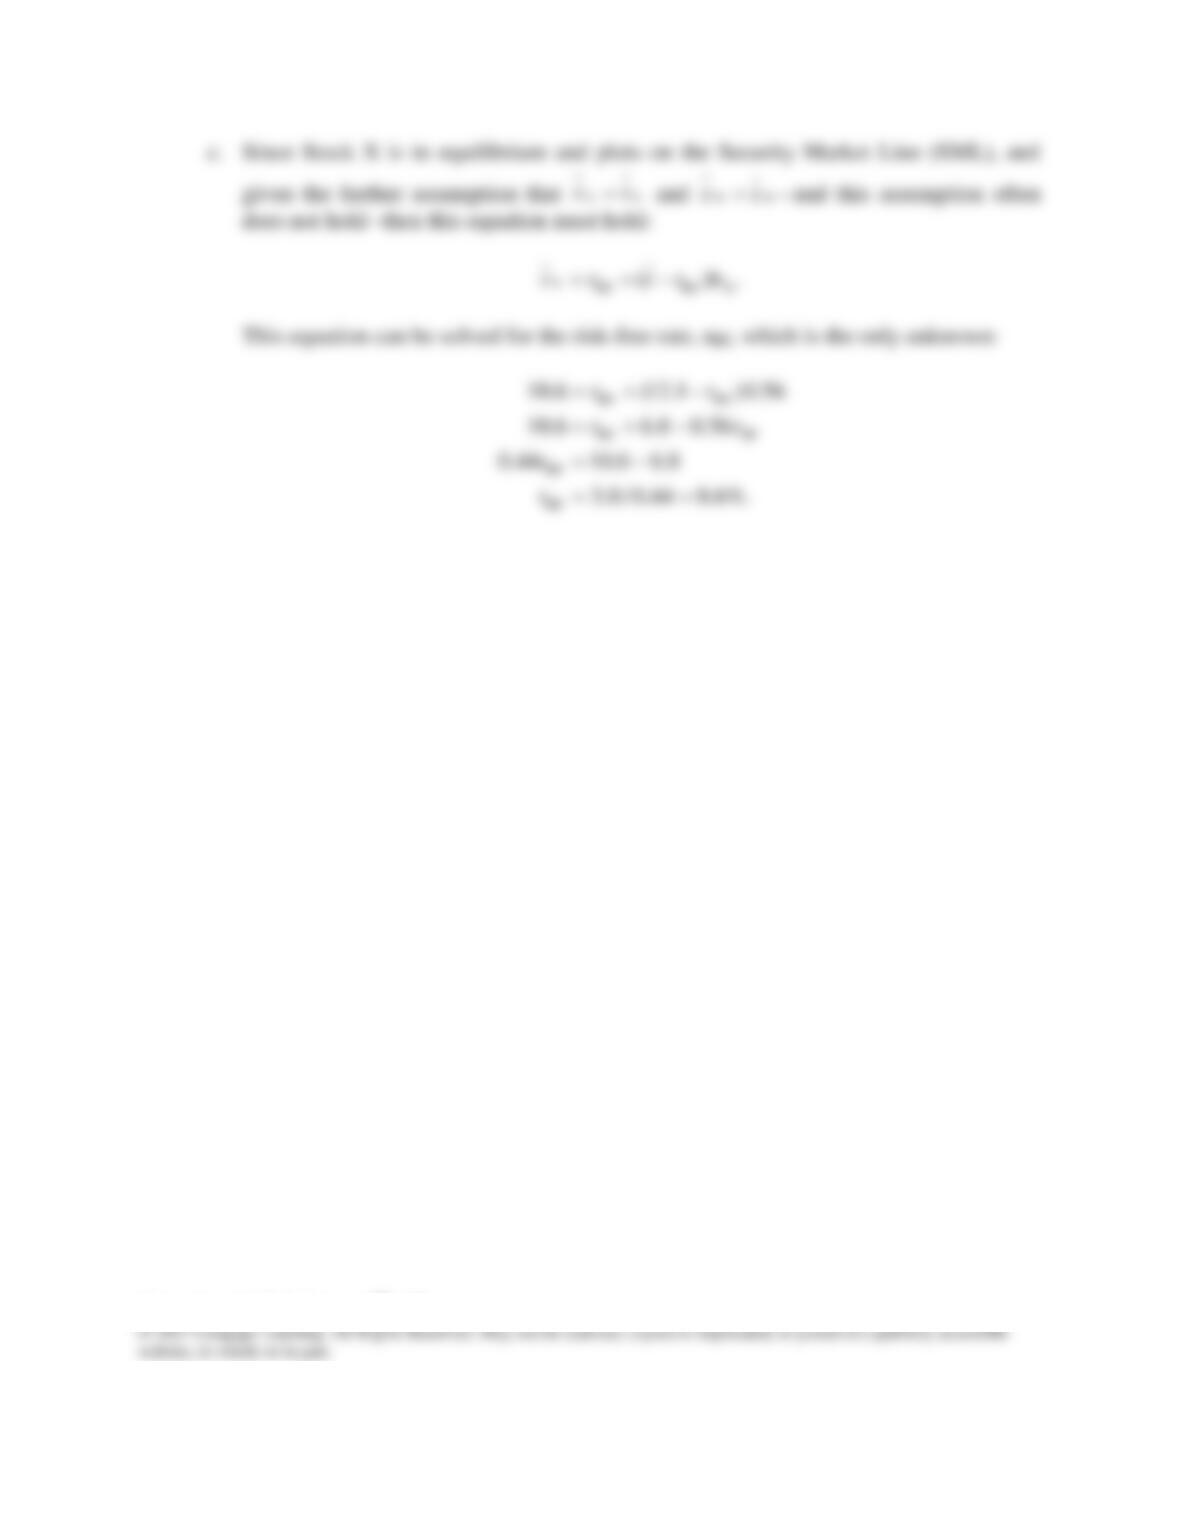
d. The SML is plotted below. Data on the risk-free security (bRF = 0,
rRF = 8.6%) and Security X (bX = 0.56,
X
r
= 10.6%) provide the two points through
which the SML can be drawn. rM provides a third point.
Y would have a slightly higher required return, but this premium for diversifiable risk
would be small.
Beta
k(%)
20
10
1.0 2.0
= 8.6
kX= 10.6%
kM= 12.1%
kRF
r(%)
rX = 10.6%
rRF = 8.6%
25-6
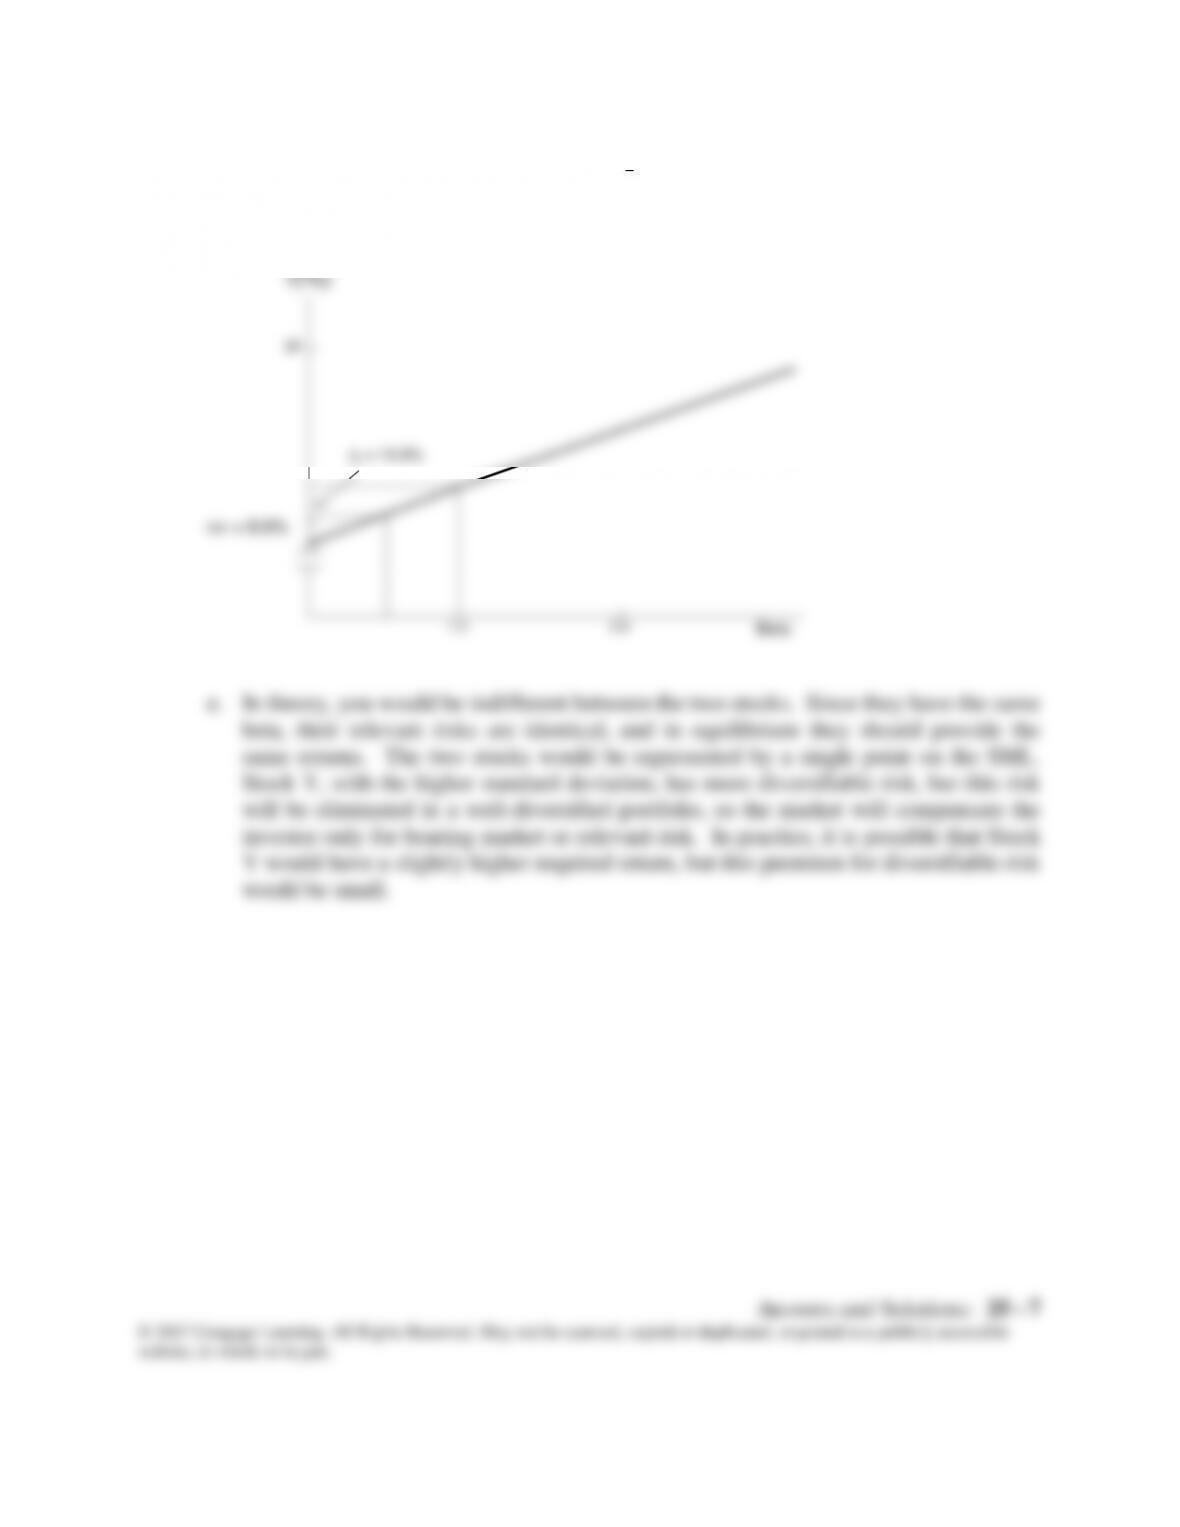
a. The regression graph is shown below. Using a spreadsheet, we find b = 0.62.

website, in whole or in part.
d. 1. The stock’s variance would not change, but the risk of the stock to an investor
holding a diversified portfolio would be greatly reduced.
2. It would now have a negative correlation with rM.
3. Because of a relative scarcity of such stocks and the beneficial net effect on

website, in whole or in part.
SOLUTION TO SPREADSHEET PROBLEM
25-7 The detailed solution for the spreadsheet problem is available in the file Ch25 P07 Build