1
2
3
4
5
6
7
8
9
10
11
12
13
19
20
21
22
23
1. The weighted average cost of capital is independent of the firm’s capital structure.
2. The WACC of a firm with debt is equal to the unlevered cost of equity.
42
43
44
45
51
52
53
54
55
56
A B C D E F G H I
10/28/2015
Situation
Proposition I.
rsL = rsU + (rsU-rd)x (D/S)
WACC =
wd*rd + wce*rs = (D/V)*rd + (S/V)*rs
WACC = 2.24% + 11.8%
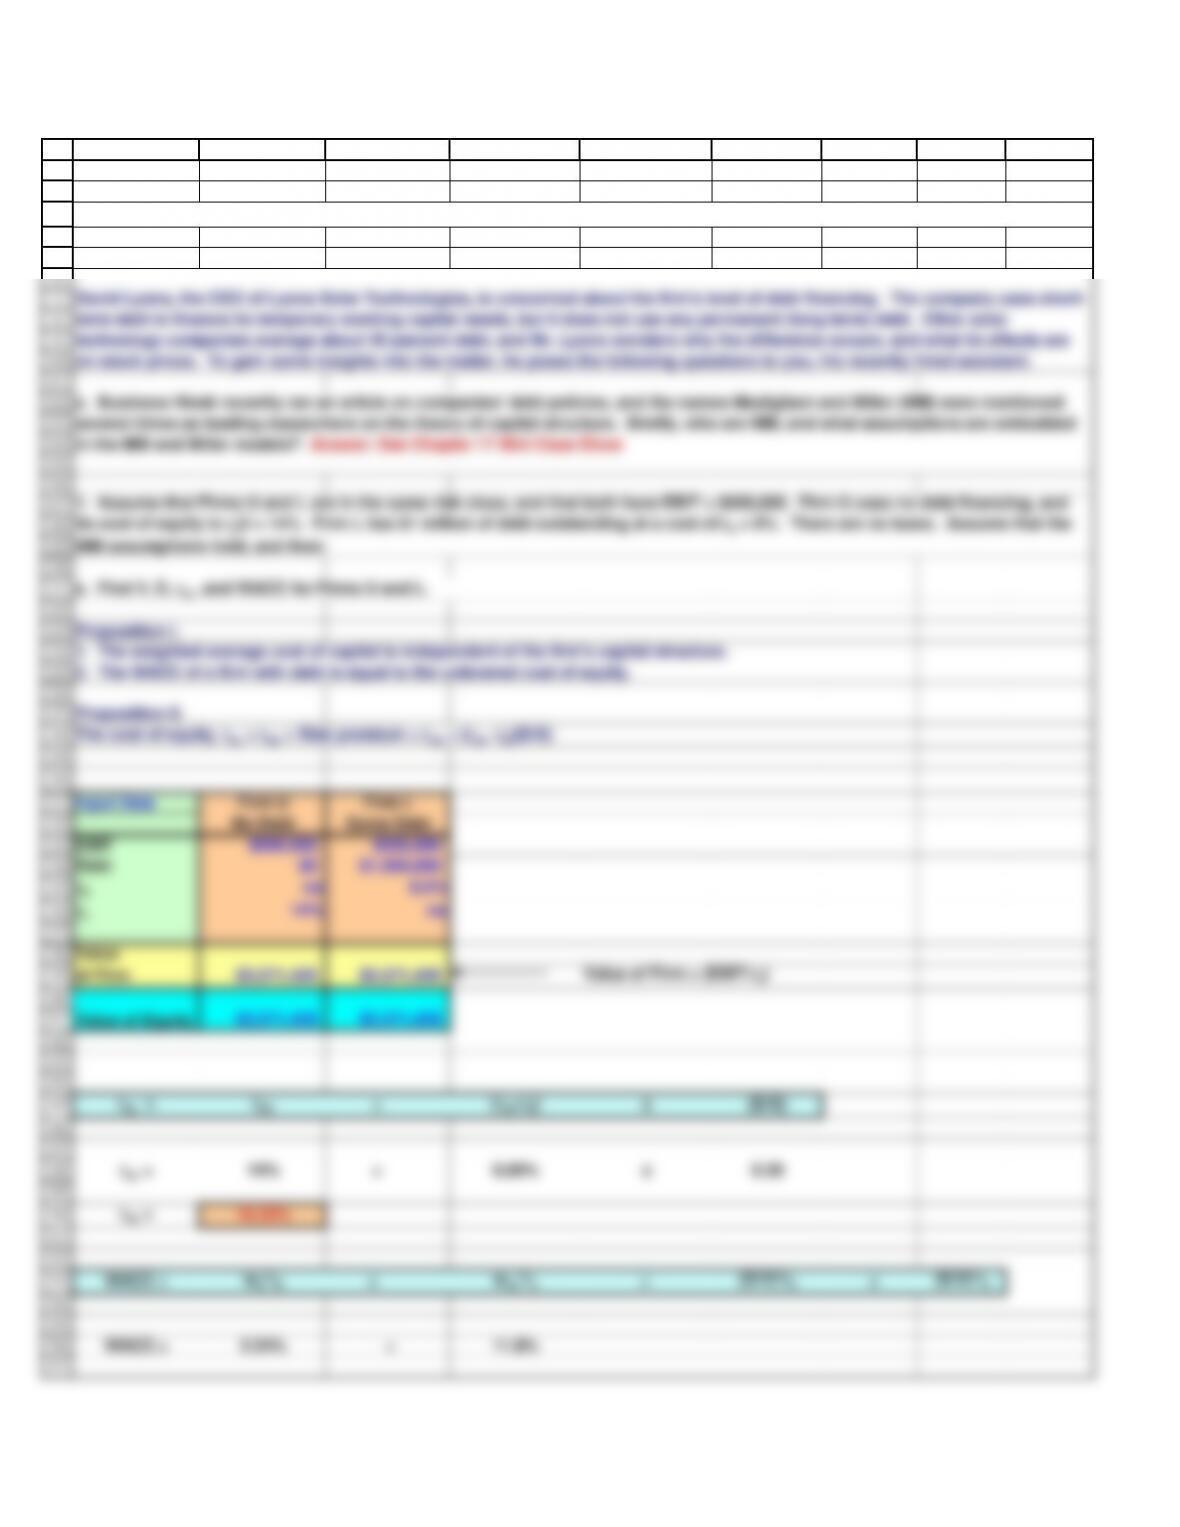
Chapter 21. Mini Case
David Lyons, the CEO of Lyons Solar Technologies, is concerned about his firm’s level of debt financing. The company uses short-
term debt to finance its temporary working capital needs, but it does not use any permanent (long-term) debt. Other solar
technology companies average about 30 percent debt, and Mr. Lyons wonders why the difference occurs, and what its effects are
on stock prices. To gain some insights into the matter, he poses the following questions to you, his recently hired assistant.
a. Business Week recently ran an article on companies’ debt policies, and the names Modigliani and Miller (MM) were mentioned
several times as leading researchers on the theory of capital structure. Briefly, who are MM, and what assumptions are embedded
MM assumptions hold, and then:
a. Find V, S, rsL, and WACC for Firms U and L.
58
59
60
61
62
63
64
70
103
104
105
106
107
rs14.00% 16.33% 14.00% 16.33%
Tax Rate 0% 0% 40% 40%
115
A B C D E F G H I
WACC = 14.00%
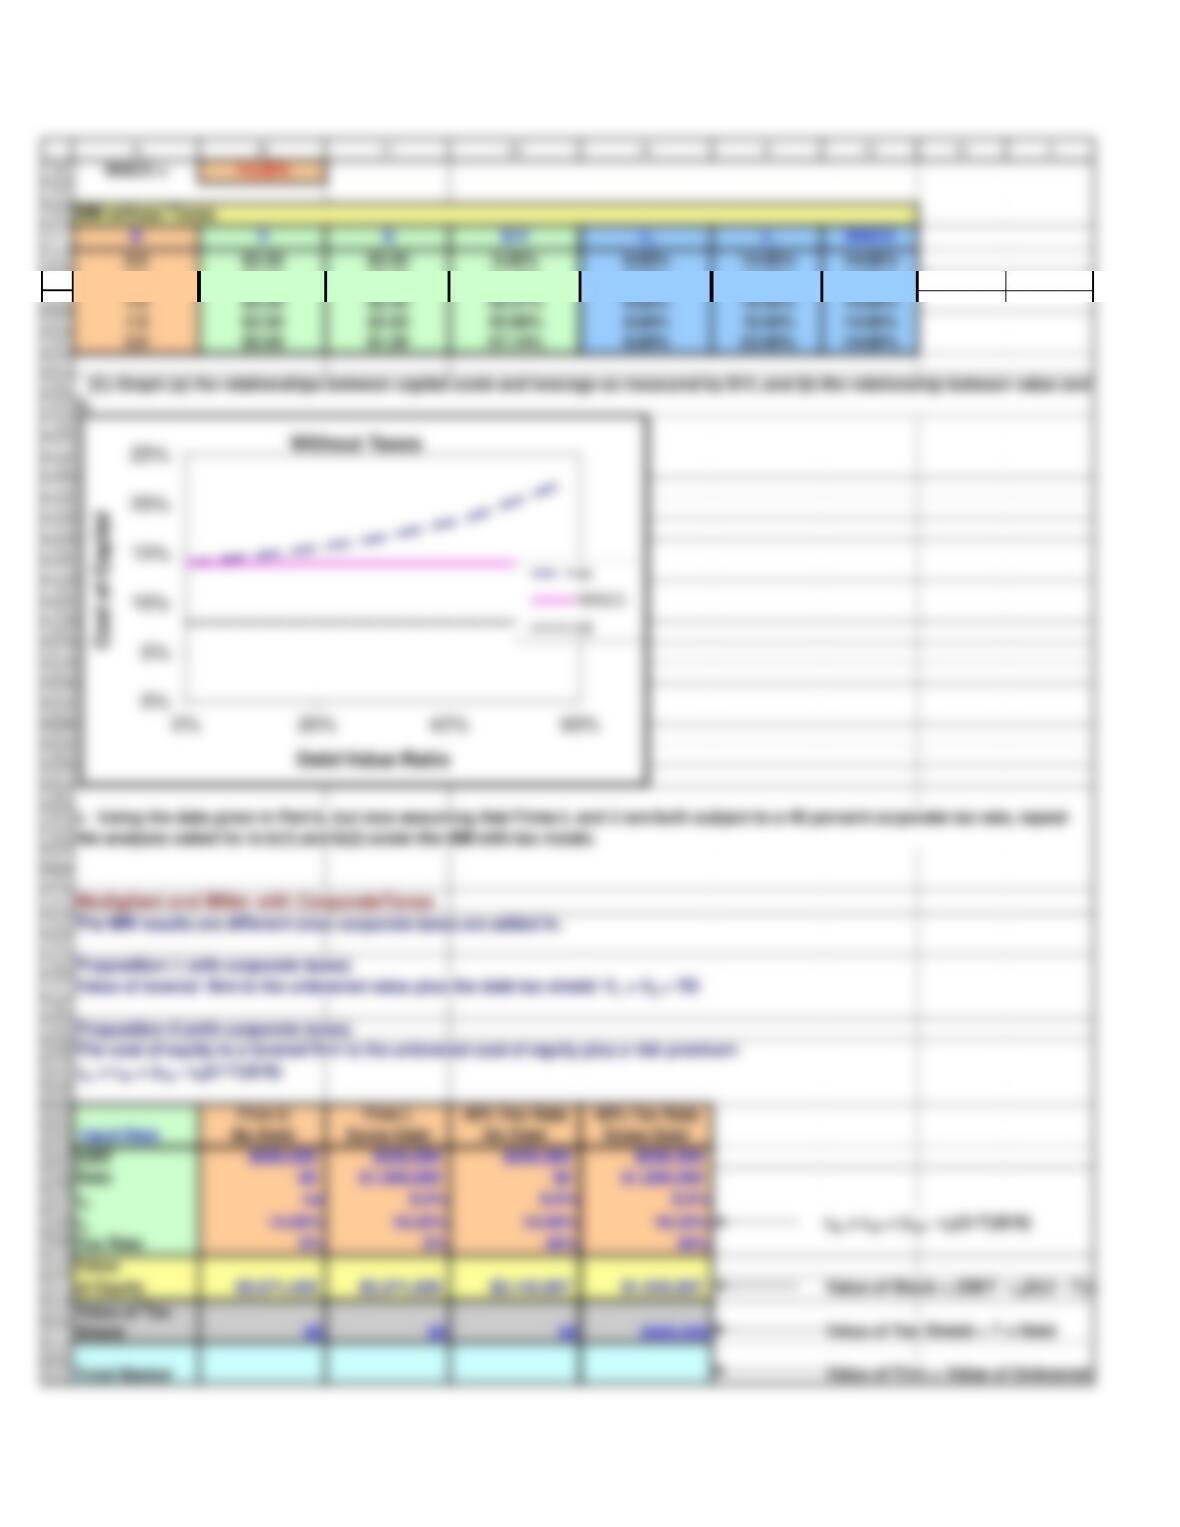
MM without Taxes
D V S D/V
rdrsWACC
0.0 $3.50 $3.50 0.00% 8.00% 14.00% 14.00%
0.5 $3.50 $3.00 14.29% 8.00% 15.00% 14.00%
1.0 $3.50 $2.50 28.57% 8.00% 16.40% 14.00%
Firm U Firm L 40% Tax Rate 40% Tax Rate
Input Data No Debt Some Debt No Debt Some Debt
EBIT $500,000 $500,000 $500,000 $500,000
Debt $0 $1,000,000 $0 $1,000,000
rdna 8.0% 8.0% 8.0%
Value of Firm = Value of Unlevered F
Total Market
116
117
118
119
120
121
122
126
127
128
129
130
137
138
139
140
141
142
148
149
150
151
152
153
159
160
161
A B C D E F G H I
WACC 14.00% 14.00% 14.00% 11.80%
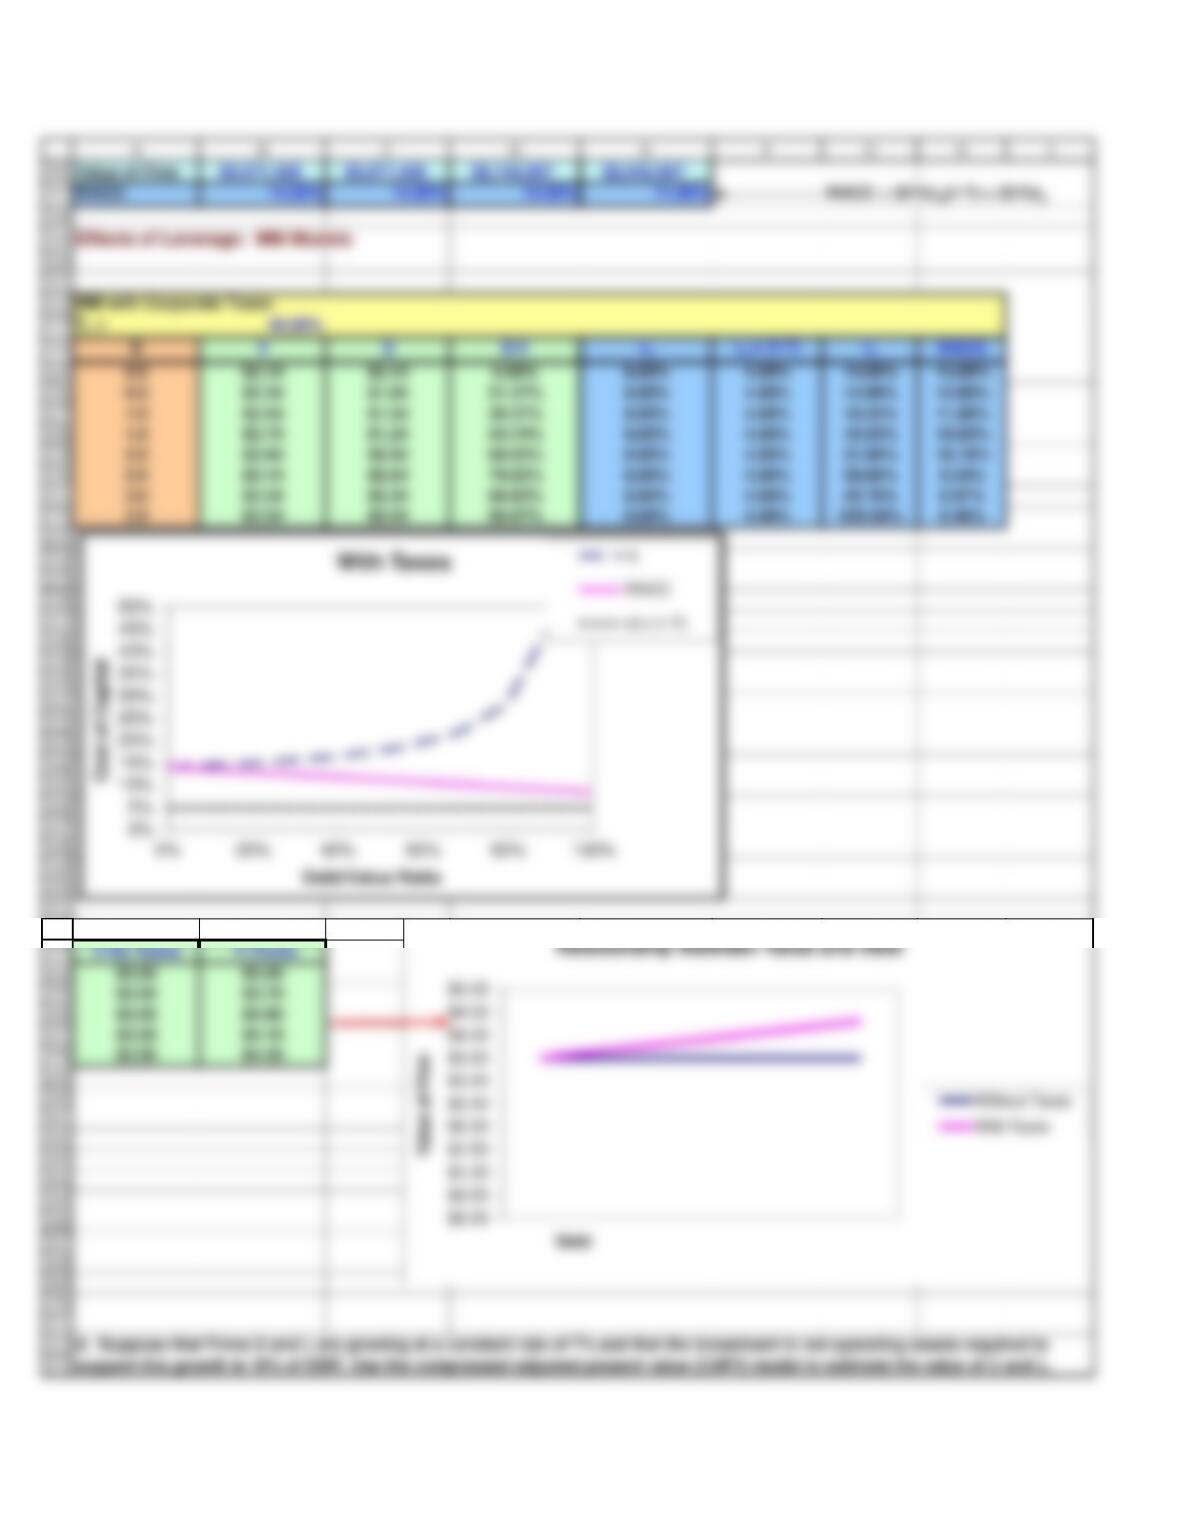
Effects of Leverage: MM Models
MM with Corporate Taxes
0.5 $2.34 $1.84 21.37% 8.00% 4.80% 14.98% 12.80%
1.0 $2.54 $1.54 39.37% 8.00% 4.80% 16.34% 11.80%
1.5 $2.74 $1.24 54.74% 8.00% 4.80% 18.35% 10.93%
2.0 $2.94 $0.94 68.03% 8.00% 4.80% 21.66% 10.19%
2.5 $3.14 $0.64 79.62% 8.00% 4.80% 28.06% 9.54%
V-No Taxes V-Taxes
WACC = (D/V)rd(1-T) + (S/V)rs
$3,571,429
$2,142,857
$2,542,857
Total Market
Value of Firm
$3,571,429
25%
30%
35%
40%
45%
0% 20% 40% 60% 80% 100%
Debt/Value Ratio
rd x (1-T)
$2.50
$3.00
Relationship Between Value and Debt
Without Taxes
174
175
176
177
178
179
180
181
184
185
186
188
189
= NOPAT
195
196
197
198
199
200
208
209
210
211
Value of Tax Shield = (rd T D)/( rU – g
Of Firm $2,142,857 $3,571,429 $2,371,429 $4,028,571 Value of Firm = Value of Unlevered F
217
218
219
220
221
222
from part c.
228
229
230
A B C D E F G H I
50,000
7%
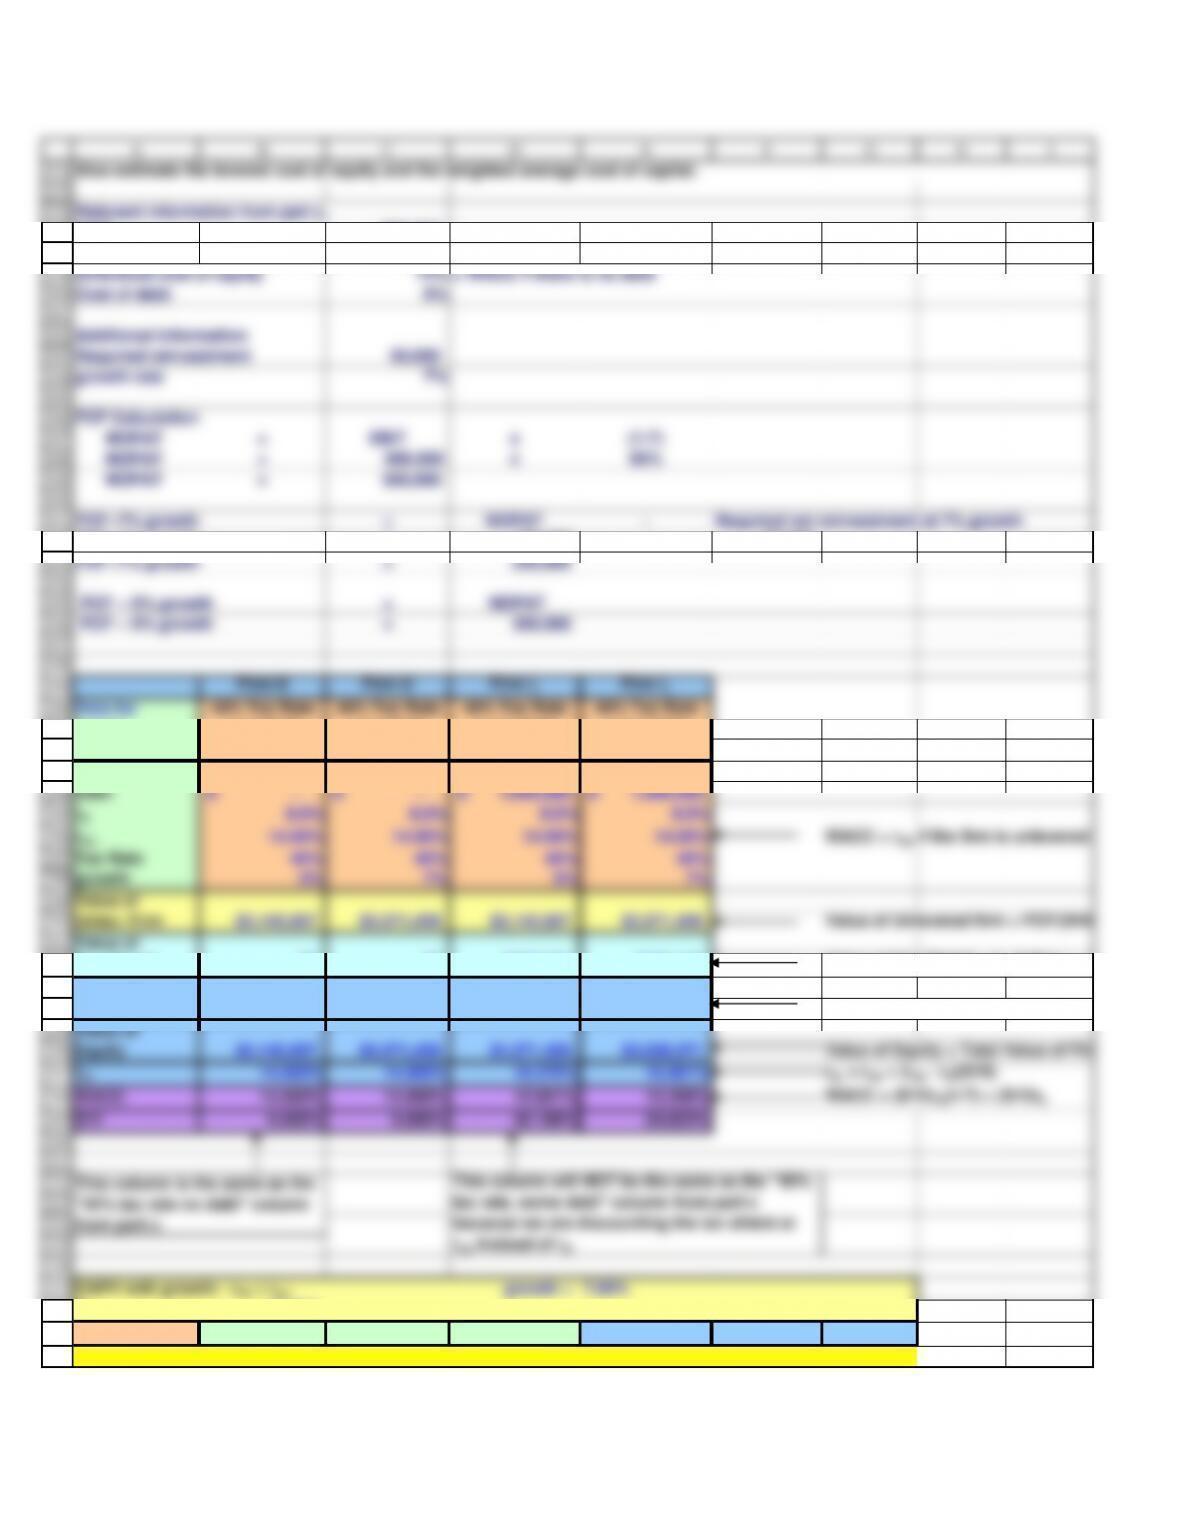
Relevant information from part c.
EBIT
500,000
Tax rate
40%
Unlevered cost of equity
14% = WACC if there is no debt
Cost of debt
8%
growth rate
FCF Calculation
NOPAT
NOPAT
=300,000
FCF — 0% growth
FCF — 0% growth
= 300,000
Firm U Firm U Firm L Firm L
Data for 40% Tax Rate 40% Tax Rate 40% Tax Rate 40% Tax Rate
growth 0% 7% 0% 7%
Value of
Unlev. Firm $2,142,857 $3,571,429 $2,142,857 $3,571,429 Value of Unlevered firm = FCF/(WAC
Value of
rsL 14.000% 14.000% 18.375% 15.981% rsL = rsU + (rsU – rd)(D/S)
WACC 14.000% 14.000% 12.651% 13.206%
WACC = (D/V)rd(1-T) + (S/V)rs
D/V 0.000% 0.000% 42.169% 24.823%
T = 40.00%
DV S D/V Tax shield
rsL WACC
$4,028,571 $3,028,571 24.823% $457,143 15.981% 13.206%
This column will NOT be the same as the “40%
This column is the same as the
Also estimate the levered cost of equity and the weighted average cost of capital.
231
232
233
234
235
236
237
238
239
240
241
242
248
249
250
251
252
253
259
260
261
262
263
264
270
271
272
273
274
11.20%
281
282
283
284
285
14.40% 13.44% 14.67% 13.68%
A B C D E F G H I
– 3,571,429 3,571,429 0.00% – 14.00% 14.00%
500,000 3,800,000 3,300,000 13.16% 228,571 14.91% 13.58%
1,000,000 4,028,571 3,028,571 24.82% 457,143 15.98% 13.21%
1,500,000 4,257,143 2,757,143 35.23% 685,714 17.26% 12.87%
2,000,000 4,485,714 2,485,714 44.59% 914,286 18.83% 12.57%
2,500,000 4,714,286 2,214,286 53.03% 1,142,857 20.77% 12.30%
3,000,000 4,942,857 1,942,857 60.69% 1,371,429 23.26% 12.06%
3,500,000 5,171,429 1,671,429 67.68% 1,600,000 26.56% 11.83%
2. The gain from debt is larger with growth than without growth.
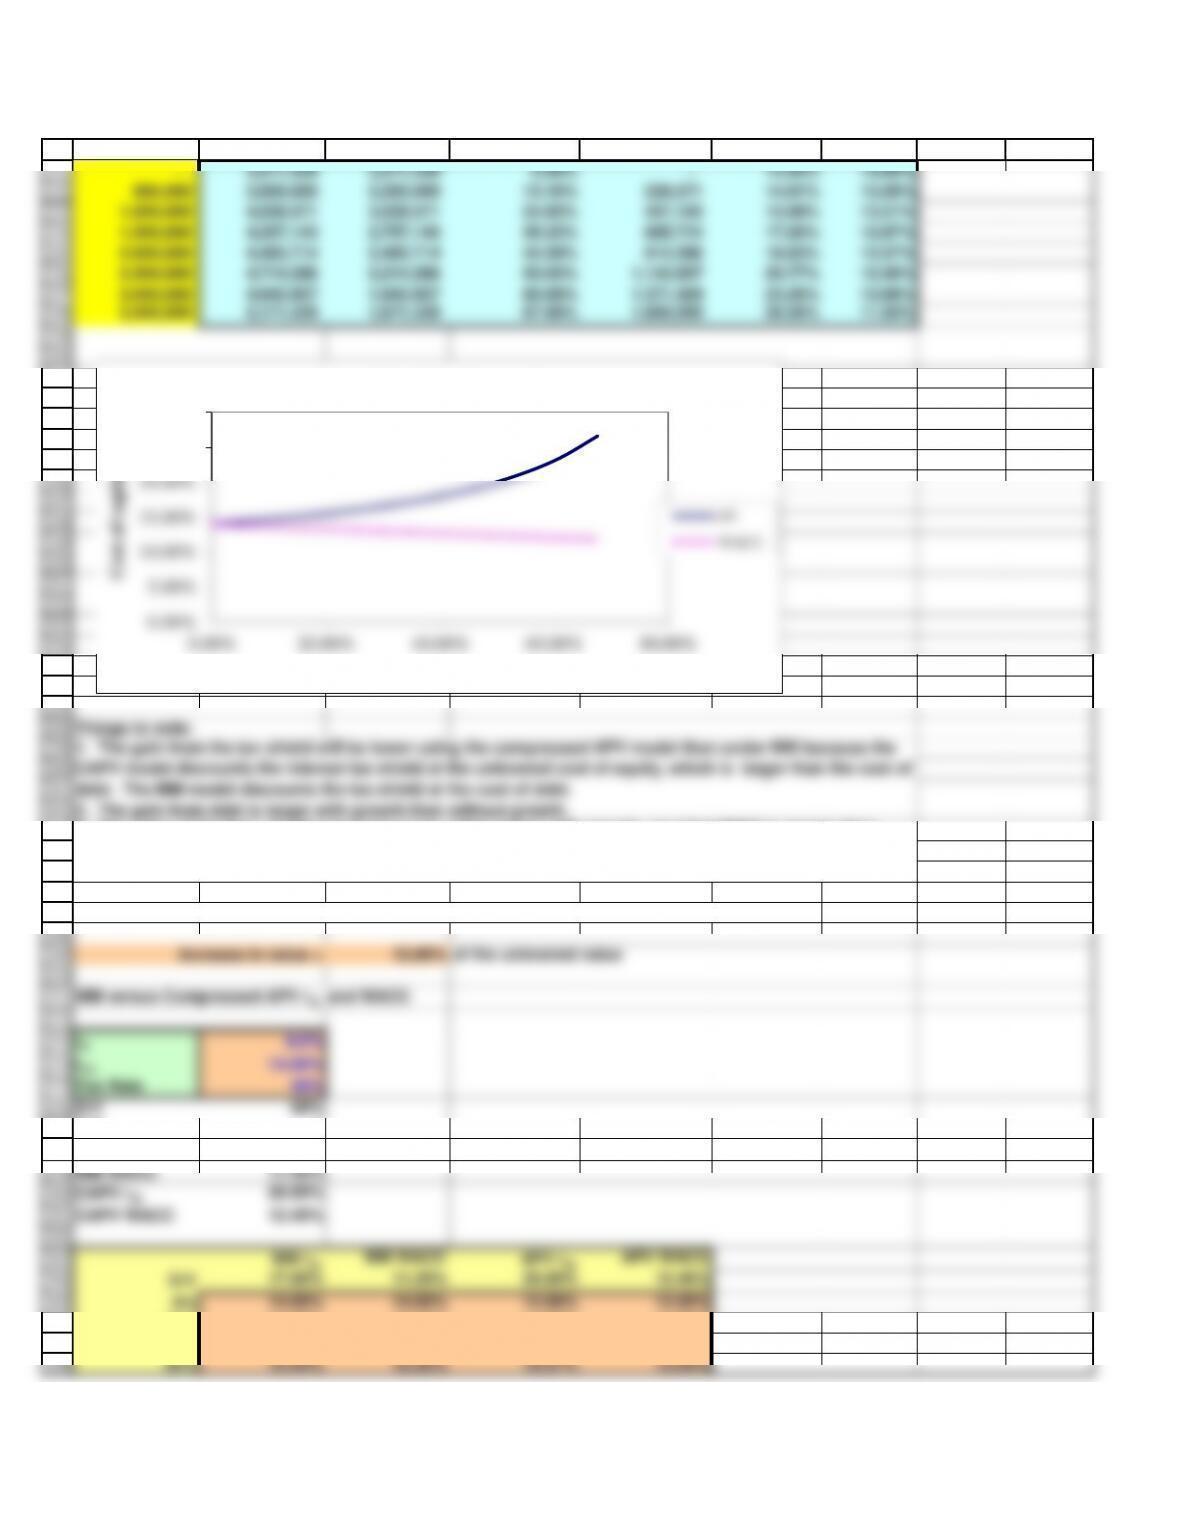
MM versus Compressed APV rsL and WACC
rd8.0%
rsU 14.00%
CAPV WACC
12.40%
MM rsL MM WACC APV rsL APV WACC
D/V 17.60% 11.20% 20.00% 12.40%
0%
14.00% 14.00% 14.00% 14.00%
1. The gain from the tax shield will be lower using the compressed APV model than under MM because the
CAPV model discounts the interest tax shield at the unlevered cost of equity, which is larger than the cost of
debt. The MM model discounts the tax shield at the cost of debt.
3. The value of the firm, whether levered or not, will be larger with growth, provided ROIC is greater than
WACC. Although we don’t show it here, ROIC is greater than WACC, so the value of the firm increases with
0.00%
5.00%
10.00%
15.00%
Cost of capital
Cost of Capital with growth
WACC
289
290
291
292
293
294
295
296
302
303
304
305
306
307
313
314
315
316
317
323
324
325
326
327
A B C D E F G H I
40%
16.40% 11.76% 18.00% 12.72%
50%
17.60% 11.20% 20.00% 12.40%
60%
19.40% 10.64% 23.00% 12.08%
70%
22.40% 10.08% 28.00% 11.76%
80% 28.40% 9.52% 38.00% 11.44%
Tax Rate = 40%
Free Cash Flow
$250.00 $290.00 $320.00
rsU = 14.00%
Interest expense
$80.00 $95.00 $120.00
gL = 7%
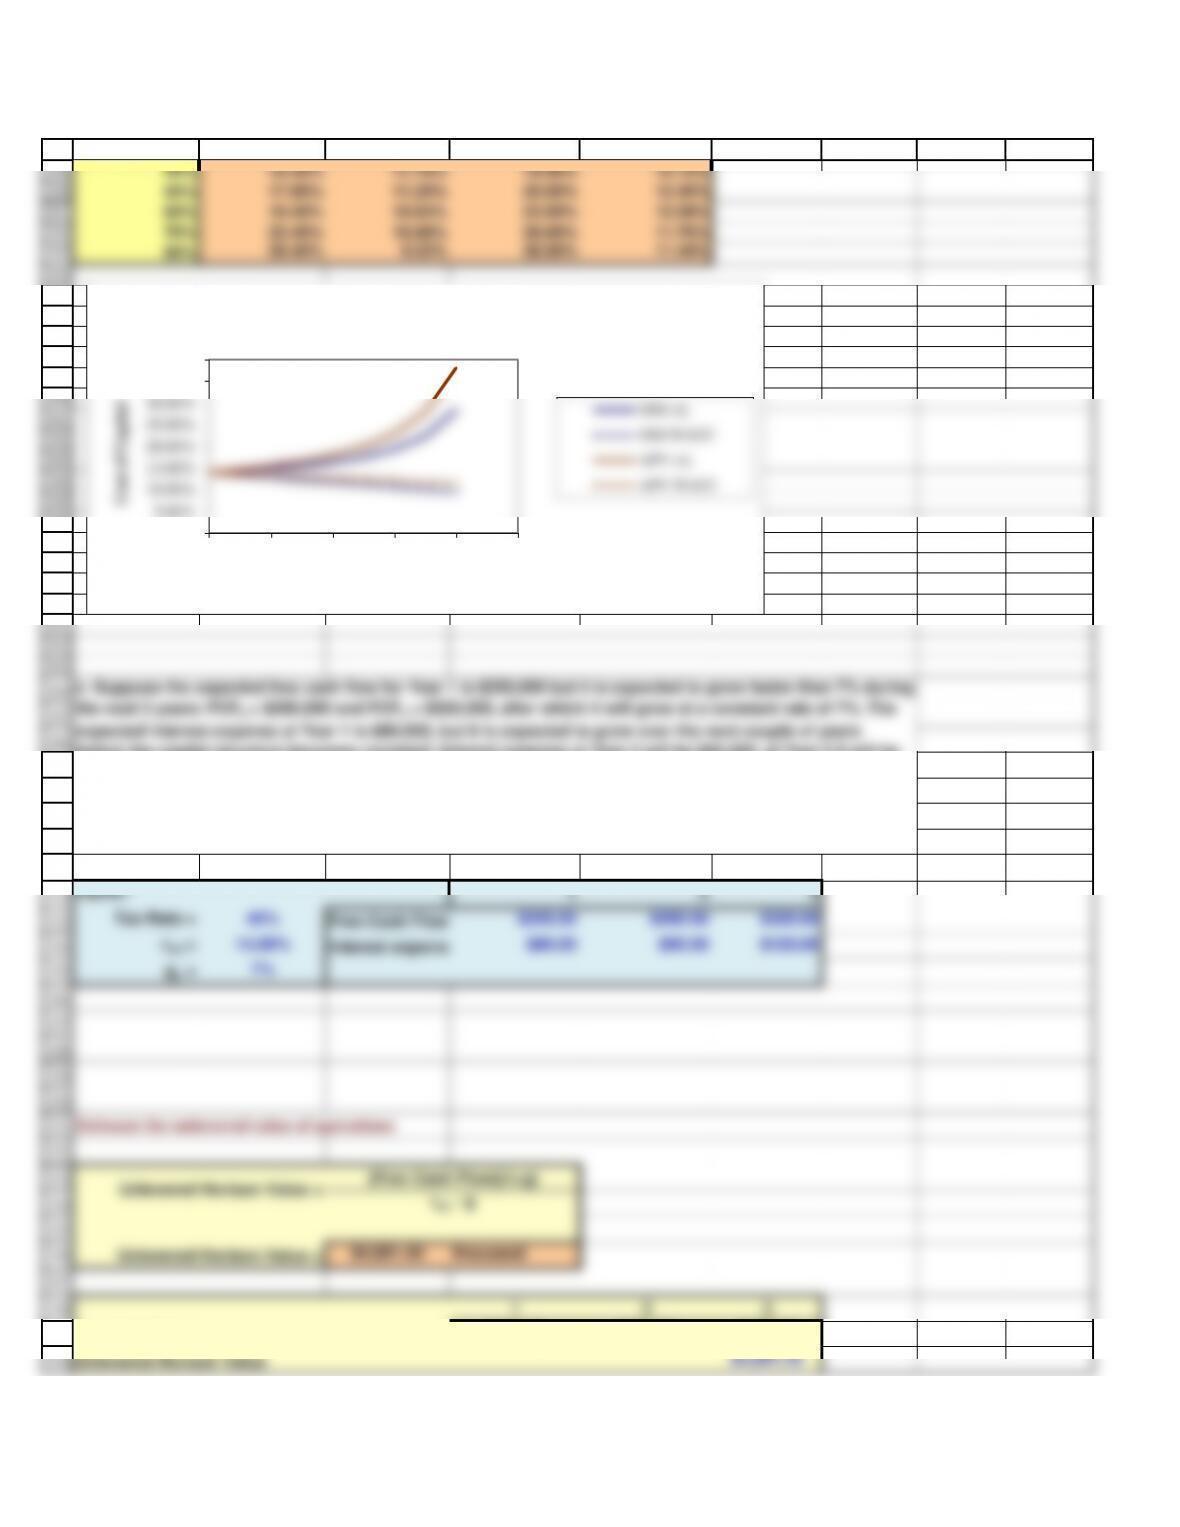
e. Suppose the expected free cash flow for Year 1 is $250,000 but it is expected to grow faster than 7% during
the next 3 years: FCF2 = $290,000 and FCF3 = $320,000, after which it will grow at a constant rate of 7%. The
expected interest expense at Year 1 is $80,000, but it is expected to grow over the next couple of years
before the capital structure becomes constant: Interest expense at Year 2 will be $95,000, at Year 3 it will be
$120,000 and it will grow at 7% thereafter. What is the estimated horizon unlevered value of operations (i.e.,
0.00%
5.00%
10.00%
15.00%
20.00%
Cost of Capital
Costs of capital for MM and APV
APV rsL
APV WACC