1
2
3
4
5
6
7
8
9
10
11
12
13
14
15
16
17
18
19
20
21
22
23
24
25
26
27
28
29
36
37
A B C D E F G H I J
Days sales outstanding (365-day basis) 45.63 32.00
Inventory turnover 10.80 20.00
Fixed assets turnover 7.75 13.22
Total assets turnover 2.60 3.00
Profit margin on sales 2.07% 3.50%
Return on equity (ROE) 10.45% 21.00%
10/28/2015
RR Industry
Current 1.75 2.25
Quick 0.92 1.16
TL/assets 58.76% 50.00%
Turnover of cash 16.67 22.22
Payables deferral period 30.00 33.00
Karen Johnson, CFO for Raucous Roasters (RR), a specialty coffee manufacturer, is rethinking her company’s working capital
policy in light of a recent scare she faced when RR’s corporate banker, citing a nationwide credit crunch, balked at renewing
RR’s line of credit. Had the line of credit not been renewed, RR would not have been able to make payroll, potentially forcing the
company out of business. Although the line of credit was ultimately renewed, the scare has forced Johnson to examine carefully
each component of RR’s working capital to make sure it is needed, with the goal of determining whether the line of credit can be
eliminated entirely. In addition to (possibly) freeing RR from the need for a line of credit, Johnson is well aware that reducing
Historically, RR has done little to examine working capital, mainly because of poor communication among business functions. In
the past, the production manager resisted Johnson’s efforts to question his holdings of raw materials, the marketing manager
resisted questions about finished goods, the sales staff resisted questions about credit policy (which affects accounts
receivable), and the treasurer did not want to talk about the cash and securities balances. However, with the recent credit scare,
this resistance became unacceptable and Johnson has undertaken a company-wide examination of cash, marketable securities,
Chapter 16. Mini Case for Supply Chains and Working Capital Management
Johnson also knows that decisions about working capital cannot be made in a vacuum. For example, if inventories could be
lowered without adversely affecting operations, then less capital would be required, and free cash flow would increase. However,
lower raw materials inventories might lead to production slowdowns and higher costs, and lower finished goods inventories
might lead to stock-outs and loss of sales. So, before inventories are changed, it will be necessary to study operating as well as
financial effects. The situation is the same with regard to cash and receivables. Johnson has begun her investigation by
38
39
40
41
42
43
44
45
46
47
48
55
56
57
58
59
65
66
67
68
69
77
78
79
80
81
g. Does RR face any risks if it tightens its credit policy? See Ch16 Mini Case Show.
should tighten or loosen its credit policy? What four variables make up a firm’s credit policy, and in what direction should each
be changed by RR? See Ch16 Mini Case Show.
88
A B C D E F G H I J
COGS =0.90 × Sales
COGS =0.90 × $660,000
COGS =$594,000
=COGS / Inventory
10.80 =$594,000 / Inventory
Inventory =$55,000
=
Inventory / Daily COGS
=$55,000 / $1,627.40
=33.8 days
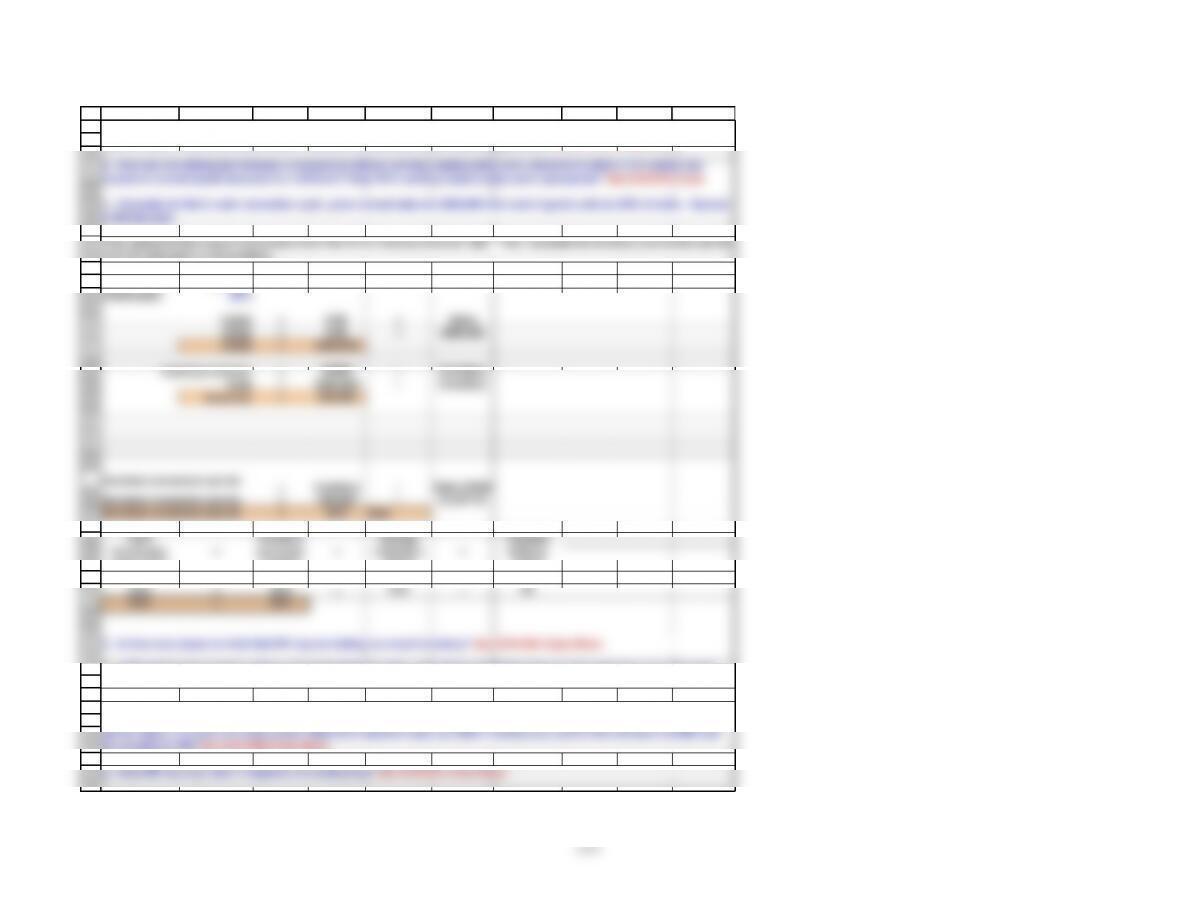
c. Calculate the firm’s cash conversion cycle given annual sales are $660,000 and cost of goods sold are 90% of sales. Assume
a 365-day year.
First, determine the amount of inventory from the firm’s inventory turnover ratio. Then, calculate the inventory conversion period
from the data given in the problem.
b. How can one distinguish between a relaxed but rational working capital policy and a situation in which a firm simply has
excessive current assets because it is inefficient? Does RR’s working capital policy seem appropriate? See Ch16 Mini Case
a. Johnson plans to use the preceding ratios as the starting point for discussions with RR’s operating team. Based on the data,
does RR seem to be following a relaxed, moderate, or restricted current asset usage policy? See Ch16 Mini Case Show.
Inventory turnover
d. Is there any reason to think that RR may be holding too much inventory? See Ch16 Mini Case Show.
Inventory conversion period
Inventory conversion period
e. If RR reduces its inventory without adversely affecting sales, what effect should this have on free cash flow: (1) in the short
run and (2) in the long run? See Ch16 Mini Case Show.
Payables
Cash
Inventory
Average
89
90
91
92
93
94
95
96
97
98
99
100
101
102
103
104
105
106
107
108
109
110
111
116
117
118
119
120
121
Credit Breakdown
127
A B C D E F G H I J
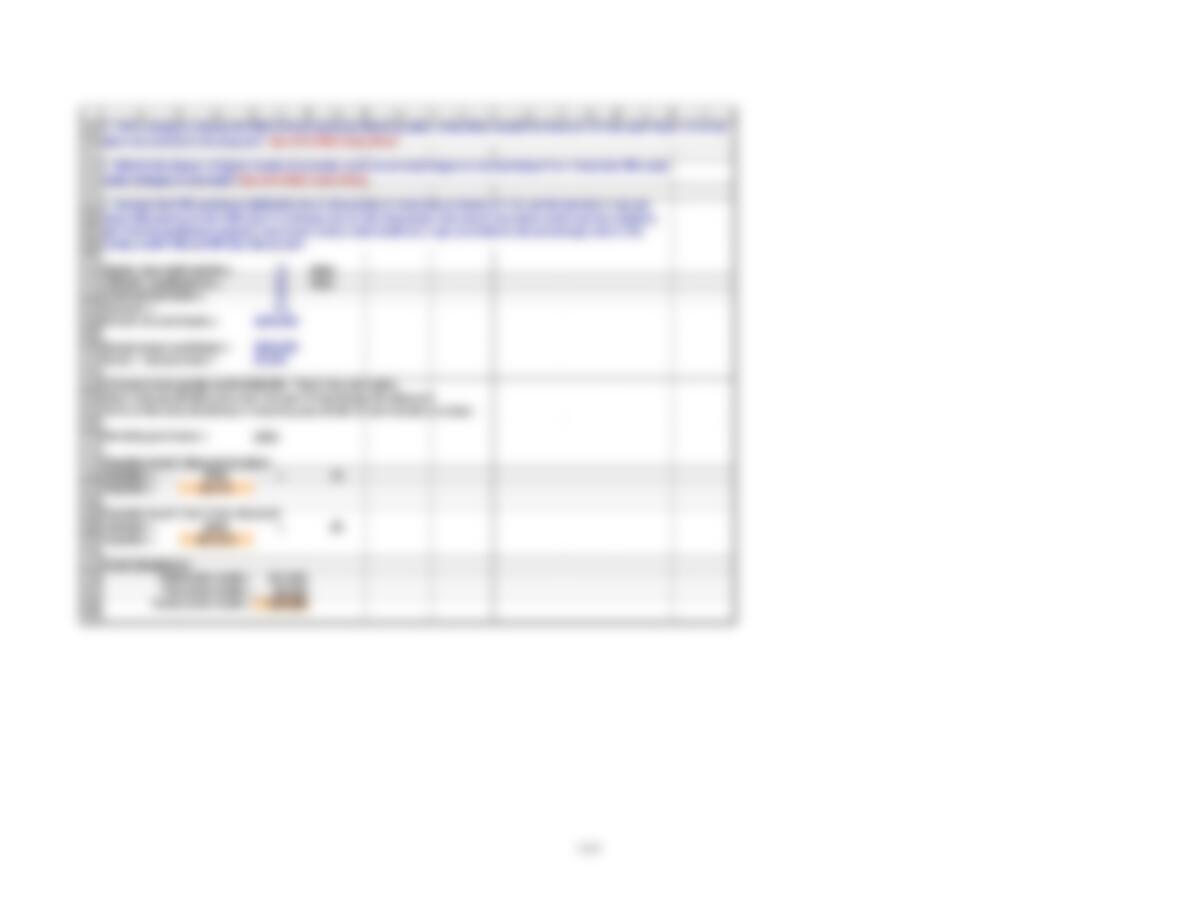
Payables level if discount is taken:
Terms: free credit period = 10 days.
“Official” credit period = 30 days.
Credit period taken = 40
Discount = 1%
Annual net purchases = $200,000
Annual gross purchases = $202,020
Gross – net purchase = $2,020
Company buys goods worth $200,000. That’s the cash price.
They must pay $2,020 more over the year if they forego the discount.
Think of the extra $2,020 as a financing cost similar to the interest on a loan.
Payables = $548 ×10
Payables = $5,479
Payables level if don’t take discount:
Payables = $548 ×40
Payables = $21,918
j. Assume that RR purchases $200,000 (net of discounts) of materials on terms of 1/10, net 30, but that it can get
away with paying on the 40th day if it chooses not to take discounts. How much free trade credit can the company
get from its equipment supplier, how much costly trade credit can it get, and what is the percentage cost of the
costly credit? Should RR take discounts?
h. If the company reduces its DSO without seriously affecting sales, what effect would this have on its free cash flows: (1) in the
short run and (2) in the long run? See Ch16 Mini Case Show.
i. What is the impact of higher levels of accruals, such as accrued wages or accrued taxes? Is it likely that RR could
make changes to accruals? See Ch16 Mini Case Show.
128
129
130
131
132
133
134
135
136
138
139
140
141
142
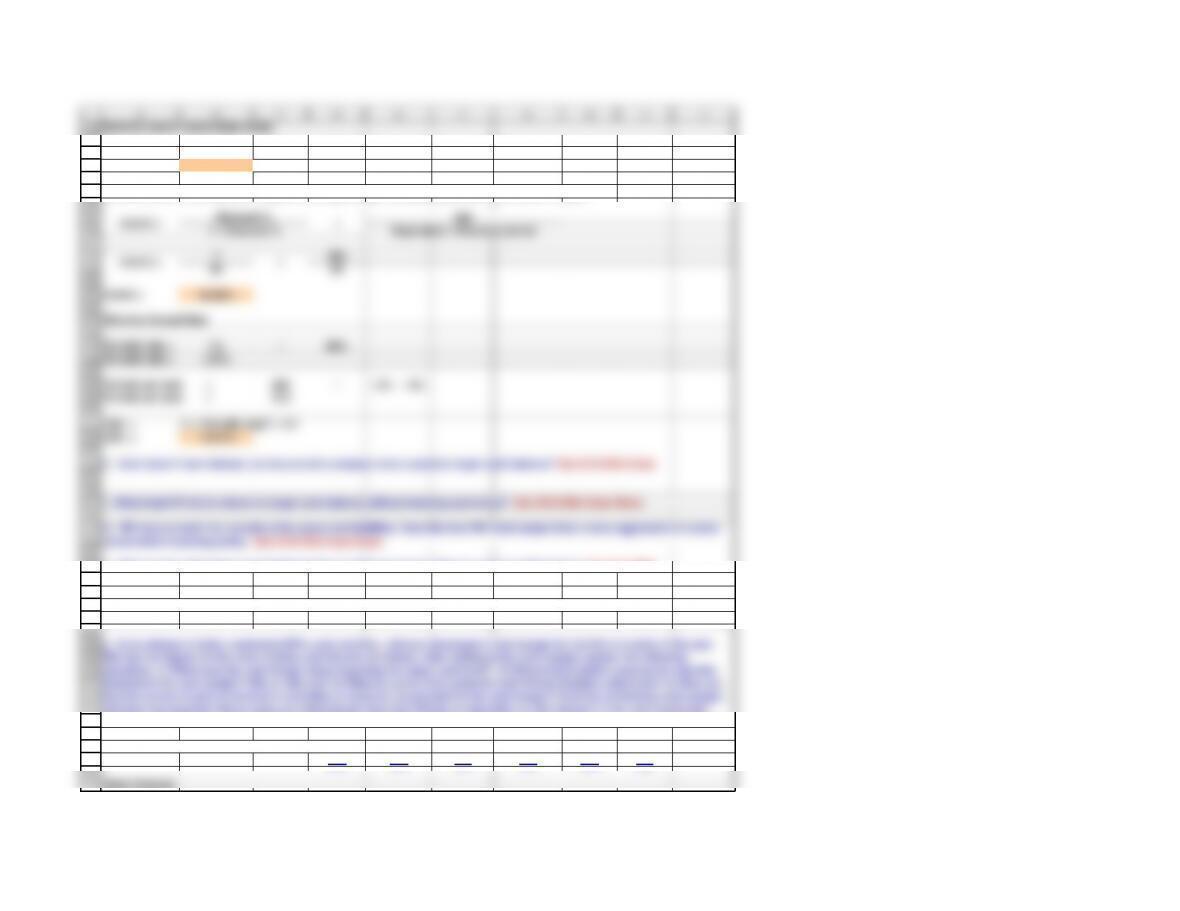
Effective Annual Rate
Periodic rate = 1% /99%
Periodic rate = 1.01%
Periods per year = 365 /( 40 – 10 )
149
150
151
152
153
A B C D E F G H I J
Nominal cost of costly trade credit:
r(nom) = $2,020 / $16,438
r(nom) = 12.29%
But the $2,020 in lost discounts is paid all during the year, not just at year-end, so the EAR is higher.
1365
99 30
r(nom) = 12.29%
Periods per year = 12.2
EAR =
(1 + Periodic rate)n – 1.0
EAR = 13.01%
r(nom) =
×
Discount %
r(nom) =
1 – Discount %
Days taken – Discount period
×
365
180
181
182
183
184
185
186
187
188
189
190
191
192
193
194
195
196
197
198
199
200
201
202
203
204
205
206
207
208
209
210
A B C D E F G H I J
( 1 ) Sales (gross) $71,218 $68,212 $65,213 $52,475 $42,909 $30,524
Collections
( 2) During month of sale
(month’s sales) x (0.98) x 0.2 12,781.75 10,285.10
( 3 ) During first month after sale
(previous month’s sales) x 0.7 47,748.40 45,649.10
( 4 ) During second month after sale
(sales 2 months ago) x 0.1 7,121.80 6,821.20
( 5 ) Total collections (Lines 2 + 3 + 4) $67,651.95 $62,755.40
Purchases
( 6 ) During month $44,603.75 $36,472.65 $25,945.40
(forecast sales in 2 months)x 0.85
Payments
( 7 ) Payments (1-month lag) 44,603.75 36,472.65
( 8 ) Wages and salaries 6,690.56 5,470.90
( 9 ) Rent 2,500.00 2,500.00
( 10 ) Taxes
( 11 ) Total payments $53,794.31 $44,443.55
Net Cash Flows
( 12 ) Cash on hand at start of forecast $3,000.00
( 13 ) NCF: Total Collection – Payments (Line 5 – Line 11) $13,857.64 $18,311.85
( 14 ) Cum. NCF: Prior mos. + this mos. NCF $16,857.64 $35,169.49
Cash Surplus (or Loan Requirement)
( 15 ) Target cash balance 1,500.00 1,500.00
( 16 ) Cumulative surplus cash or loan needed
(Line 16 – Line 17) $15,357.64 $33,669.49