Mini Case: 12 – 21
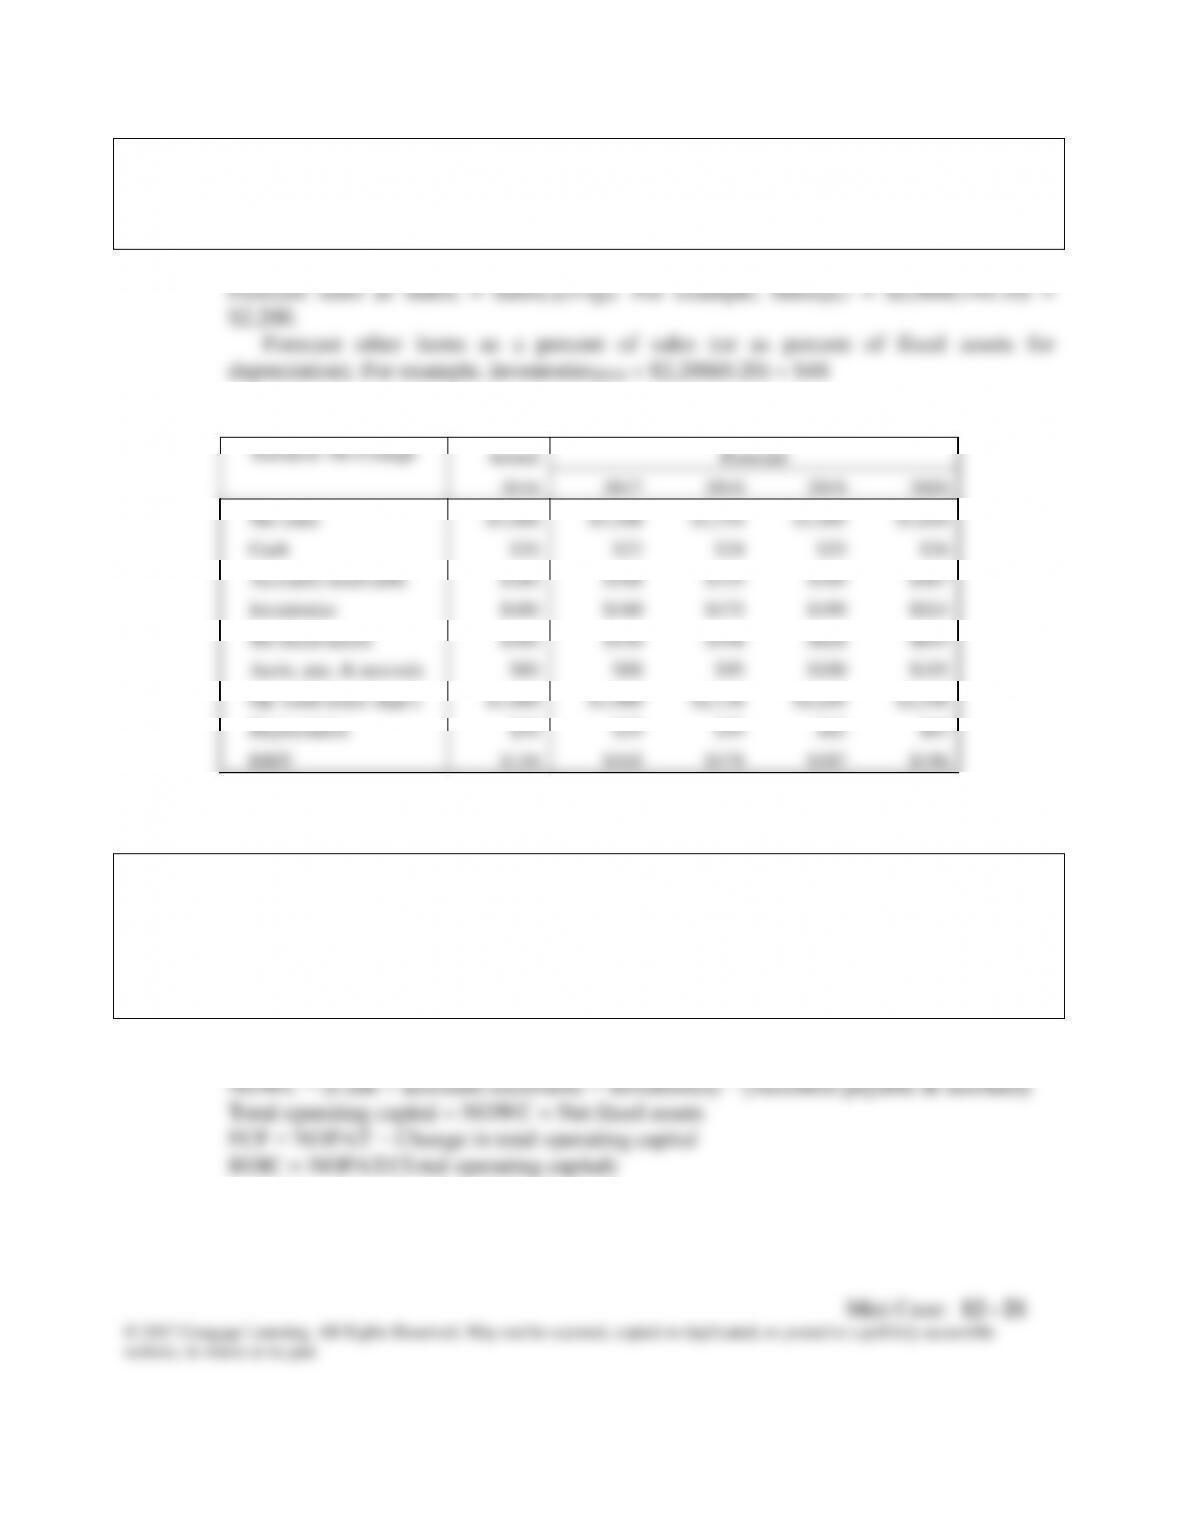
e. 1. For each of the next four years, forecast the following items: sales, cash, accounts
receivable, inventories, net fixed assets, accounts payable & accruals, operating
costs (excluding depreciation), depreciation, and earnings before interest and taxes
(EBIT).
Scenario: No Change
Actual
Forecast
2016
2017
2018
2019
2020
Net sales
$2,000
$2,200
$2,376
$2,495
$2,620
Cash
$20
$22
$24
$25
$26
Accounts receivable
$280
$308
$333
$349
$367
Inventories
$400
$440
$475
$499
$524
Net fixed assets
$500
$550
$594
$624
$655
Accts. pay. & accruals
$80
$88
$95
$100
$105
Op. costs (excl. depr.)
$1,800
$1,980
$2,138
$2,245
$2,358
Depreciation
$50
$55
$59
$62
$65
EBIT
$150
$165
$178
$187
$196
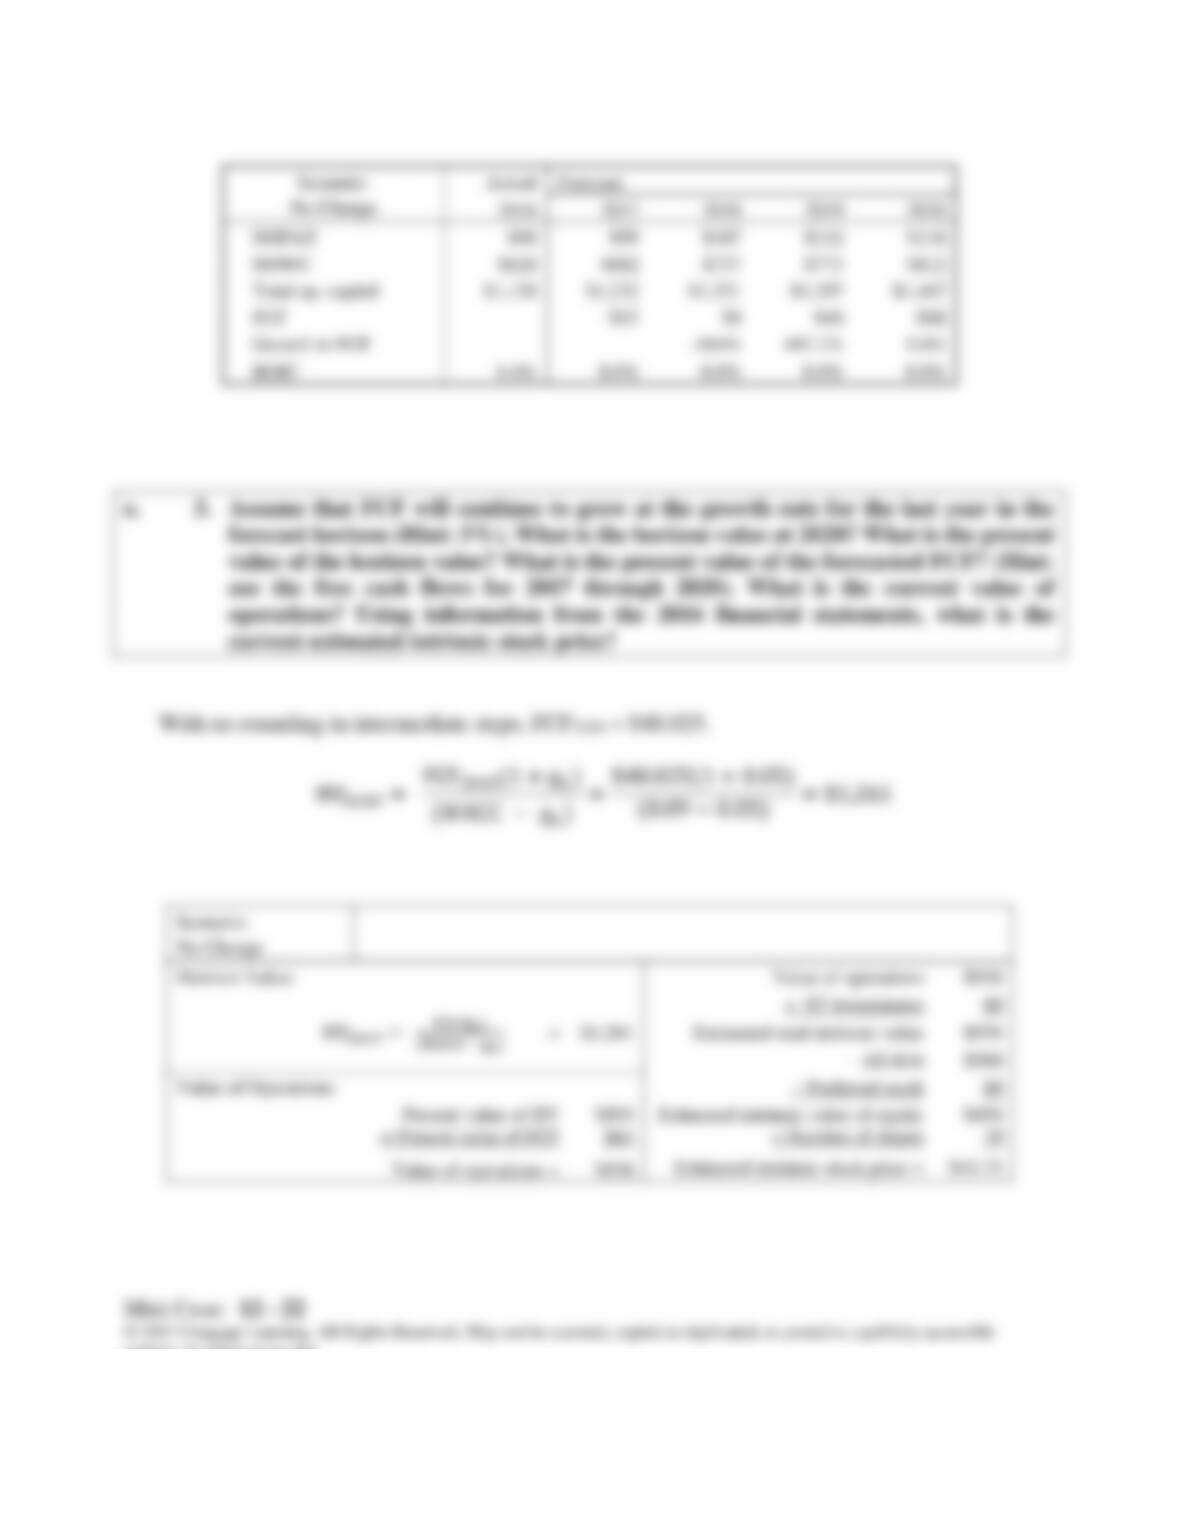
e. 2. Using the previously forecasted items, calculate for each of the next four years the
net operating profit after taxes (NOPAT), net operating working capital, total
operating capital, free cash flow, (FCF), annual growth rate in FCF, and return on
invested capital. What does the forecasted free cash flow in the first year imply
about the need for external financing? Compare the forecasted ROIC compare
with the WACC. What does this imply about how well the company is performing?
NOPAT = EBIT(1-T)
website, in whole or in part.
Scenario:
Actual
Forecast
No Change
2016
2017
2018
2019
2020
NOPAT
$90
$99
$107
$112
$118
NOWC
$620
$682
$737
$773
$812
Total op. capital
$1,120
$1,232
$1,331
$1,397
$1,467
FCF
−$13
$8
$46
$48
Growth in FCF
–164%
447.1%
5.0%
ROIC
8.0%
8.0%
8.0%
8.0%
8.0%
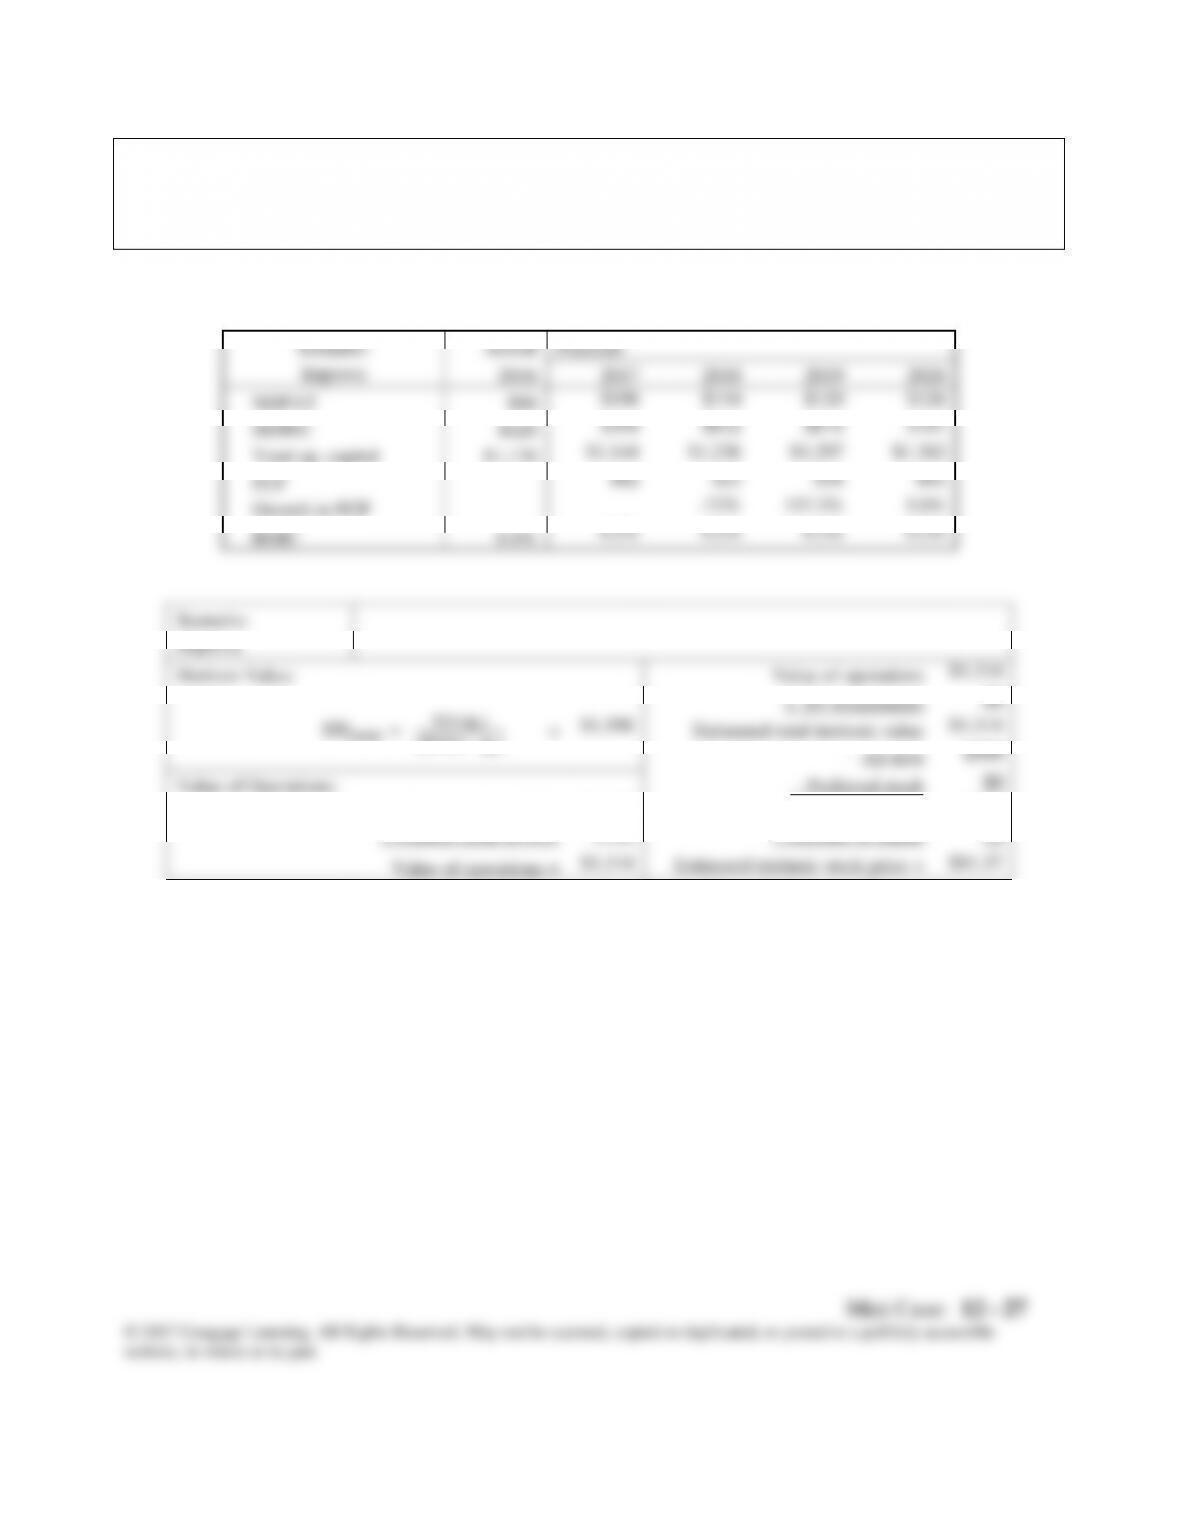
e. 3. Assume that FCF will continue to grow at the growth rate for the last year in the
forecast horizon (Hint: 5%). What is the horizon value at 2020? What is the present
value of the horizon value? What is the present value of the forecasted FCF? (Hint:
use the free cash flows for 2017 through 2020). What is the current value of
operations? Using information from the 2016 financial statements, what is the
current estimated intrinsic stock price?
Scenario:
No Change
Horizon Value:
Value of operations
$958
+ ST investments
$0
=
$1,261
Estimated total intrinsic value
$958
− All debt
$500
Value of Operations:
− Preferred stock
$0
Present value of HV
$893
Estimated intrinsic value of equity
$458
+ Present value of FCF
$64
÷ Number of shares
10
Value of operations =
$958
Estimated intrinsic stock price =
$45.75
HV9 = 9+gL
WACC − gL

Mini Case: 12 – 23
© 2017 Cengage Learning. All Rights Reserved. May not be scanned, copied or duplicated, or posted to a publicly accessible
website, in whole or in part.
The estimated intrinsic stock value of $45.75 is less than the actual market price of
$52.80. The market price indicates that the market expected the operating performance
to improve; if operating performance doesn’t improve, the market price is likely to drop.
But keep in mind that stocks prices are very volatile, so a difference of −13% =
$45.75/$52.80 – 1 is not very big.
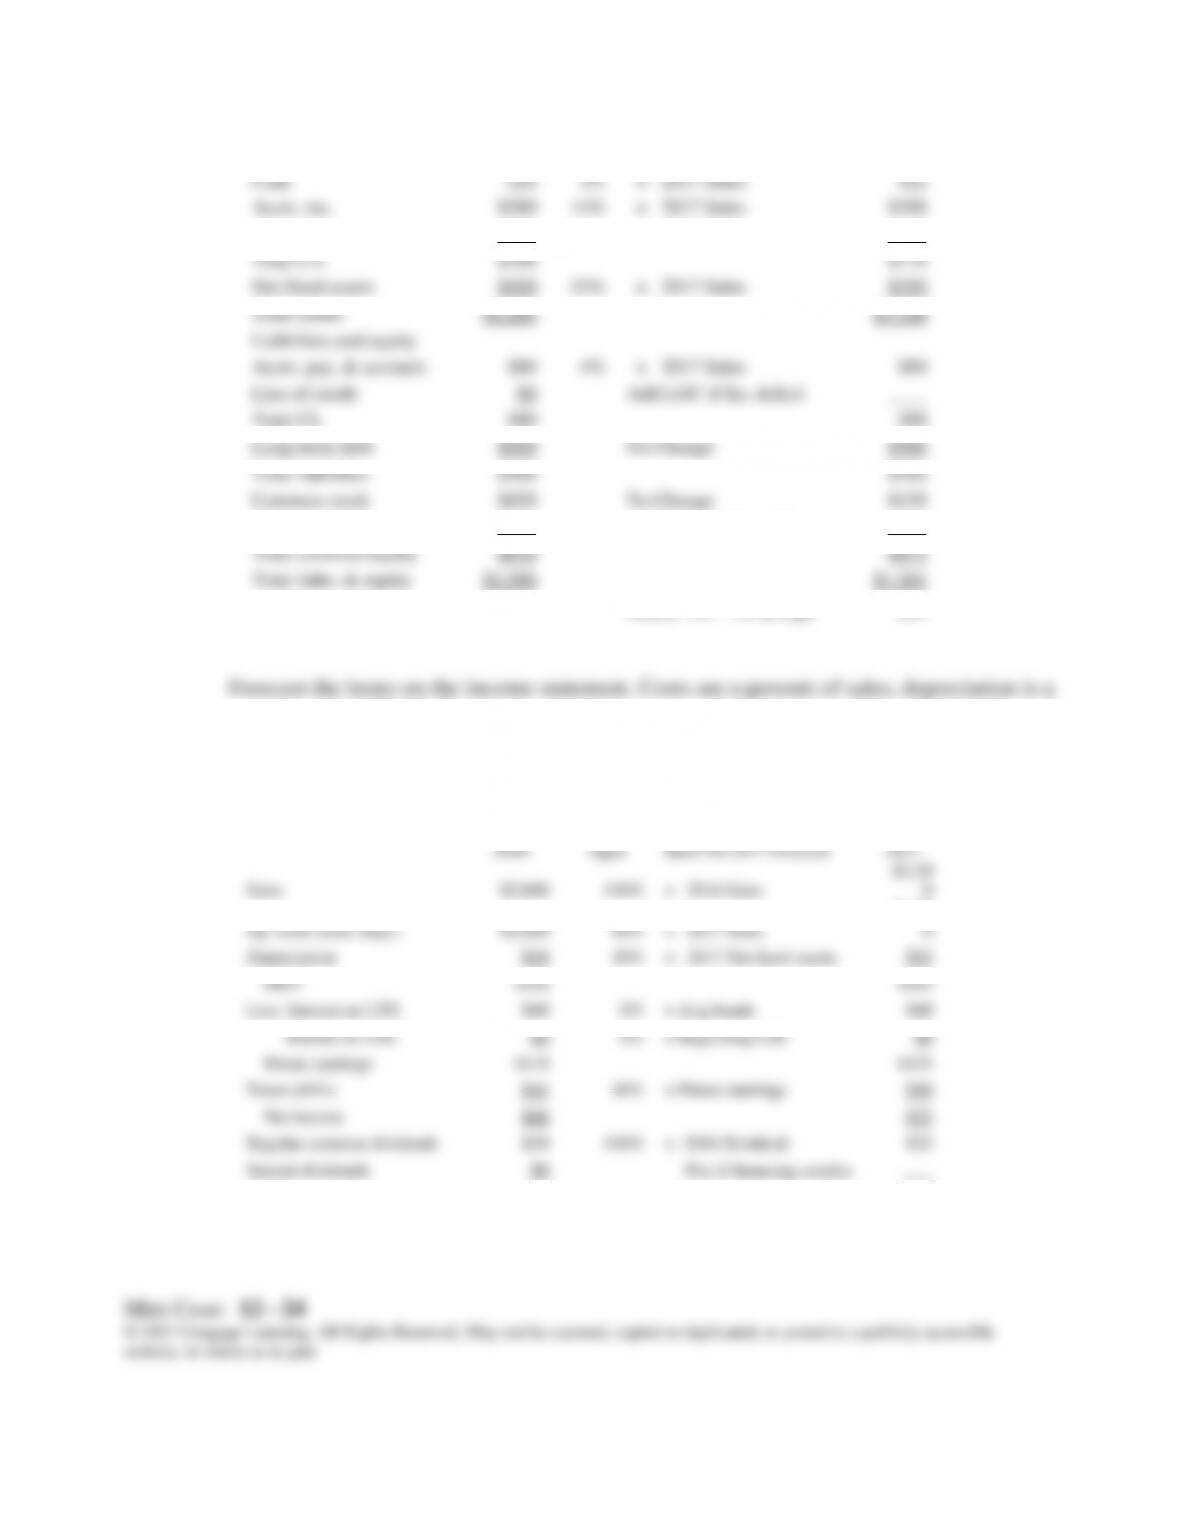
f. Continue with the same assumptions for the No Change scenario from the previous
question, but now forecast the balance sheet and income statements for 2017 (but
not for the following three years) using the following preliminary financial policy.
(1) Regular dividends will grow by 10%. (2) No additional long-term debt or
common stock will be issued. (3) The interest rate on all debt is 8%. (4) Interest
expense for long-term debt is based on the average balance during the year. (5) If
the operating results and the preliminary financing plan cause a financing deficit,
eliminate the deficit by drawing on a line of credit. The line of credit would be
tapped on the last day of the year, so it would create no additional interest expenses
for that year. (6) If there is a financing surplus, eliminate it by paying a special
dividend. After forecasting the 2017 financial statements, answer the following
questions.
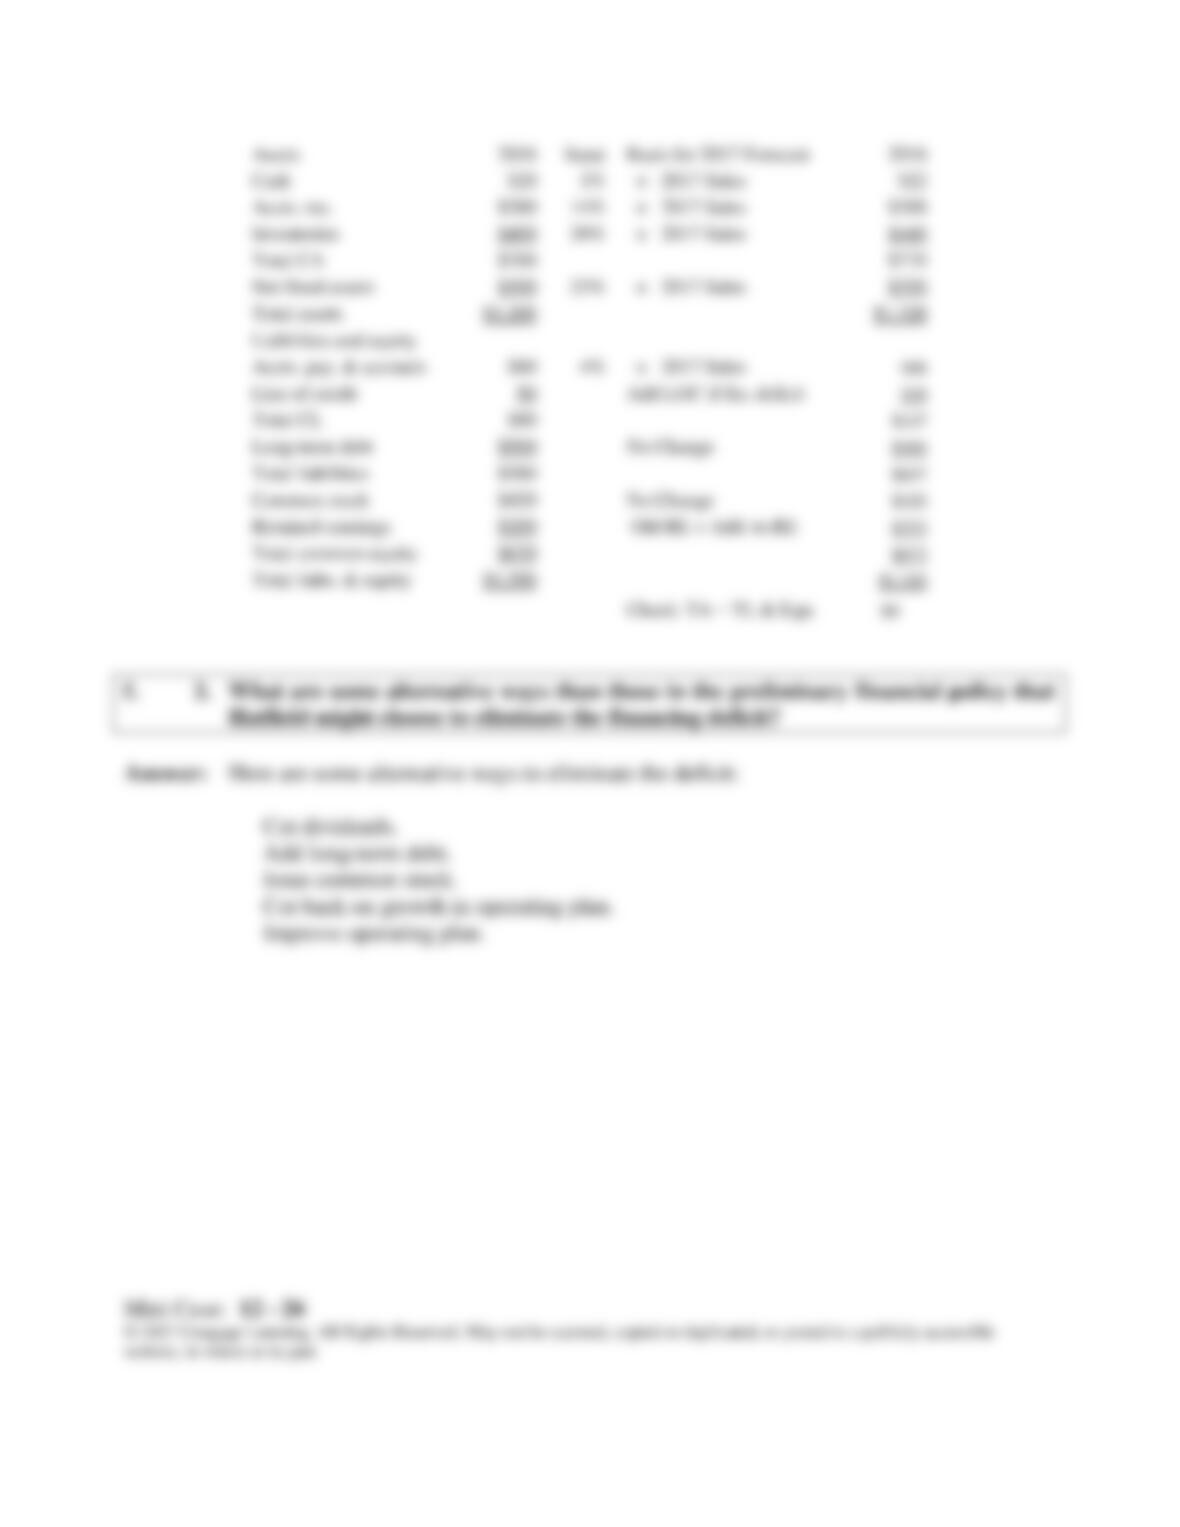
f. 1. How much will Hatfield need to draw on the line of credit?
Mini Case: 12 – 24
Assets
2016
Input
Basis for 2017 Forecast
2017
Cash
$20
1%
× 2017 Sales
$22
Accts. rec.
$280
14%
× 2017 Sales
$308
Inventories
$400
20%
× 2017 Sales
$440
Total CA
$700
$770
Net fixed assets
$500
25%
× 2017 Sales
$550
Total assets
$1,200
$1,320
Liabilities and equity
Accts. pay. & accruals
$80
4%
× 2017 Sales
$88
Line of credit
$0
Add LOC if fin. deficit
Total CL
$80
$88
Long-term debt
$500
No Change
$500
Total liabilities
$580
$588
Common stock
$420
No Change
$420
Retained earnings
$200
Old RE + Add. to RE
$253
Total common equity
$620
$673
Total liabs. & equity
$1,200
$1,261
Check: TA − TL & Equ.
$59
percent of Net PP&E. Forecast interest expense on the long-term debt as the product of
the interest rate and the average balance on the long-term debt (i.e., the average of the
beginning value and the ending value). Pay a regular dividend. Leave the special
dividend blank for now.
2016
Input
Basis for 2017 Forecast
2017
Sales
$2,000
110%
× 2016 Sales
$2,20
0
Op. costs (excl. depr.)
$1,800
90%
× 2017 Sales
$1,98
0
Depreciation
$50
10%
× 2017 Net fixed assets
$55
EBIT
$150
$165
Less: Interest on LTD
$40
8%
× Avg bonds
$40
Interest on LOC
$0
8%
× Beginning LOC
$0
Pretax earnings
$110
$125
Taxes (40%)
$44
40%
× Pretax earnings
$50
Net income
$66
$75
Regular common dividends
$20
110%
× 2016 Dividend
$22
Special dividends
$0
Pay if financing surplus
Addition to RE
$46
Net income – Dividends
$53
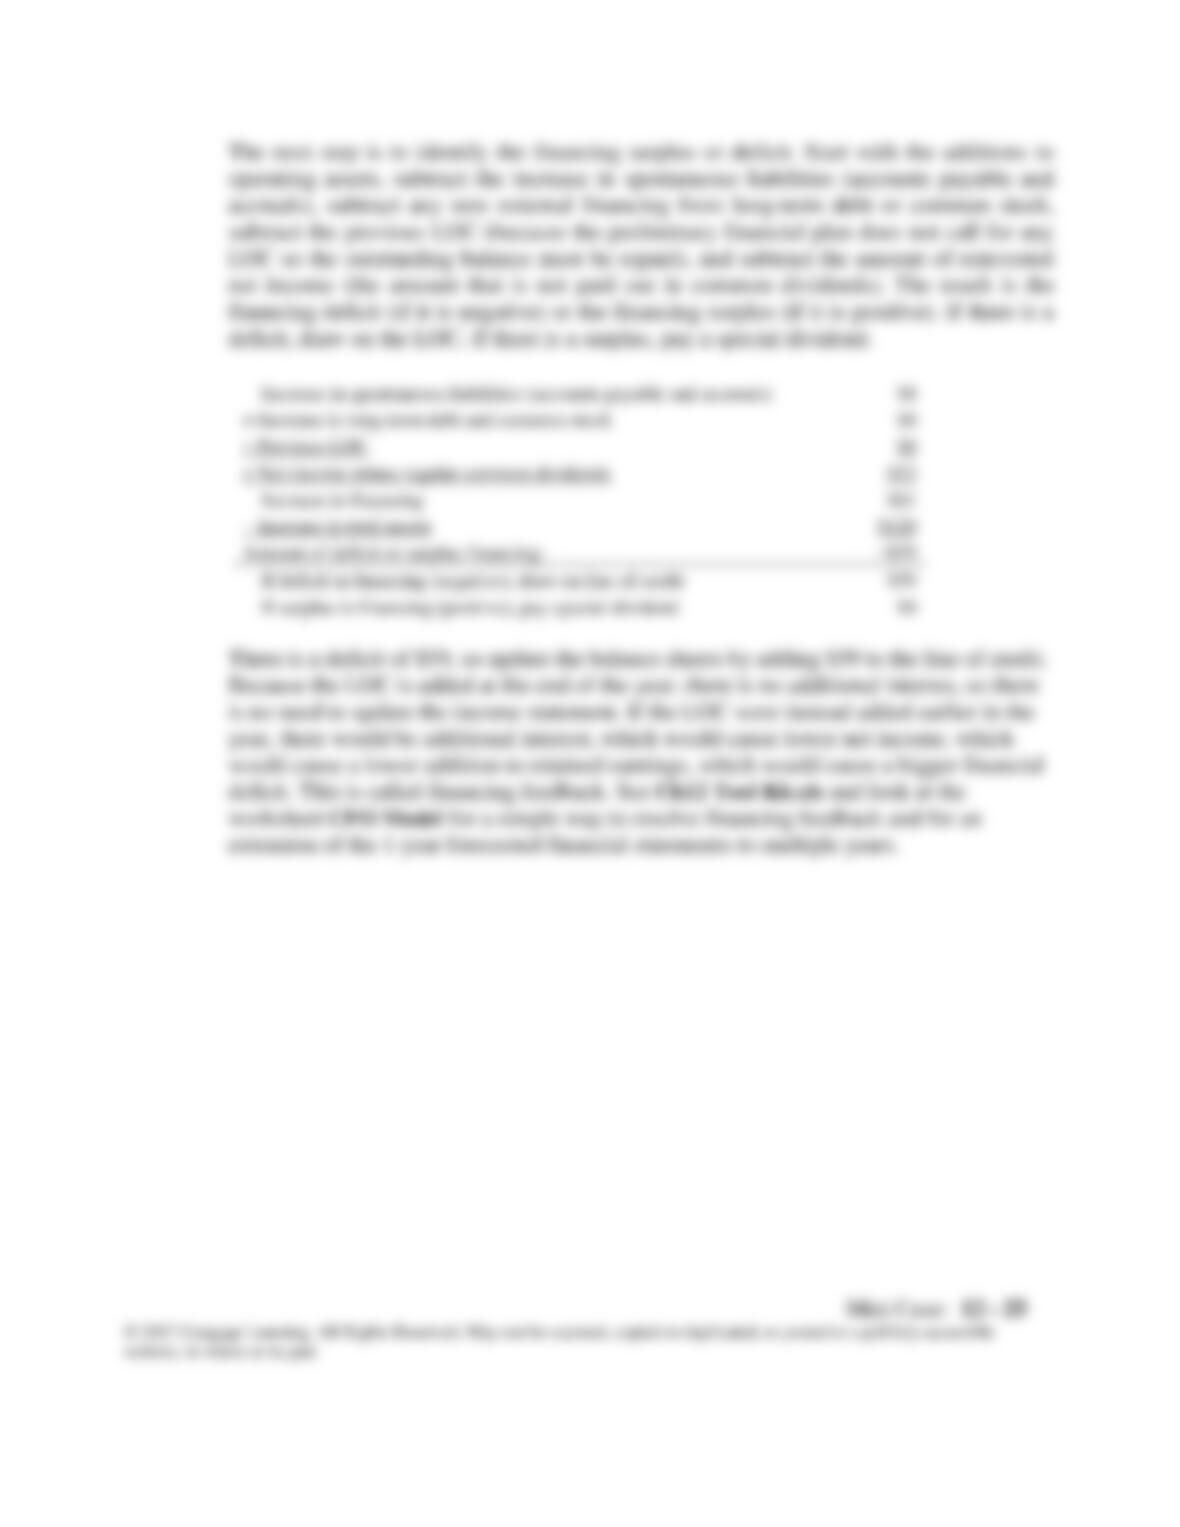
The next step is to identify the financing surplus or deficit. Start with the additions to
operating assets, subtract the increase in spontaneous liabilities (accounts payable and
accruals), subtract any new external financing from long-term debt or common stock,
subtract the previous LOC (because the preliminary financial plan does not call for any
Increase in spontaneous liabilities (accounts payable and accruals)
$8
+ Increase in long-term debt and common stock
$0
− Previous LOC
$0
+ Net income minus regular common dividends
$53
Increase in financing
$61
− Increase in total assets
$120
Amount of deficit or surplus financing:
−$59
If deficit in financing (negative), draw on line of credit
$59
If surplus in financing (positive), pay special dividend
$0
would cause a lower addition to retained earnings, which would cause a bigger financial
deficit. This is called financing feedback. See Ch12 Tool Kit.xls and look at the
worksheet CFO Model for a simple way to resolve financing feedback and for an
extension of the 1-year forecasted financial statements to multiple years.
website, in whole or in part.
Assets
2016
Input
Basis for 2017 Forecast
2016
Cash
$20
1%
× 2017 Sales
$22
Accts. rec.
$280
14%
× 2017 Sales
$308
Inventories
$400
20%
× 2017 Sales
$440
Total CA
$700
$770
Net fixed assets
$500
25%
× 2017 Sales
$550
Total assets
$1,200
$1,320
Liabilities and equity
Accts. pay. & accruals
$80
4%
× 2017 Sales
$88
Line of credit
$0
Add LOC if fin. deficit
$59
Total CL
$80
$147
Long-term debt
$500
No Change
$500
Total liabilities
$580
$647
Common stock
$420
No Change
$420
Retained earnings
$200
Old RE + Add. to RE
$253
Total common equity
$620
$673
Total liabs. & equity
$1,200
$1,320
Check: TA − TL & Equ.
$0
f. 2. What are some alternative ways than those in the preliminary financial policy that
Hatfield might choose to eliminate the financing deficit?
Answer: Here are some alternative ways to eliminate the deficit:
Cut dividends.
g. Repeat the analysis performed the previous question but now assume that Hatfield
is able to improve the following inputs: (1) reduce operating costs (excluding
depreciation)/sales to 89.5% at a cost of $40 million; and (2) reduce
inventories/sales to 16% at a cost of $10 million. This is the Improve scenario.
Answer: The impact on the operating plan is shown below:
Scenario:
Actual
Forecast
Improve
2016
2017
2018
2019
2020
NOPAT
$90
$106
$114
$120
$126
NOWC
$620
$594
$642
$674
$707
Total op. capital
$1,120
$1,144
$1,236
$1,297
$1,362
FCF
$82
$23
$58
$61
Growth in FCF
–72%
157.3%
5.0%
ROIC
8.0%
9.2%
9.2%
9.2%
9.2%
Scenario:
Improve
Horizon Value:
Value of operations
$1,314
+ ST investments
$0
=
$1,598
Estimated total intrinsic value
$1,314
− All debt
$500
Value of Operations:
− Preferred stock
$0
Present value of HV
$1,132
Estimated intrinsic value of equity
$814
+ Present value of FCF
$182
÷ Number of shares
10
Value of operations =
$1,314
Estimated intrinsic stock price =
$81.37
HV = 9+gL
WACC − gL
website, in whole or in part.
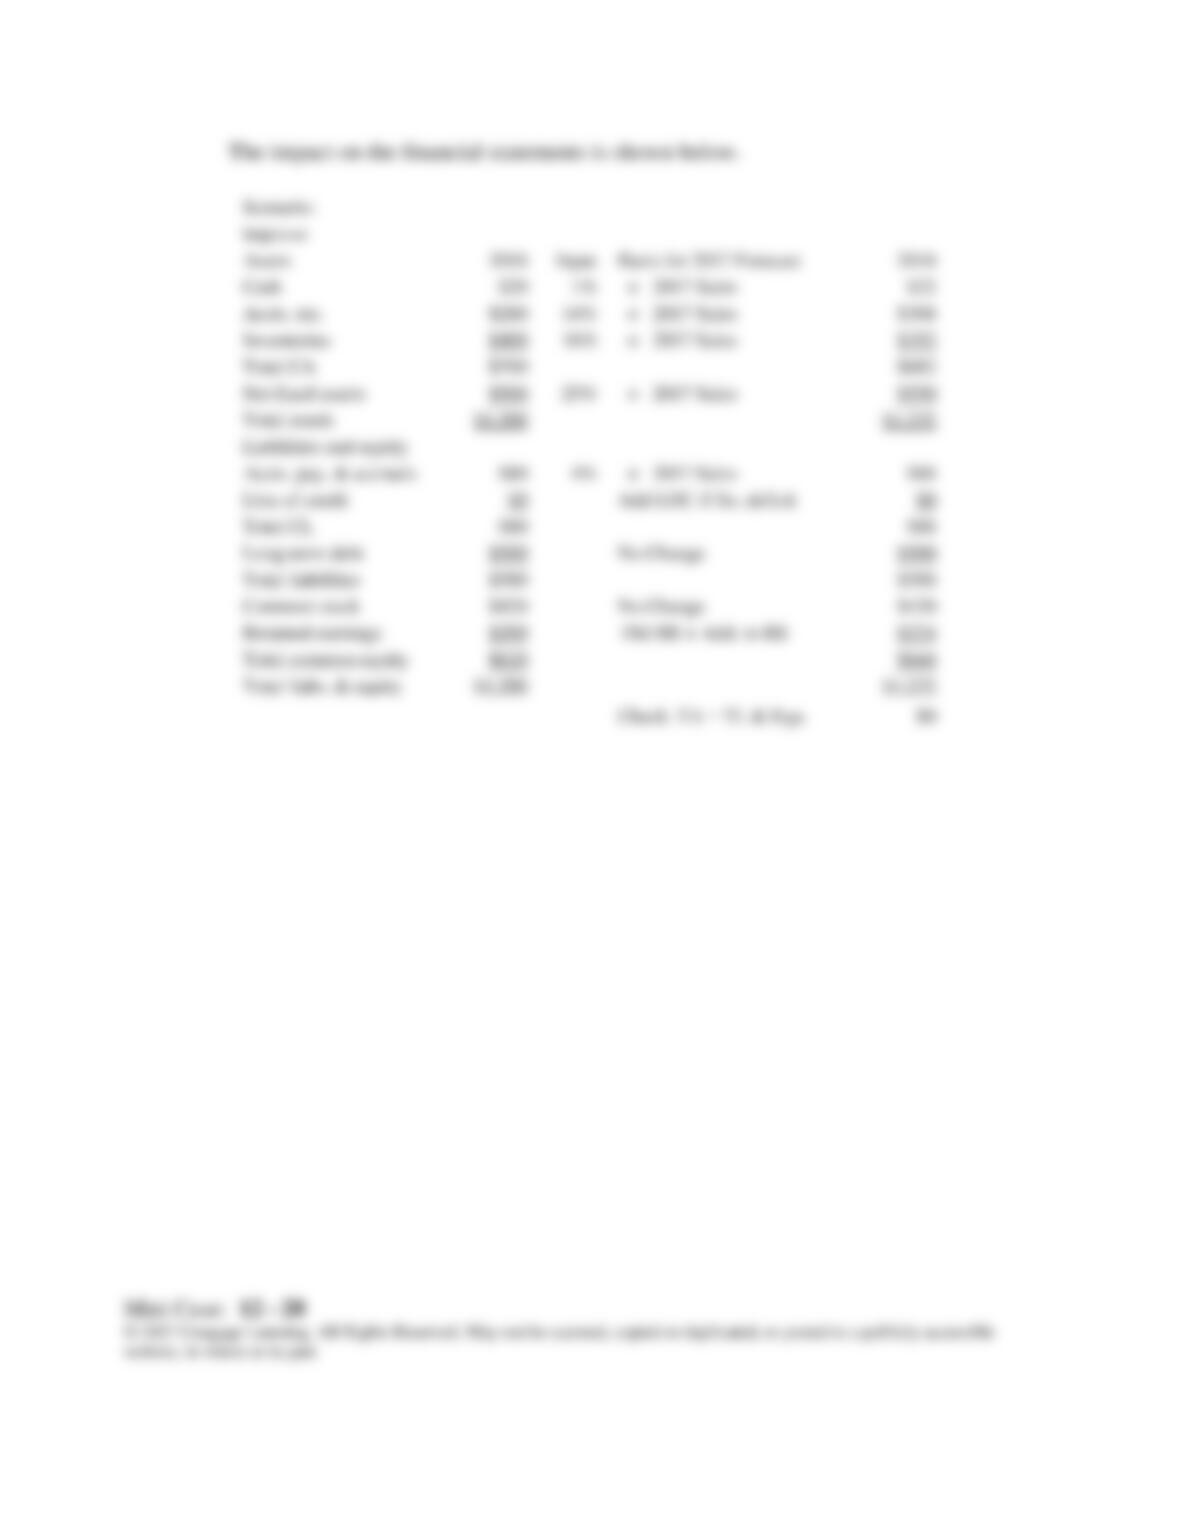
The impact on the financial statements is shown below.
Scenario:
Improve
Assets
2016
Input
Basis for 2017 Forecast
2016
Cash
$20
1%
× 2017 Sales
$22
Accts. rec.
$280
14%
× 2017 Sales
$308
Inventories
$400
16%
× 2017 Sales
$352
Total CA
$700
$682
Net fixed assets
$500
25%
× 2017 Sales
$550
Total assets
$1,200
$1,232
Liabilities and equity
Accts. pay. & accruals
$80
4%
× 2017 Sales
$88
Line of credit
$0
Add LOC if fin. deficit
$0
Total CL
$80
$88
Long-term debt
$500
No Change
$500
Total liabilities
$580
$588
Common stock
$420
No Change
$420
Retained earnings
$200
Old RE + Add. to RE
$224
Total common equity
$620
$644
Total liabs. & equity
$1,200
$1,232
Check: TA − TL & Equ.
$0
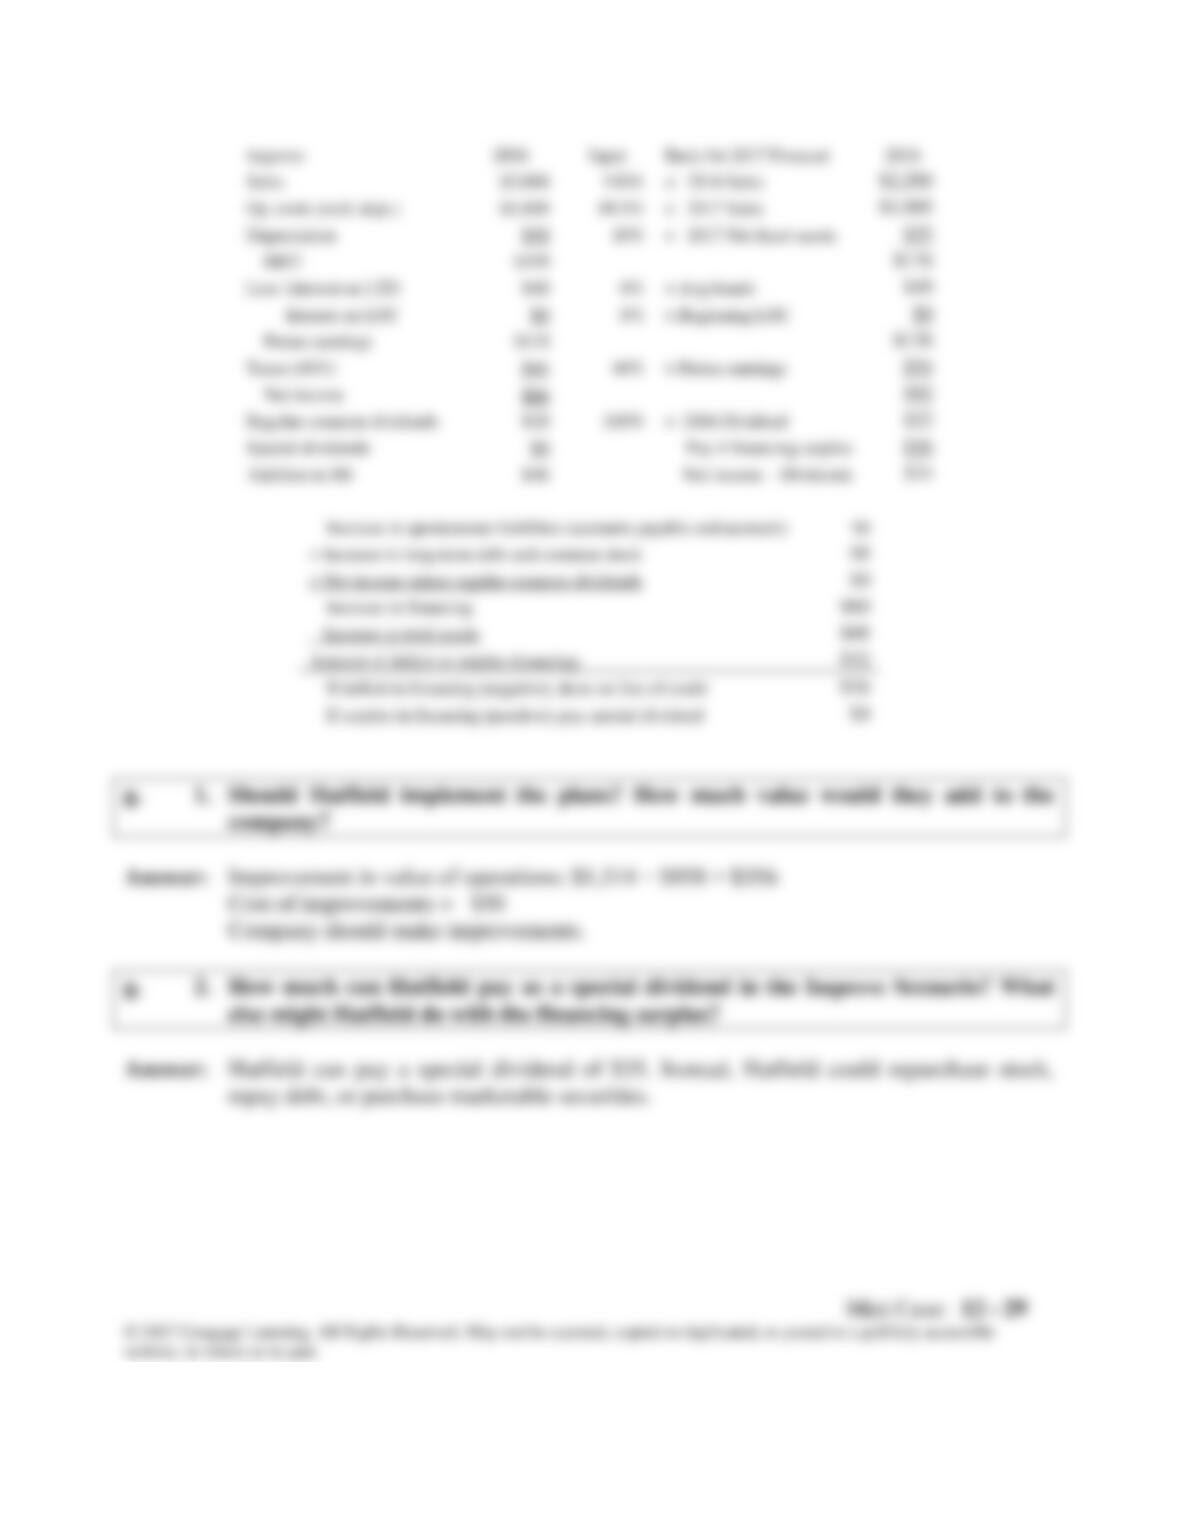
Improve
2016
Input
Basis for 2017 Forecast
2016
Sales
$2,000
110%
× 2016 Sales
$2,200
Op. costs (excl. depr.)
$1,800
89.5%
× 2017 Sales
$1,969
Depreciation
$50
10%
× 2017 Net fixed assets
$55
EBIT
$150
$176
Less: Interest on LTD
$40
8%
× Avg bonds
$40
Interest on LOC
$0
8%
× Beginning LOC
$0
Pretax earnings
$110
$136
Taxes (40%)
$44
40%
× Pretax earnings
$54
Net income
$66
$82
Regular common dividends
$20
110%
× 2016 Dividend
$22
Special dividends
$0
Pay if financing surplus
$36
Addition to RE
$46
Net income – Dividends
$24
Increase in spontaneous liabilities (accounts payable and accruals)
$8
+ Increase in long-term debt and common stock
$8
+ Net income minus regular common dividends
$0
Increase in financing
$60
− Increase in total assets
$68
Amount of deficit or surplus financing:
$32
If deficit in financing (negative), draw on line of credit
$36
If surplus in financing (positive), pay special dividend
$0
g. 1. Should Hatfield implement the plans? How much value would they add to the
company?
g. 2. How much can Hatfield pay as a special dividend in the Improve Scenario? What
else might Hatfield do with the financing surplus?