Answers and Solutions: 12 – 11
expense will be higher than in the projections of part a. This would cause net income to
be lower, the addition to retained earnings to be higher, and the AFN to be higher. Thus,
you would have to add more than $2,128 in new debt. This is called the financing
feedback effect.
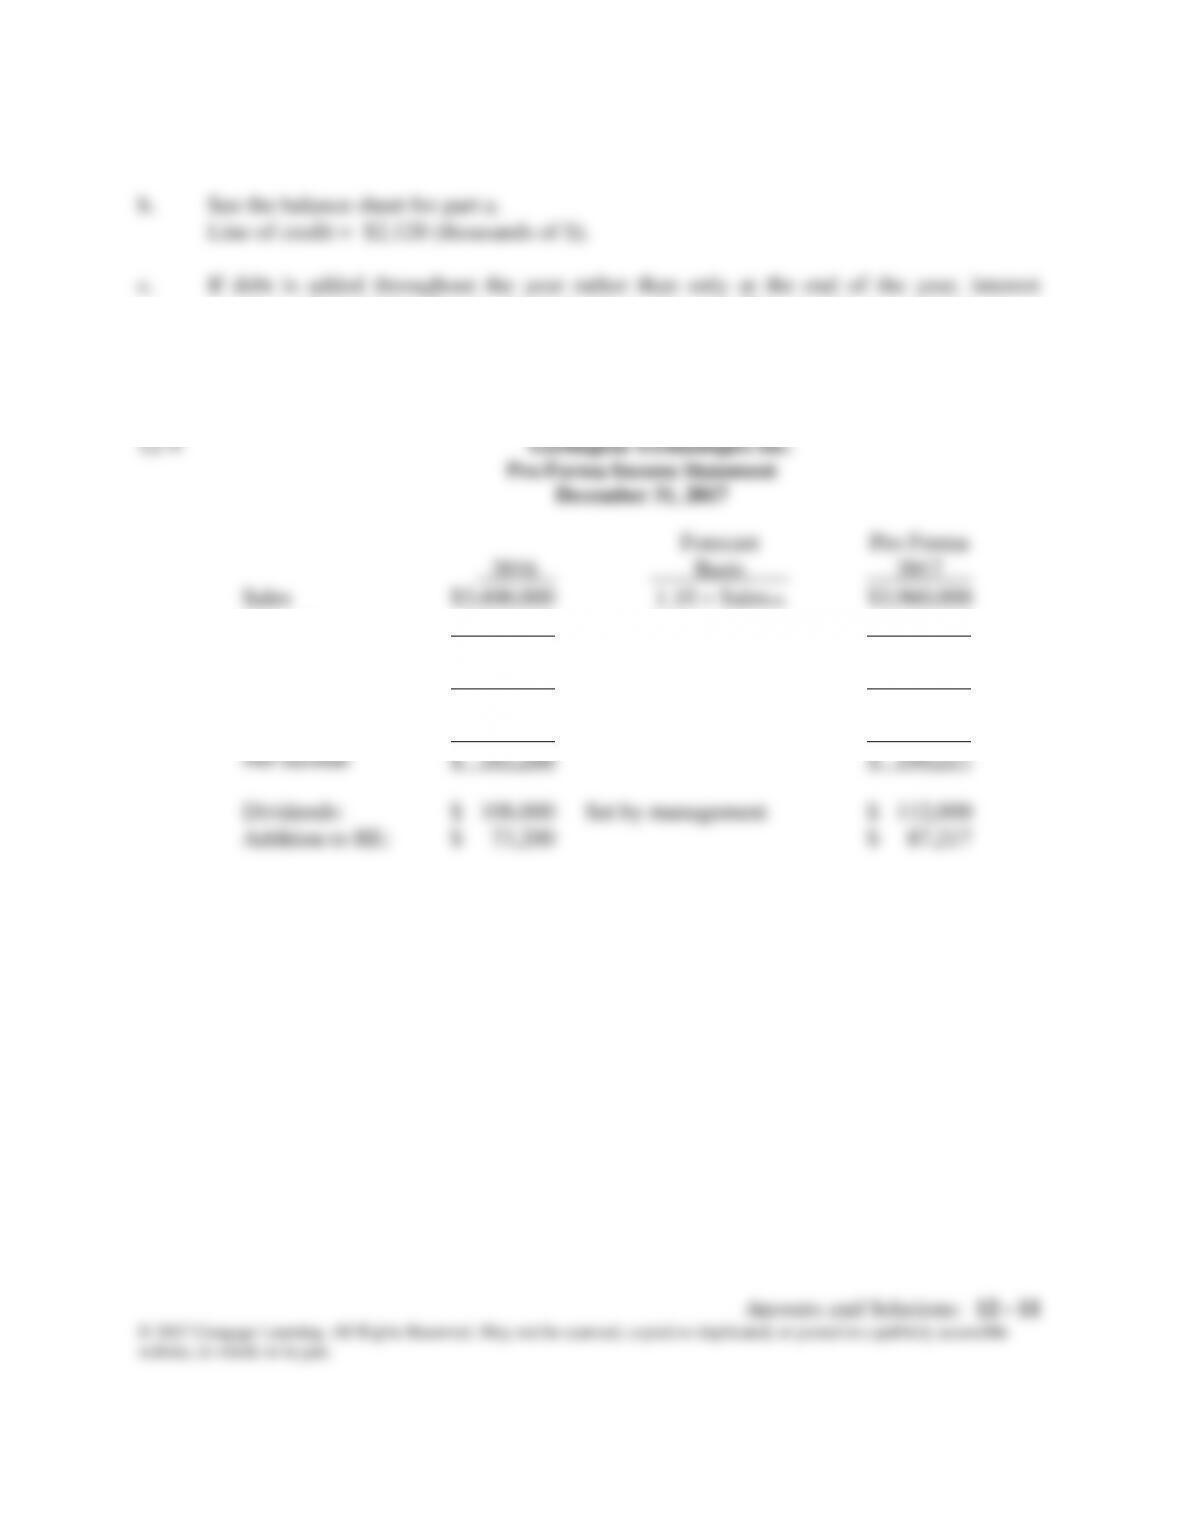
Operating costs 3,279,720 0.911 Sales17 3,607,692
EBIT $ 320,280 $ 352,308
Interest 18,280 0.13 × Debt16 20,280
EBT $ 302,000 $ 332,028
Taxes (40%) 120,800 132,811
Answers and Solutions: 12 – 12
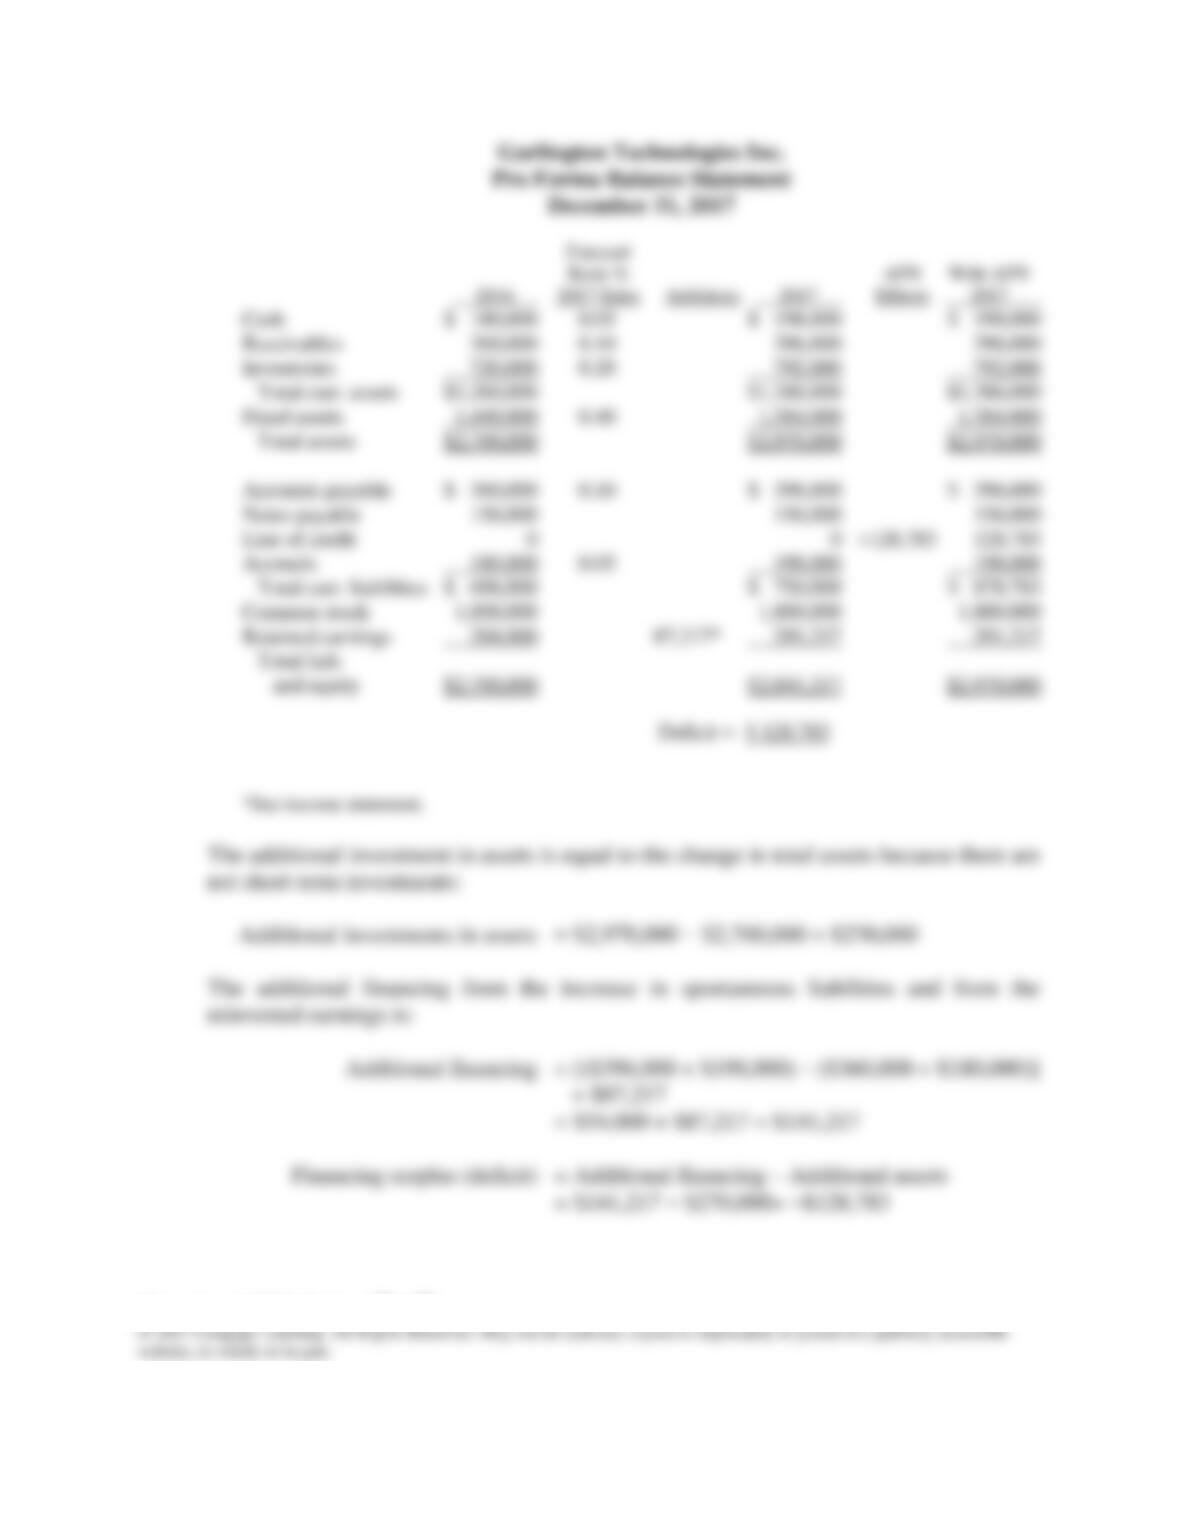
Garlington Technologies Inc.
Receivables 360,000 0.10 396,000 396,000
Inventories 720,000 0.20 792,000 792,000
Total curr. assets $1,260,000 $1,386,000 $1,386,000
Fixed assets 1,440,000 0.40 1,584,000 1,584,000
Total assets $2,700,000 $2,970,000 $2,970,000
Common stock 1,800,000 1,800,000 1,800,000
Retained earnings 204,000 87,217* 291,217 291,217
Total liab.
and equity $2,700,000 $2,841,217 $2,970,000
Additional investments in assets = $2,970,000 − $2,700,000 = $270,000
The additional financing from the increase in spontaneous liabilities and from the
reinvested earnings is:
= $141,217 − $270,000= −$128,783

Answers and Solutions: 12 – 13
© 2017 Cengage Learning. All Rights Reserved. May not be scanned, copied or duplicated, or posted to a publicly accessible
website, in whole or in part.
Because this is negative, it is a financing deficit. This means the LOC should be
$128,783.
Answers and Solutions: 12 – 14
12-11 The detailed solution for is available in the file Ch12 P11 Build a Model Solution.xlsx at
the textbook’s Web site.
website, in whole or in part.
MINI CASE
Hatfield Medical Supply’s stock price had been lagging its industry averages, so its
board of directors brought in a new CEO, Jaiden Lee. Lee had brought in Ashley Novak, a
finance MBA who had been working for a consulting company, to replace the old CFO, and
Lee asked Ashley to develop the financial planning section of the strategic plan. In her
previous job, Novak’s primary task had been to help clients develop financial forecasts, and
that was one reason Lee hired her.
Novak began as she always did, by comparing Hatfield’s financial ratios to the
industry averages. If any ratio was substandard, she discussed it with the responsible manager
to see what could be done to improve the situation. The following data shows Hatfield’s latest
financial statements plus some ratios and other data that Novak plans to use in her analysis.
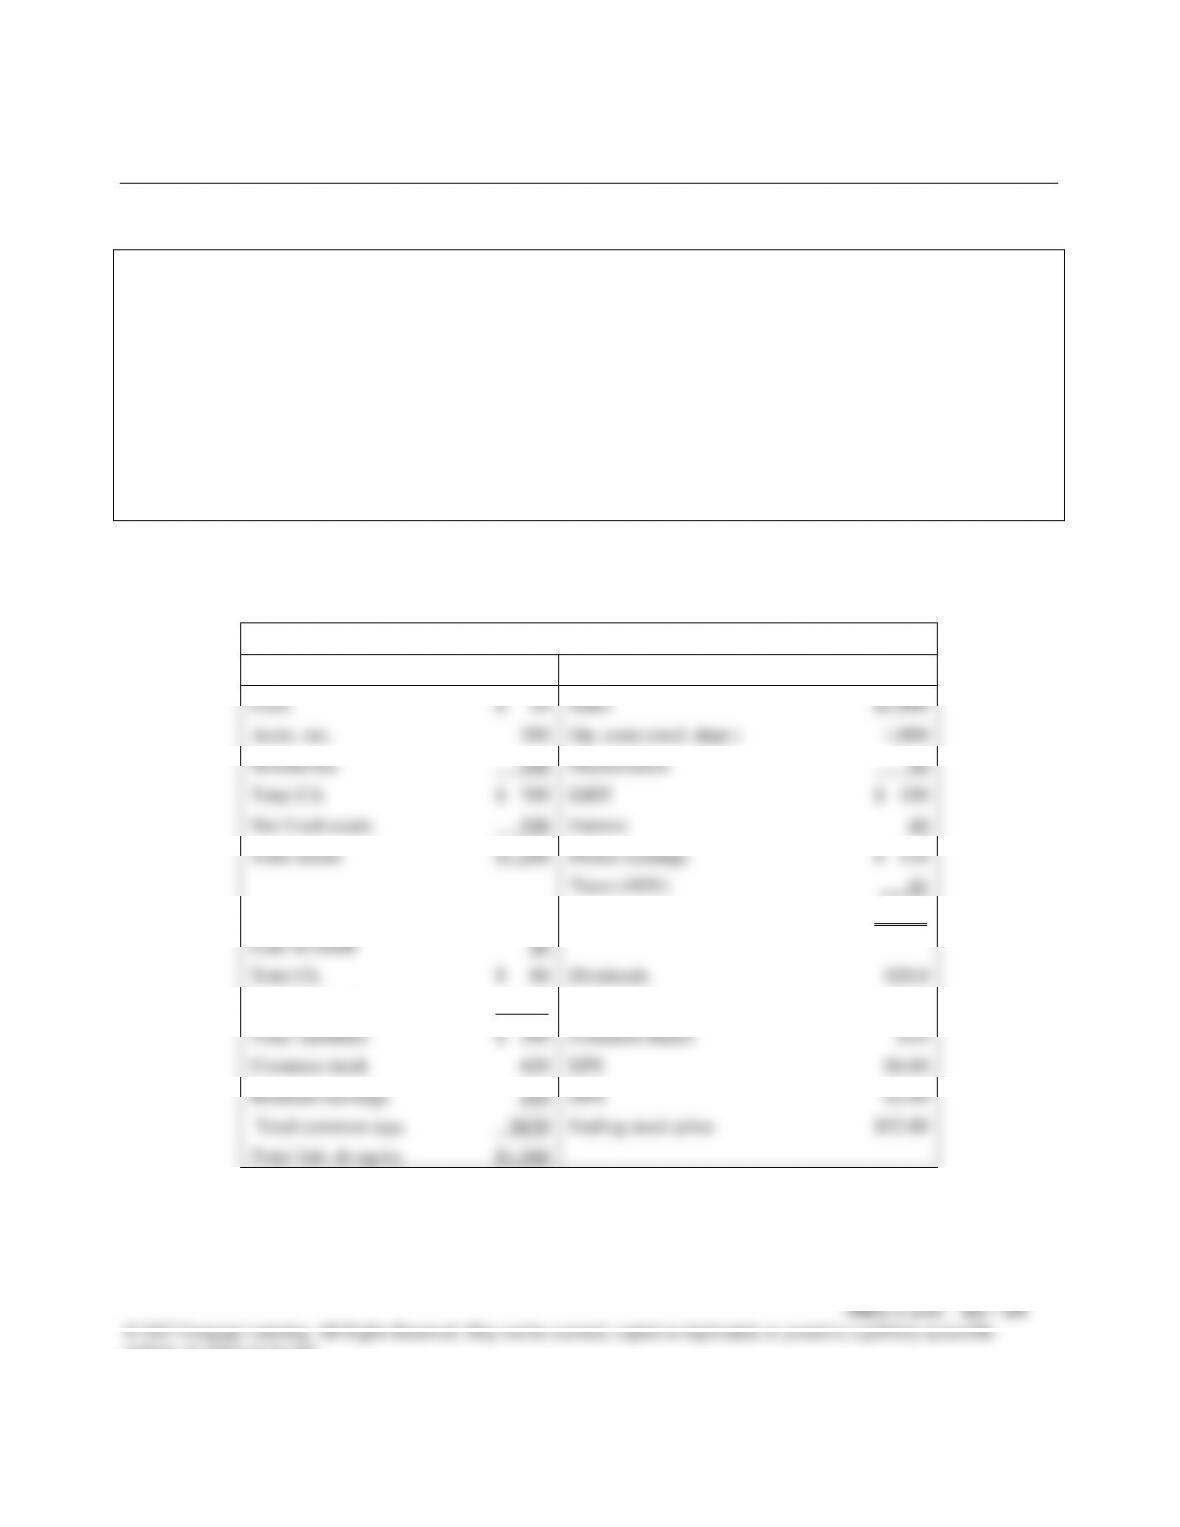
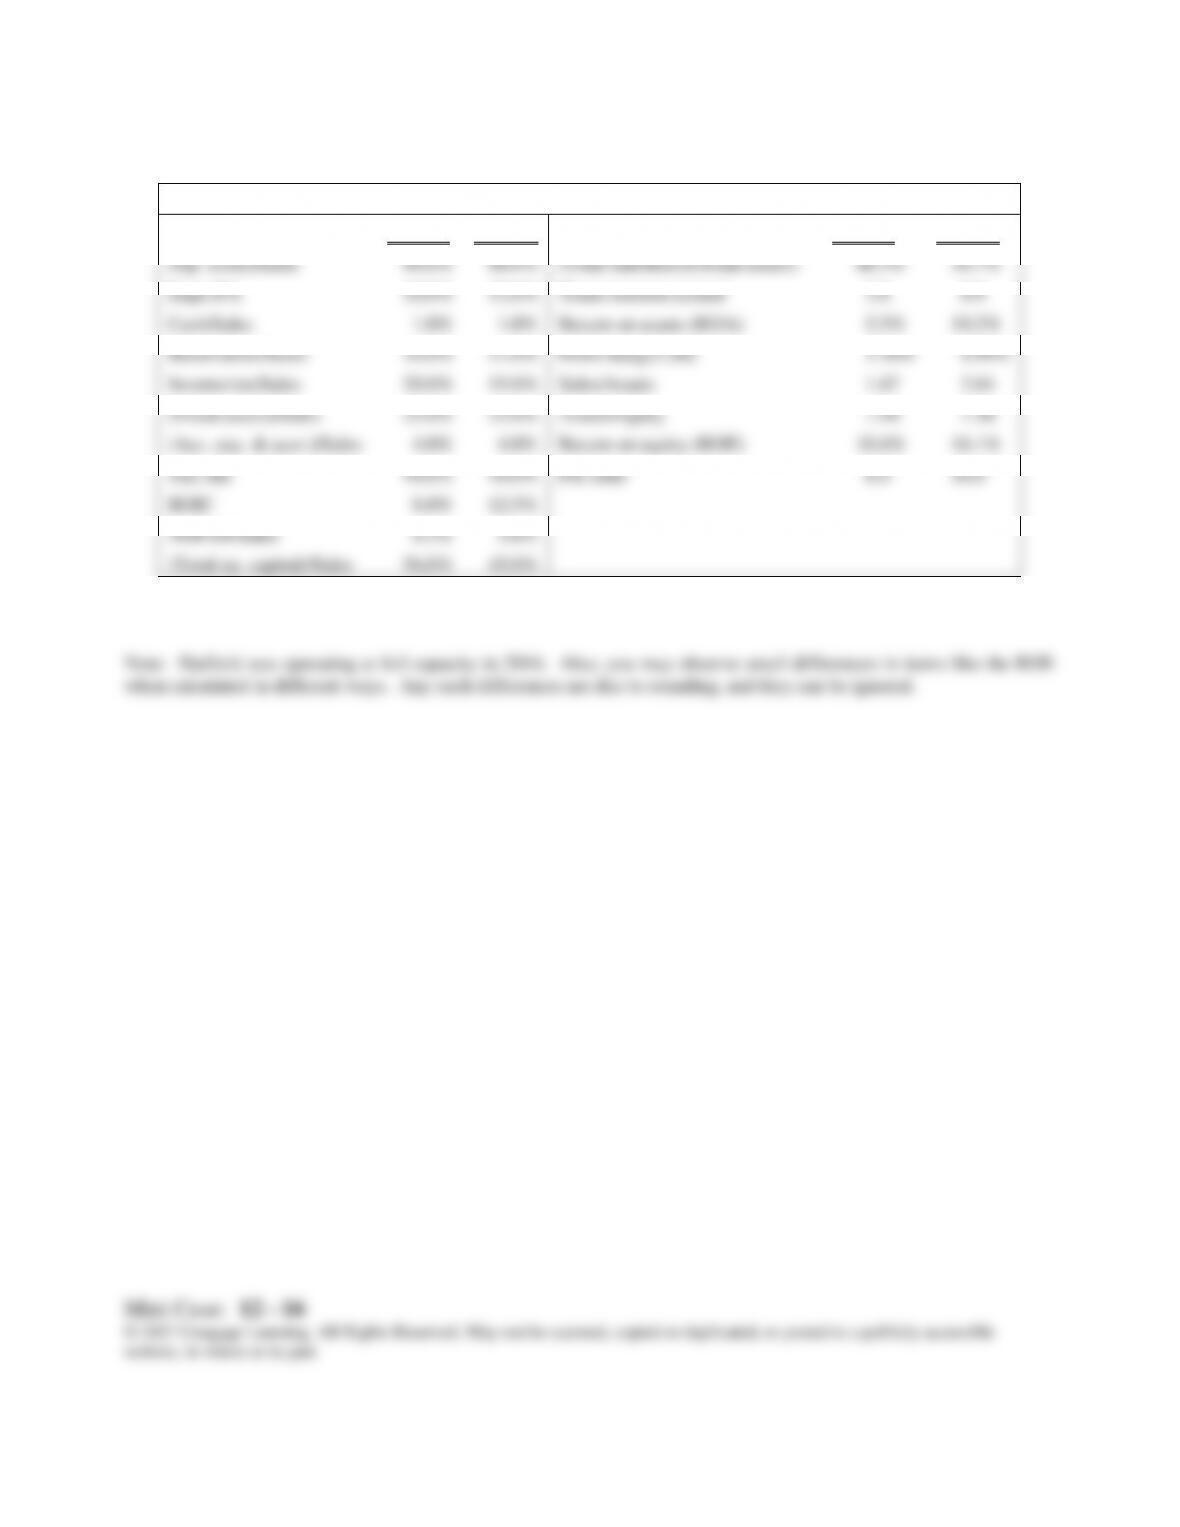
Hatfield Medical Supply (Millions of Dollars Except Per Share Data)
Balance Sheet, 12/31/2016
Income Statement, Year Ending 2016
Cash
$ 20
Sales
$2,000
Accts. rec.
280
Op. costs (excl. depr.)
1,800
Inventories
400
Depreciation
50
Total CA
$ 700
EBIT
$ 150
Net fixed assets
500
Interest
40
Total assets
$1,200
Pretax earnings
$ 110
Taxes (40%)
44
Accts. pay. & accruals
$ 80
Net income
$ 66
Line of credit
$0
Total CL
$ 80
Dividends
$20.0
Long-term debt
500
Add. to RE
$46.0
Total liabilities
$ 580
Common shares
10.0
Common stock
420
EPS
$6.60
Retained earnings
200
DPS
$2.00
Total common equ.
$620
Ending stock price
$52.80
Total liab. & equity
$1,200
Mini Case: 12 – 16
© 2017 Cengage Learning. All Rights Reserved. May not be scanned, copied or duplicated, or posted to a publicly accessible
website, in whole or in part.
Selected Additional Data for 2016
Hatfield
Industry
Hatfield
Industry
(Op. costs)/Sales
90.0%
88.0%
(Total liabilities)/(Total assets)
48.3%
36.7%
Depr./FA
10.0%
12.0%
Times interest earned
3.8
8.9
Cash/Sales
1.0%
1.0%
Return on assets (ROA)
5.5%
10.2%
Receivables/Sales
14.0%
11.0%
Profit margin (M)
3.30%
4.99%
Inventories/Sales
20.0%
15.0%
Sales/Assets
1.67
2.04
(Fixed assets)/Sales
25.0%
22.0%
Assets/Equity
1.94
1.56
(Acc. pay. & accr.)/Sales
4.0%
4.0%
Return on equity (ROE)
10.6%
16.1%
Tax rate
40.0%
40.0%
P/E ratio
8.0
16.0
ROIC
8.0%
12.5%
NOPAT/Sales
4.5%
5.6%
(Total op. capital)/Sales
56.0%
45.0%
Mini Case: 12 – 17
a. Using Hatfield’s data and its industry averages, how well run would you say
Hatfield appears to be in comparison with other firms in its industry? What are its
primary strengths and weaknesses? Be specific in your answer, and point to various
ratios that support your position. Also, use the DuPont equation (see Chapter 3) as
one part of your analysis.
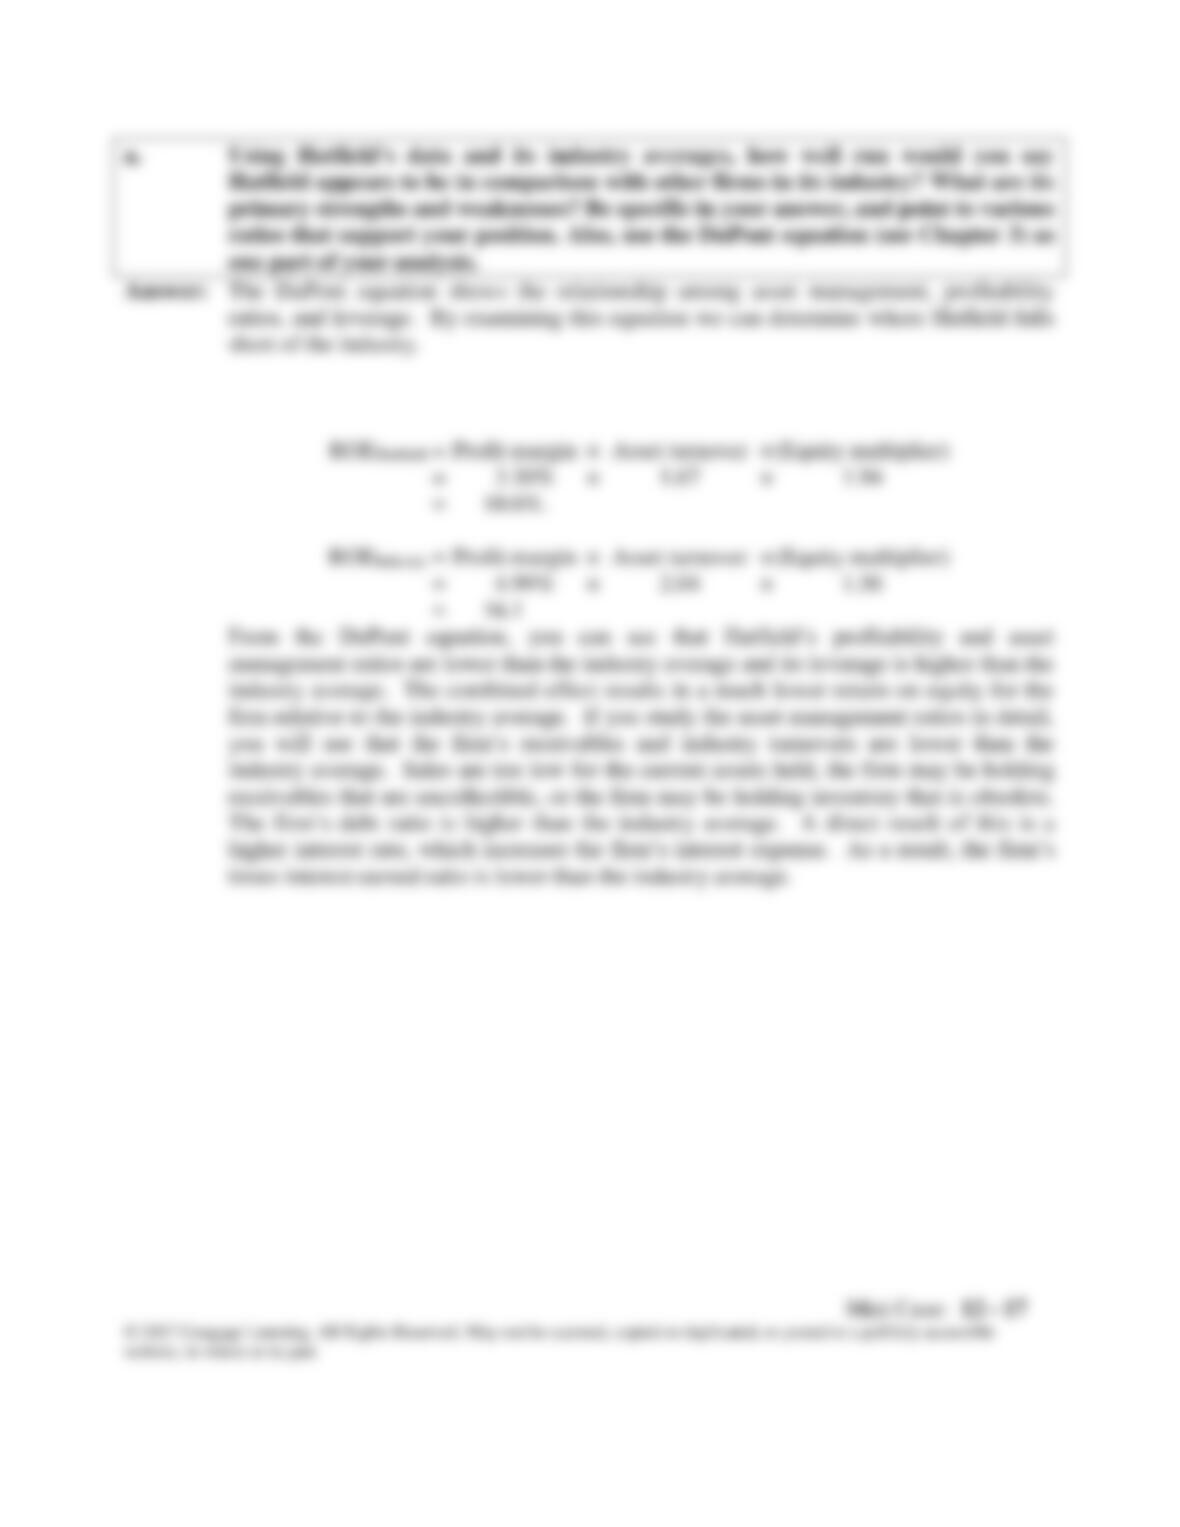
Answer: The DuPont equation shows the relationship among asset management, profitability
ratios, and leverage. By examining this equation we can determine where Hatfield falls
short of the industry.
ROEHatfield = Profit margin × Asset turnover × (Equity multiplier)
management ratios are lower than the industry average and its leverage is higher than the
industry average. The combined effect results in a much lower return on equity for the
firm relative to the industry average. If you study the asset management ratios in detail,
you will see that the firm’s receivables and industry turnovers are lower than the
industry average. Sales are too low for the current assets held, the firm may be holding
b. Use the AFN equation to estimate Hatfield’s required new external capital for 2017
if the sales growth rate is 10%. Assume that the firm’s 2016 ratios will remain the
same in 2017. (Hint: Hatfield was operating at full capacity in 2016.)
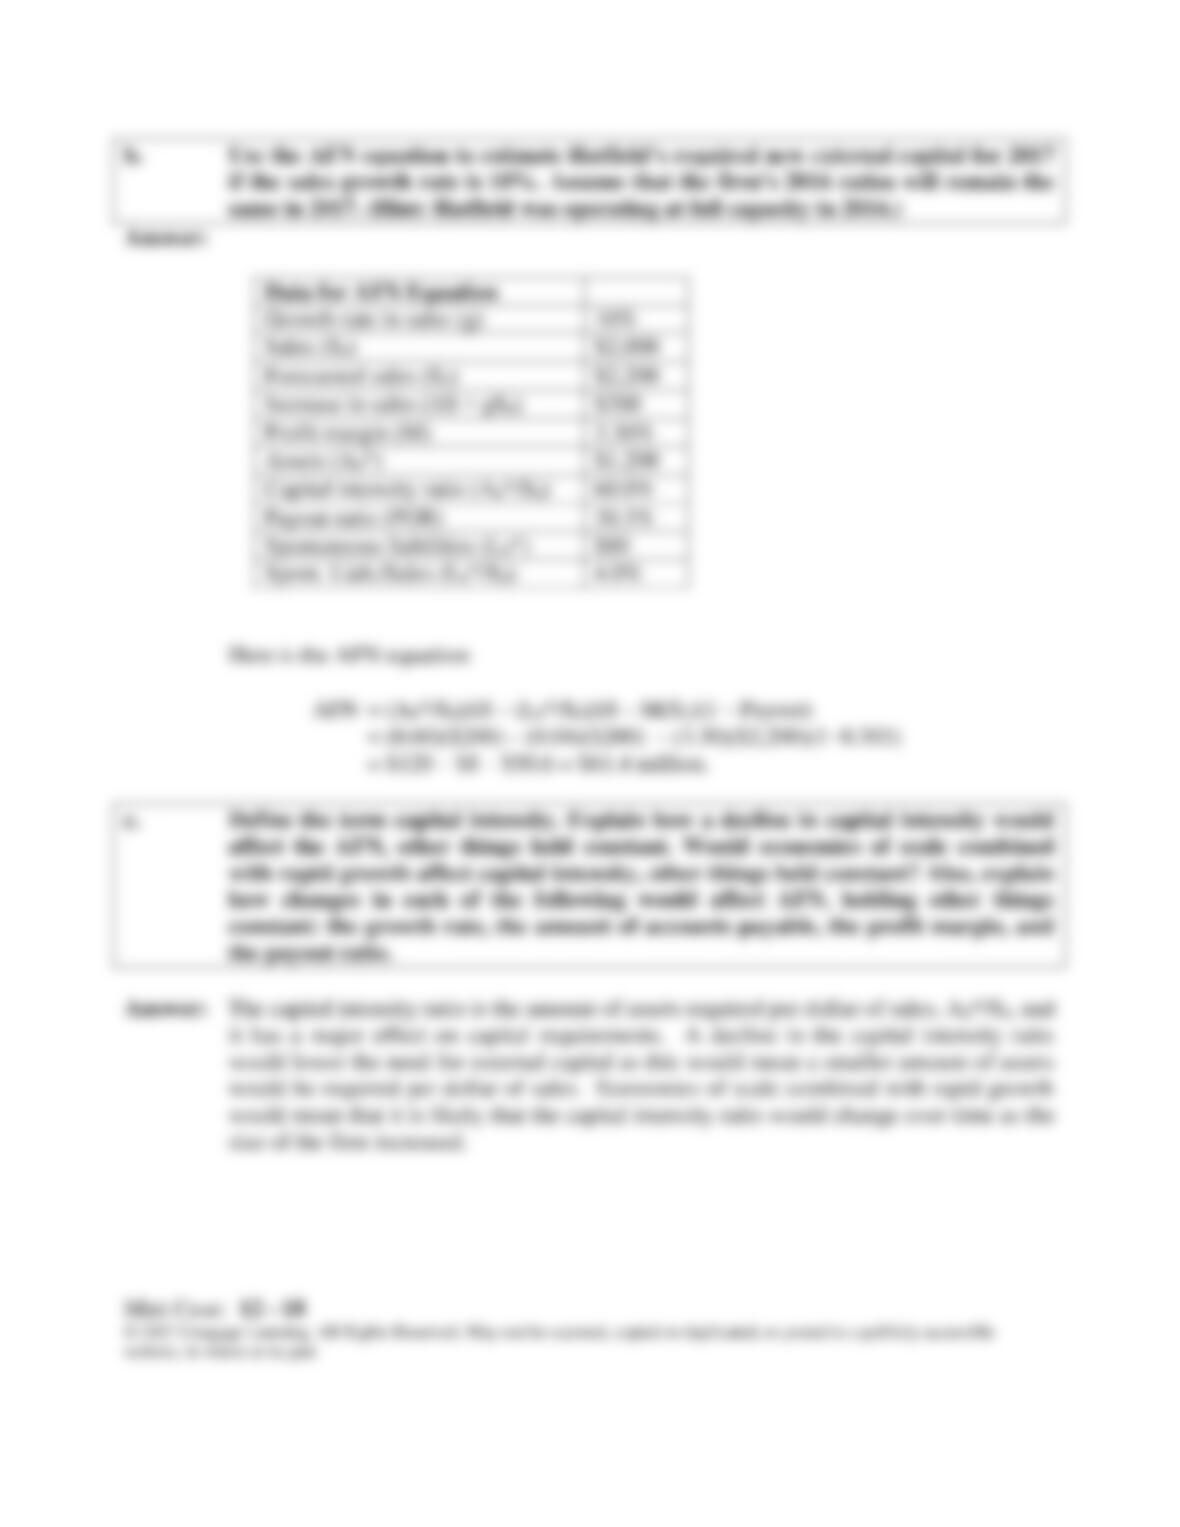
Answer:
Data for AFN Equation
Growth rate in sales (g)
10%
Sales (S0)
$2,000
Forecasted sales (S1)
$2,200
Increase in sales (ΔS = gS0)
$200
Profit margin (M)
3.30%
Assets (A0*)
$1,200
Capital intensity ratio (A0*/S0)
60.0%
Payout ratio (POR)
30.3%
Spontaneous liabilities (L0*)
$80
Spont. Liab./Sales (L0*/S0)
4.0%
AFN = (A0*/S0)∆S – (L0*/S0)∆S – M(S1)(1 – Payout)
c. Define the term capital intensity. Explain how a decline in capital intensity would
affect the AFN, other things held constant. Would economies of scale combined
with rapid growth affect capital intensity, other things held constant? Also, explain
how changes in each of the following would affect AFN, holding other things
constant: the growth rate, the amount of accounts payable, the profit margin, and
the payout ratio.
Answer: The capital intensity ratio is the amount of assets required per dollar of sales, A0*/S0, and
website, in whole or in part.
Rapidly growing companies require large increases in assets and a corresponding
large amount of external financing, other things held constant. Accounts payable are
spontaneous liabilities that come about due to normal day-to-day business operations.
Firms don’t have a lot of control over the level of spontaneous liabilities as they’re a
function of industry norm and tax laws. The higher the firm’s level of accounts payable
d. Define the term self-supporting growth rate. What is Hatfield’s self-supporting
growth rate? Would the self-supporting growth rate be affected by a change in the
capital intensity ratio or the other factors mentioned in the previous question?
Other things held constant, would the calculated capital intensity ratio change over
time if the company were growing and were also subject to economies of scale
and/or lumpy assets?
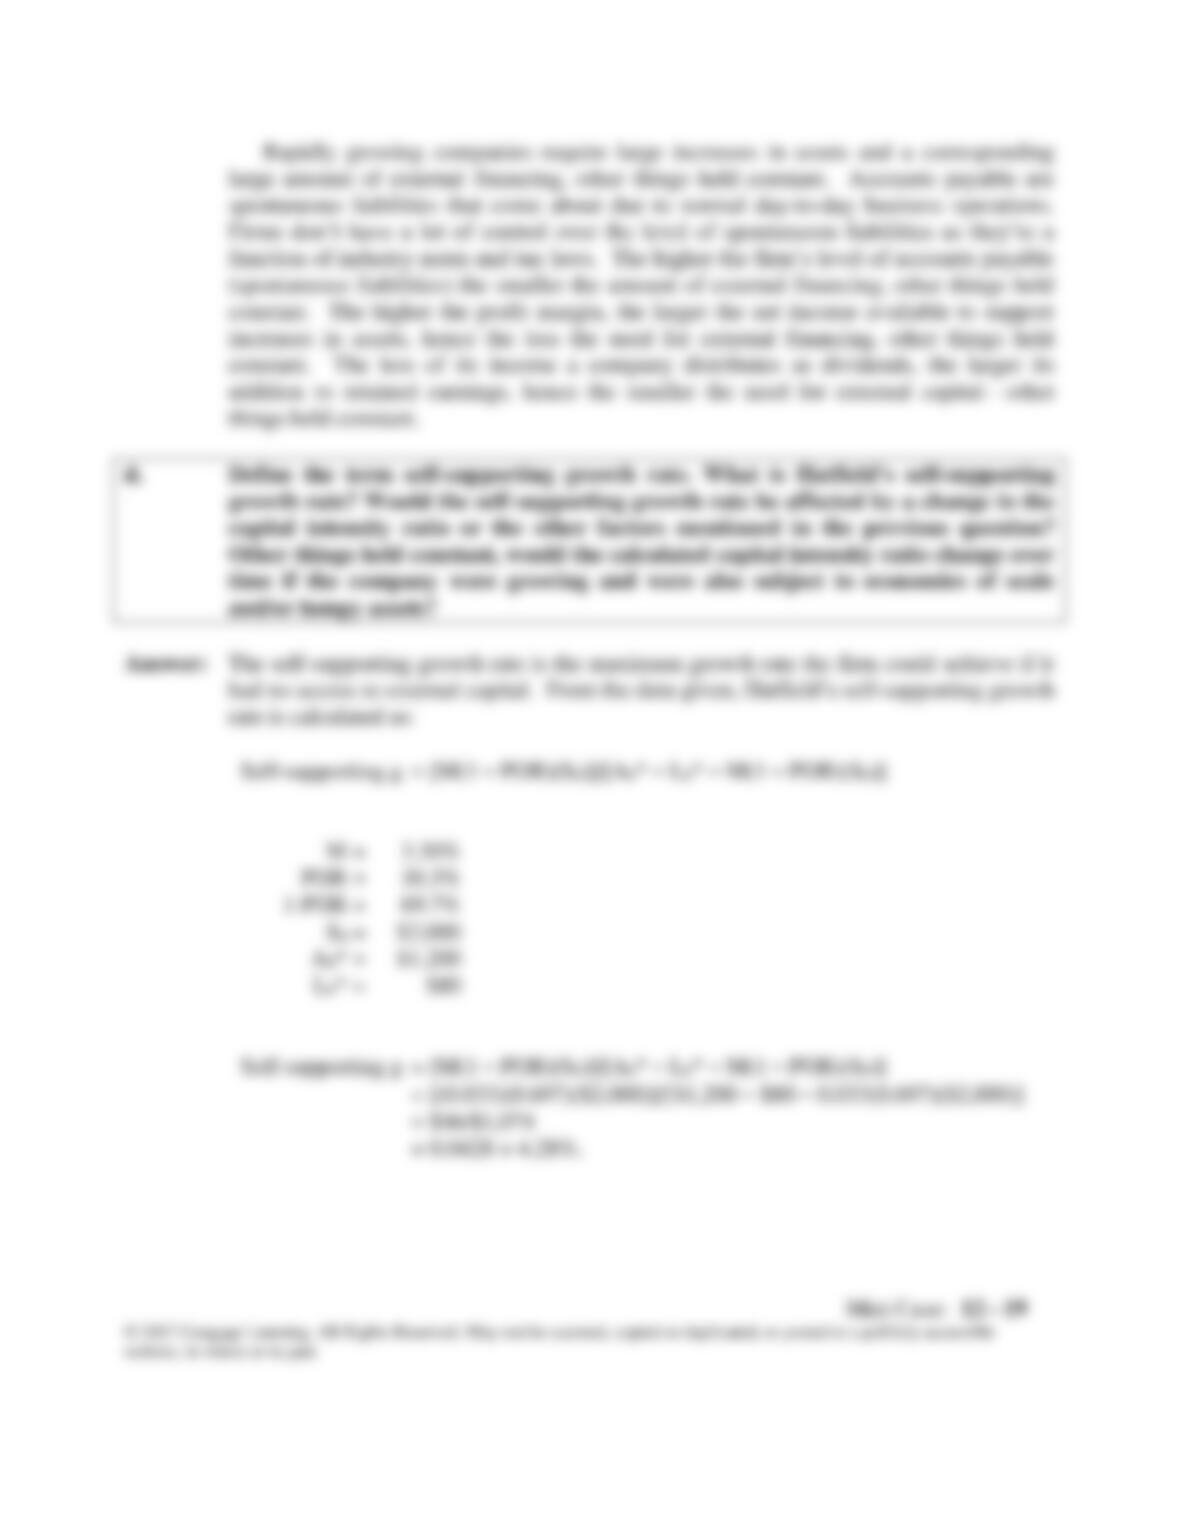
Answer: The self-supporting growth rate is the maximum growth rate the firm could achieve if it
had no access to external capital. From the data given, Hatfield’s self-supporting growth
rate is calculated as:
M =
3.30%
POR =
30.3%
1-POR =
69.7%
S0 =
$2,000
A0* =
$1,200
L0* =
$80
Mini Case: 12 – 20
The higher the firm’s capital intensity ratio, the lower the firm’s self-supporting growth
industries, technological considerations dictate that if a firm is to be competitive, it must
add fixed assets in large, discrete units. These assets are referred to as lumpy assets.
When this occurs the firm’s capital intensity ratio will change. So, at the point where the
assets must increase in a large amount, the capital intensity ratio will be high, so required
external financing will be high. As sales increase but assets don’t need to increase, the
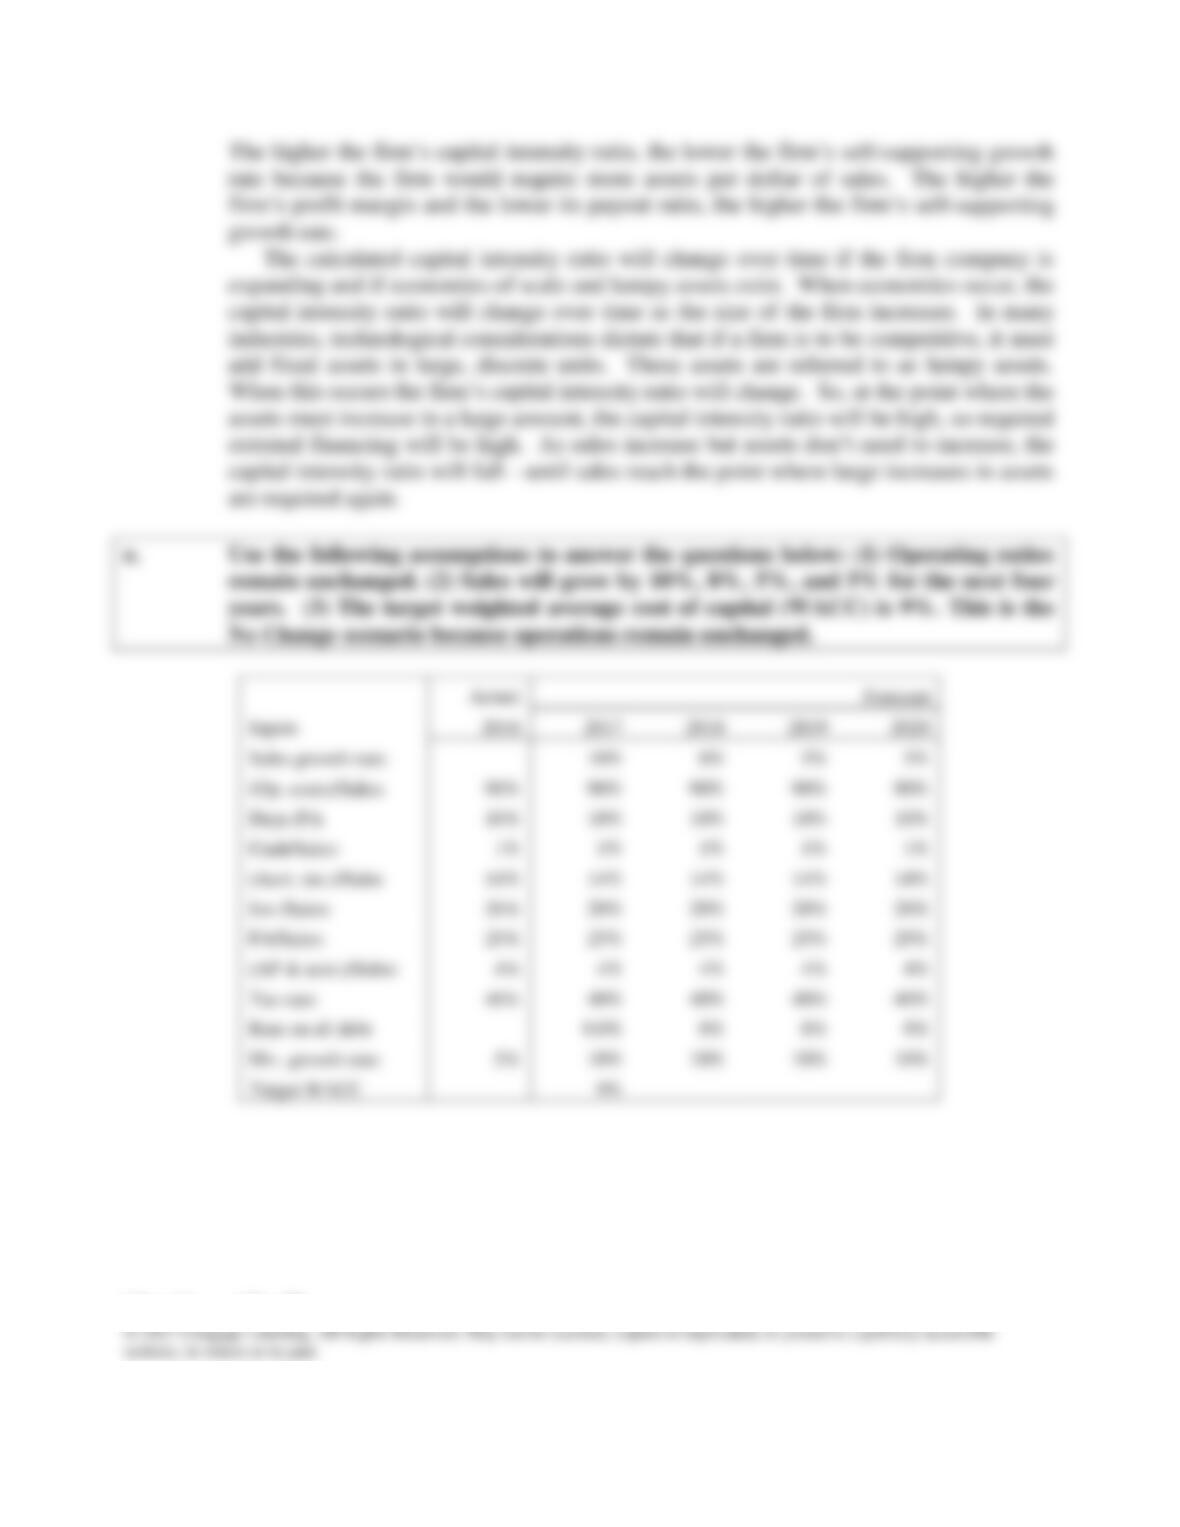
No Change scenario because operations remain unchanged.
Actual
Forecast
Inputs
2016
2017
2018
2019
2020
Sales growth rate:
10%
8%
5%
5%
(Op. costs)/Sales:
90%
90%
90%
90%
90%
Depr./FA
10%
10%
10%
10%
10%
Cash/Sales:
1%
1%
1%
1%
1%
(Acct. rec.)/Sales
14%
14%
14%
14%
14%
Inv./Sales:
20%
20%
20%
20%
20%
FA/Sales:
25%
25%
25%
25%
25%
(AP & accr.)/Sales:
4%
4%
4%
4%
4%
Tax rate:
40%
40%
40%
40%
40%
Rate on all debt
8.0%
8%
8%
8%
Div. growth rate:
5%
10%
10%
10%
10%
Target WACC
9%