Unlock document.
This document is partially blurred.
Unlock all pages and 1 million more documents.
Get Access
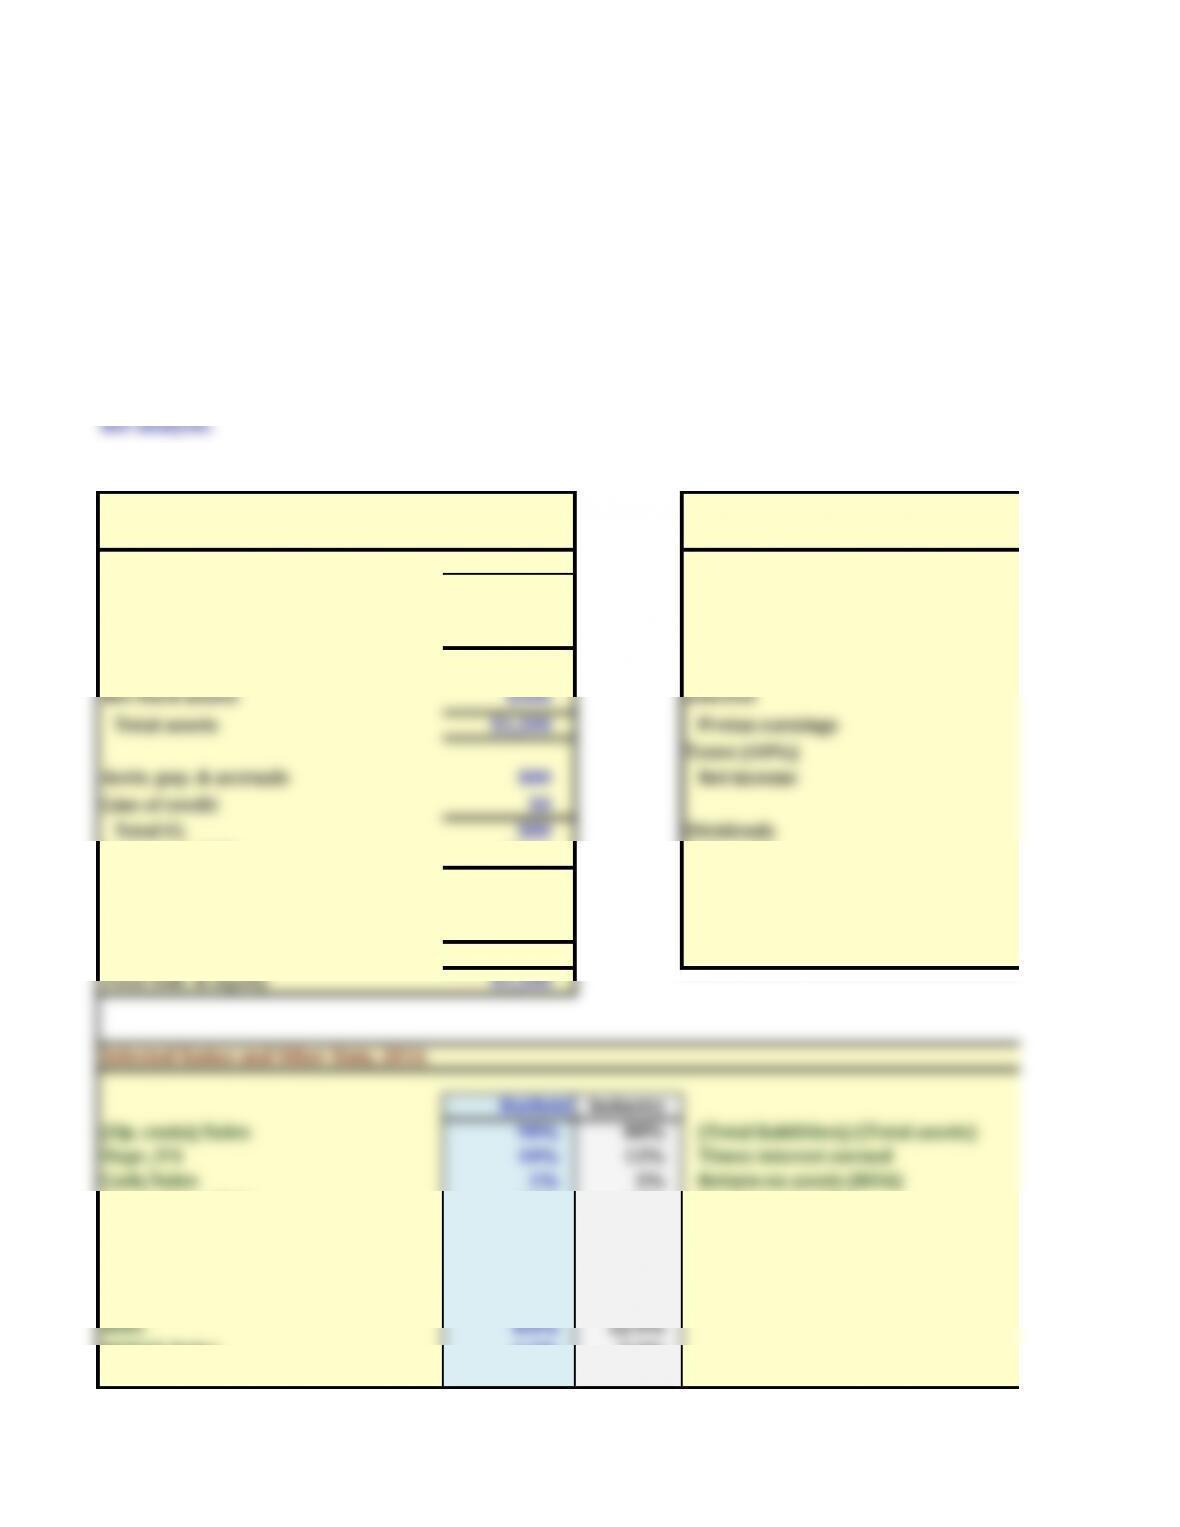
2016
Cash $20 Sales
Accts. rec. $280 Op. costs (excl. depr.)
Inventories $400 Depreciation
Total CA $700 EBIT
Net fixed assets $500 Interest
Total assets $1,200 Pretax earnings
Taxes (40%)
Accts. pay. & accruals $80 Net income
Total CL $80 Dividends
Long-term debt $500 Add. to RE
Total liabilities $580 Common shares
Common stock $420 EPS
Retained earnings $200 DPS
Total common equ. $620 Ending stock price
Total liab. & equity $1,200
Selected Ratios and Other Data, 2016
Hatfield Industry
(Op. costs)/Sales 90% 88% (Total liabilities)/(Total assets)
Depr./FA 10% 12% Times interest earned
Cash/Sales 1% 1% Return on assets (ROA)
Receivables/Sales 14% 11% Profit margin (M)
Inventories/Sales 20% 15% Sales/Assets
Fixed assets/Sales 25% 22% Assets/Equity
(Acc. pay. & accr.)/Sales 4% 4% Return on equity (ROE)
Tax rate 40% 40% P/E ratio
ROIC 8.0% 12.5%
NOPAT/Sales 4.5% 5.6%
(Total op. capital)/Sales 56.0% 45.0%
(atfield Medical Supply’s stock price had been lagging its industry averages, so its board of directors brought in a
new CEO, Jaiden Lee. Lee had brought in Ashley Novak, a finance MBA who had been working for a consulting
company, to replace the old CFO, and Lee asked Ashley to develop the financial planning section of the strategi
)n her previous job, Novak’s primary task had been to help clients develop financial forecasts, and that was one
reason Lee hired her.
Novak began as she always did, by comparing (atfield’s financial ratios to the industry averages. )f any ratio was
substandard, she discussed it with the responsible manager to see what could be done to improve the situation.
following data shows (atfield’s latest financial statements plus some ratios and other data that Novak plans to use in
her analysis.
Hatfield Medical Supply: Balance Sheet (Millions of
Dollars), December 31
Hatfield Medical Supply: Income Statement
(Millions of Dollars Except per Share)
Chapter 12 Mini Case
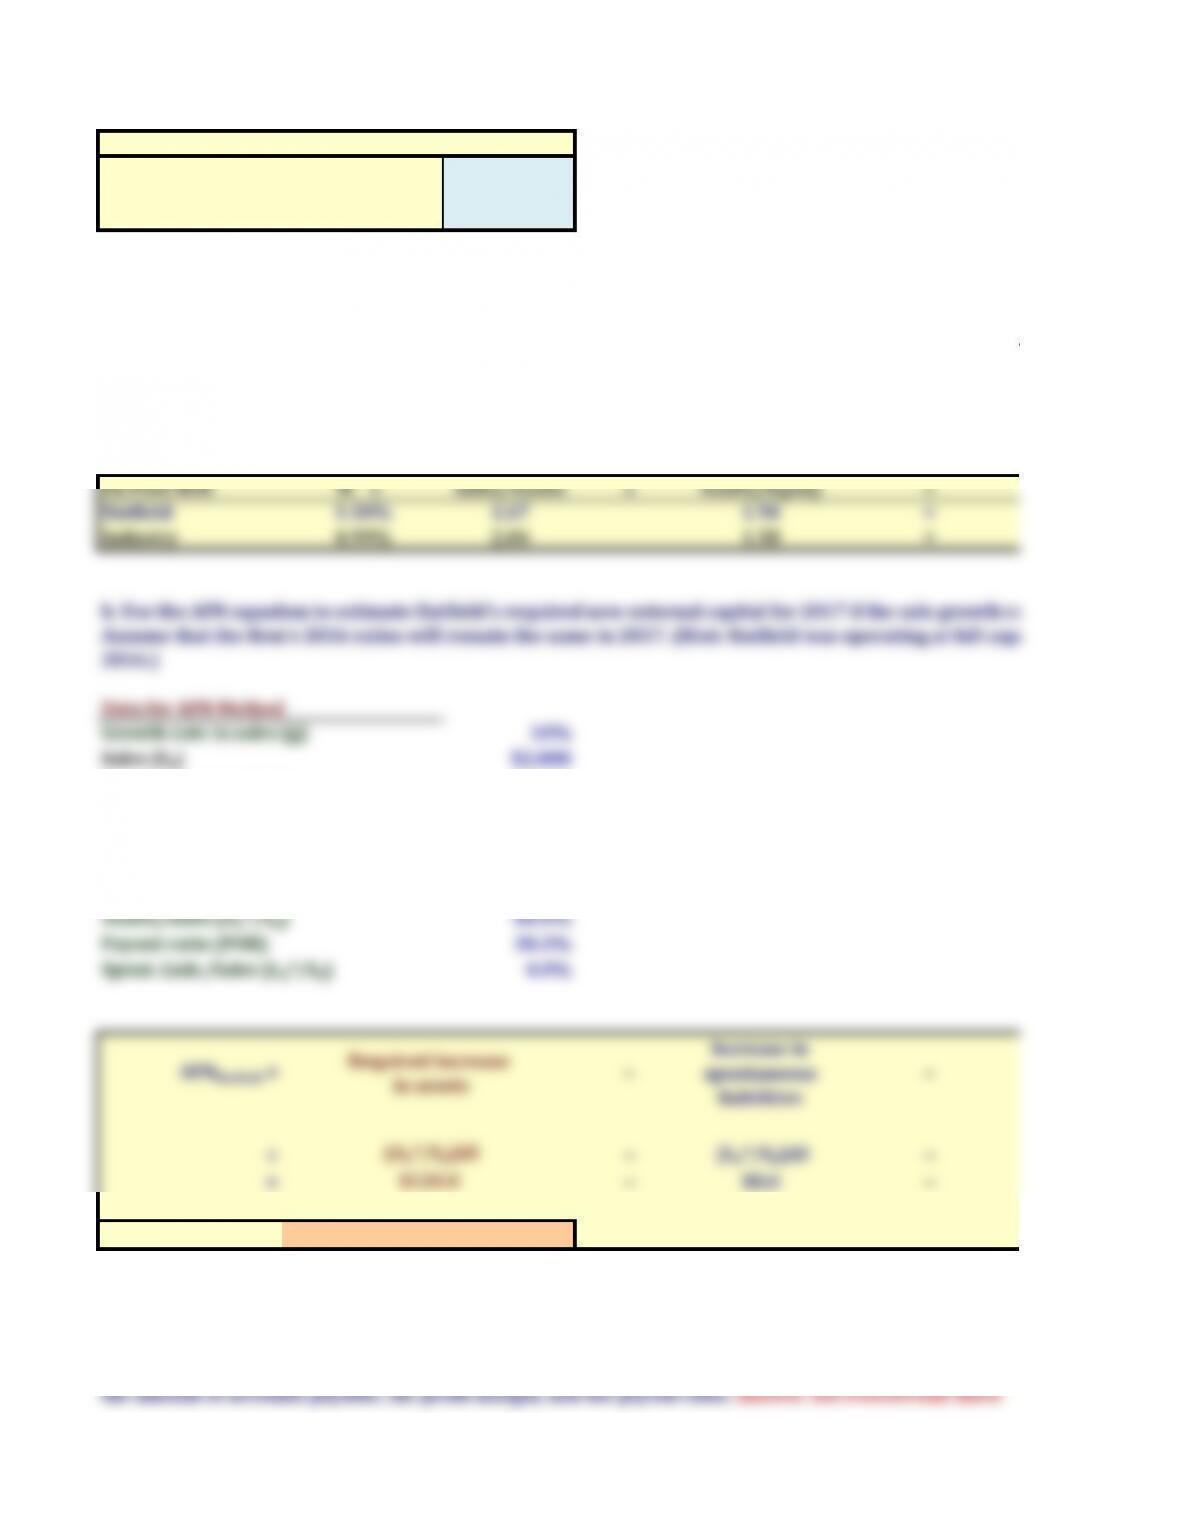
Additional Data 2017
Exp. Sales growth rate 10%
Interest rate on LT debt 8%
Target WACC 9%
Hatfield is less profitable, uses its assets less efficiently, and has too much leverage.
Du Pont ROE M x Sales/Assets x Assets/Equity =
Hatfield 3.30% 1.67 1.94 =
Industry 4.99% 2.04 1.58 =
Data for AFN Method
Growth rate in sales (g) 10%
Sales (S0)$2,000
Required assets (A0*) $1,200
Spontaneious liabilities (L0*) $80
Forecasted sales (S1)$2,200
)ncrease in sales ΔS = gS0)$200
Profit margin (M) 3.30%
Assets/Sales (A0*/S0)60.0%
Payout ratio (POR) 30.3%
Spont. Liab./Sales (L0*/S0)4.0%
=−
(L0*/S0∆S −
=−$8.0 −
AFNHatfield = $61.40 million
AFNHatfield =
Required increase
in assets
−
Increase in
spontaneous
liabilities
−
b. Use the AFN equation to estimate (atfield’s required new external capital for if the sale growth rate is %.
Assume that the firm’s ratios will remain the same in . (int: (atfield was operating at full capacity in
2016.)
$120.0
c. Define the term capital intensity. Explain how a decline in capital intensity would affect the AFN, other things
constant. Would economies of scale combined with rapid growth affect capital intensity, other things held const
Also, explain how changes in each of the following would affect AFN, holding other things constant: the growth
the amount of accounts payable, the profit margin, and the payout ratio. Answer: See PowerPoint Show
a. Using (atfield’s data and its industry averages, how well run would you say (atfield appears to be in comparison
with other firms in its industry? What are its primary strengths and weaknesses? Be specific in your answer, and
point to various ratios that support your position. Also, use the DuPont equation (see Chapter 7) as one part of
analysis.
(A0*/S0∆S
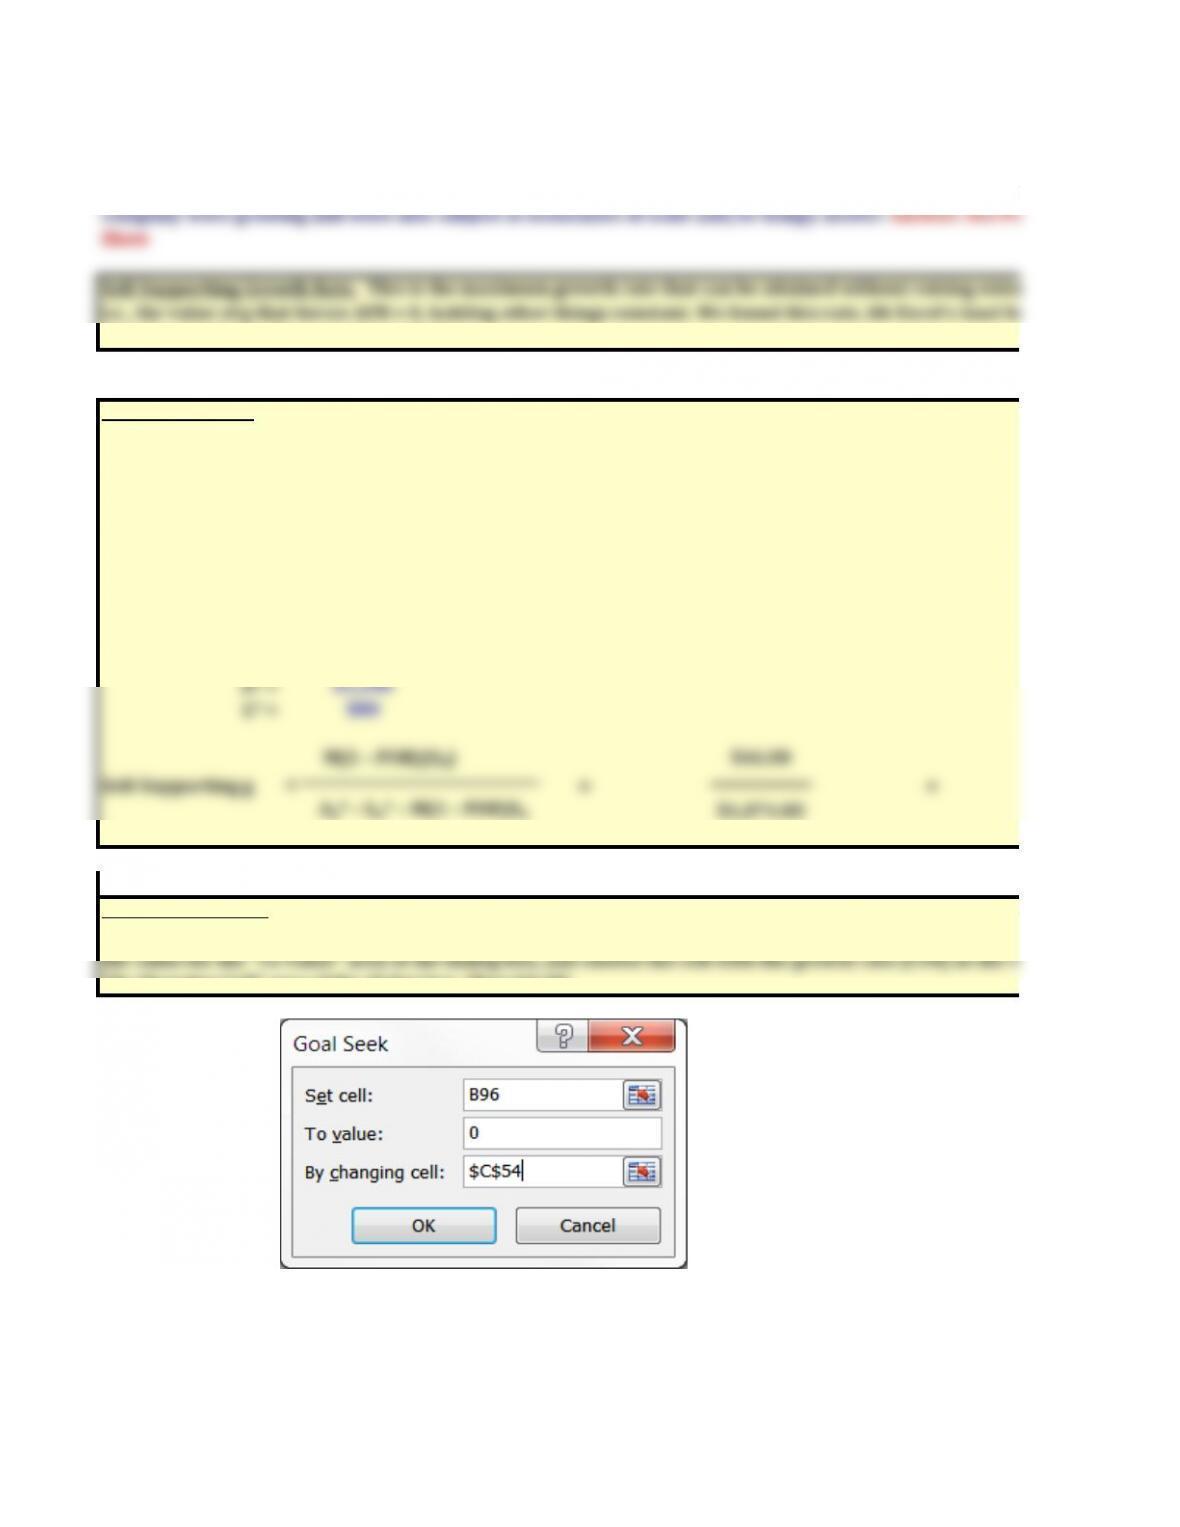
Self-Supporting g =
M = 3.30%
POR = 30.3%
1-POR = 69.7%
S0 = $2,000
A* = $1,200
L* = $80
$46.00
Self-Supporting g = ──────── =
$1,074.00
A0* – L0* – M – PORS0
= ───────────────────
M – PORS0)
d. Define the term self-supporting growth rate. What is (atfield’s self-supporting growth rate? Would the self-
supporting growth rate be affected by a change in the capital intensity ratio or the other factors mentioned in t
previous question? Other things held constant, would the calculated capital intensity ratio change over time if
company were growing and were also subject to economies of scale and/or lumpy assets? Answer: See PowerPoi
Show
M – PORS0)
A0* – L0* – M – PORS0
Self-Supporting Growth Rate. This is the maximum growth rate that can be attained without raising external fu
i.e., the value of g that forces AFN = 0, holding other things constant. We found this rate, ith Excel's Goal Seek fu
and also algebraically, as explained below.
1. Using algebra. The self-supporting growth rate can also be found by setting the AFN equation to zero and then
solving for g.
2. Using Goal Seek. To find the self-supporting growth rate with Goal Seek, select Data, What-If Analysis, and G
Seek; then choose cell with the AFN (B96) as the value for the "Set Cell" area of the Goal Seek dialog box, choose
the value for the "To Value" area of the dialog box, and choose the cell with the growth rate (C54) as the value fo
"By Changing Cell" area of the dialog box. Then hit OK.
e. Use the following assumptions to answer the questions below: (1) Operating ratios remain unchanged. (2) S
will grow by 10%, 8%, 5%, and 5% for the next four years. (3) The target weighted average cost of capital (WAC
9%. This is the No Change scenario because operations remain unchanged.
= ───────────────────────
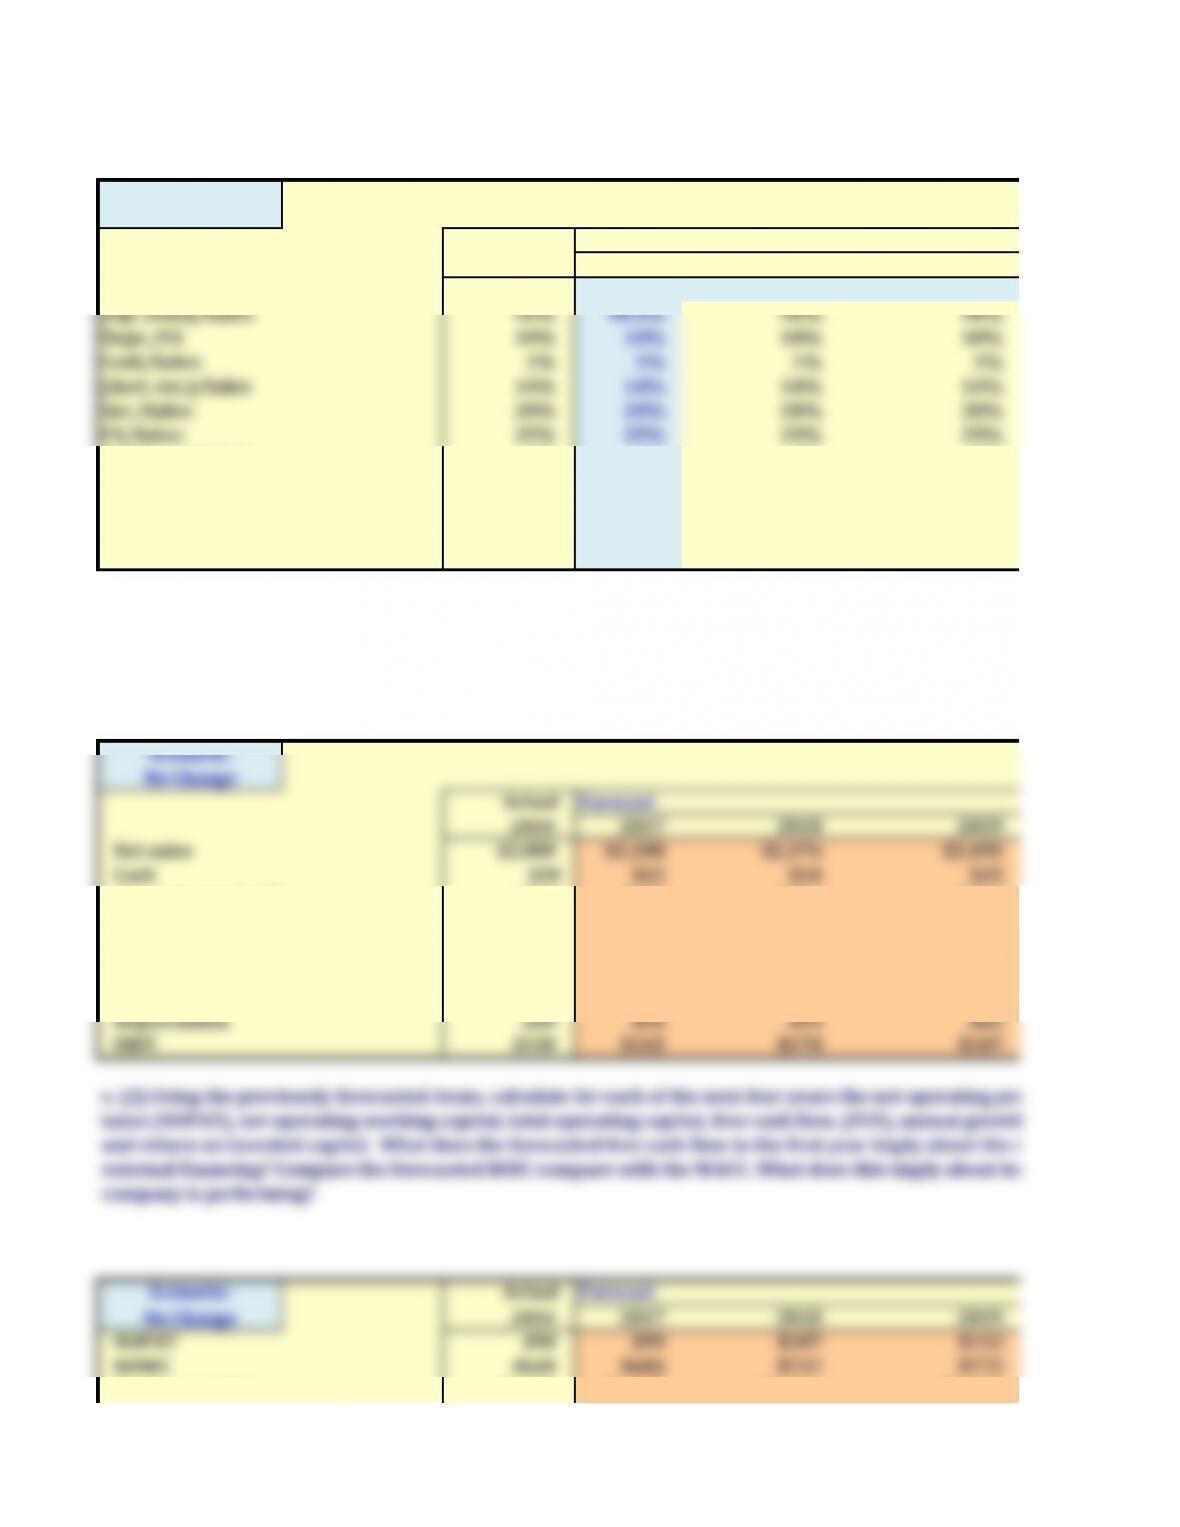
Scenario:
No Change
Actual Forecast
Inputs 2016 2017 2018 2019
Sales growth rate: 10% 8% 5%
(Op. costs)/Sales: 90% 90.0% 90% 90%
Depr./FA 10% 10% 10% 10%
Cash/Sales: 1% 1% 1% 1%
(Acct. rec.)/Sales 14% 14% 14% 14%
Inv./Sales: 20% 20% 20% 20%
FA/Sales: 25% 25% 25% 25%
(AP & accr.)/ Sales: 4% 4% 4% 4%
Tax rate: 40% 40% 40% 40%
Rate on all debt 8.0% 8% 8%
Div. growth rate: 5% 10% 10% 10%
Target WACC 9%
Scenario:
No Change
Actual Forecast
2016 2017 2018 2019
Net sales $2,000 $2,200 $2,376 $2,495
Cash $20 $22 $24 $25
Accounts receivable $280 $308 $333 $349
Inventories $400 $440 $475 $499
Net fixed assets $500 $550 $594 $624
Accts. pay. & accruals $80 $88 $95 $100
Op. costs (excl. depr.) $1,800 $1,980 $2,138 $2,245
Depreciation $50 $55 $59 $62
EBIT $150 $165 $178 $187
Scenario: Actual Forecast
No Change 2016 2017 2018 2019
NOPAT $90 $99 $107 $112
NOWC $620 $682 $737 $773
Total op. capital $1,120 $1,232 $1,331 $1,397
e. (2) Using the previously forecasted items, calculate for each of the next four years the net operating profit aft
taxes (NOPAT), net operating working capital, total operating capital, free cash flow, (FCF), annual growth rate
and return on invested capital. What does the forecasted free cash flow in the first year imply about the need fo
external financing? Compare the forecasted ROIC compare with the WACC. What does this imply about how we
company is performing?
e. (1) For each of the next four years, forecast the following items: sales, cash, accounts receivable, inventories,
fixed assets, accounts payable & accruals, operating costs (excluding depreciation), depreciation, and earnings
before interest and taxes (EBIT).
Inputs for the forecast are shown below. You can change inputs in blue. You can show the original scenario by go
to Data, What-If Analysis, Scenario Manager, and select the scenario named No Change .
FCF −$ $8 $46
Growth in FCF -164% 447.1%
ROIC 8.0% 8.0% 8.0% 8.0%
Scenario:
No Change
Horizon Value: Value of operations
+ ST investments
= $1,261 Estimated total intrinsic value
− All debt
Value of Operations: − Preferred stock
Present value of HV $893 Estimated intrinsic value of equity
+ Present value of FCF $64 ÷ Number of shares
No Change
1. Balance Sheets Most Recent
2016 Input
Assets
Cash $20.0 1.00%
Accts. rec. 280.0 14.00%
Inventories 400.0 20.00%
Total CA $700.0
Net fixed assets 500.0 25.00%
Total assets $1,200.0
Liabilities and equity
Accts. pay. & accruals $80.0 4.00%
Line of credit 0.0 Draw on LOC if financing deficit
Total CL $80.0
Long-term debt 500.0 Carry over from previous year
Total liabilities $580.0
Common stock 420.0 Carry over from previous year
Basis for 2017 Forecast
× 2017 Sales
× 2017 Sales
× 2017 Sales
× 2017 Sales
× 2017 Sales
e. (3) Assume that FCF will continue to grow at the growth rate for the last year in the forecast horizon (Hint: 5%).
What is the horizon value at 2020? What is the present value of the horizon value? What is the present value of
forecasted FCF? (Hint: use the free cash flows for 2017 through 2020). What is the current value of operations?
information from the 2016 financial statements, what is the current estimated intrinsic stock price?
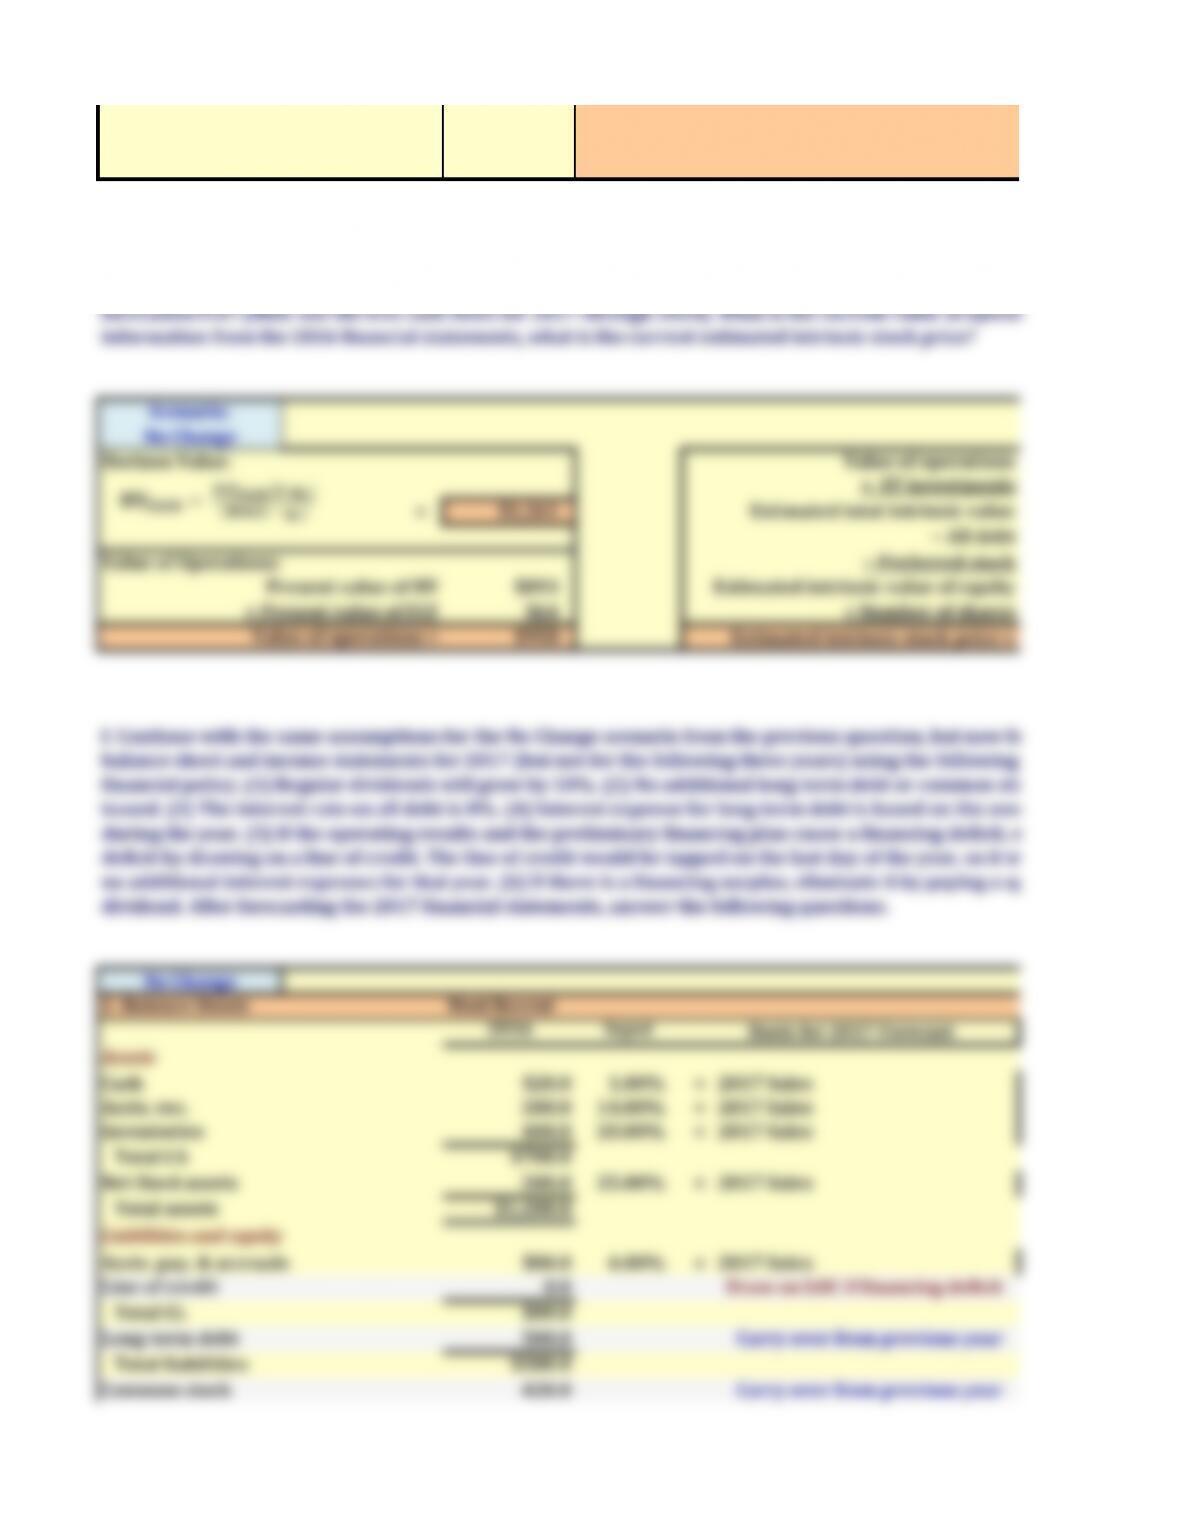
f. Continue with the same assumptions for the No Change scenario from the previous question, but now forecast
balance sheet and income statements for 2017 (but not for the following three years) using the following prelimina
financial policy. (1) Regular dividends will grow by 10%. (2) No additional long-term debt or common stock wi
issued. (3) The interest rate on all debt is 8%. (4) Interest expense for long-term debt is based on the average ba
during the year. (5) If the operating results and the preliminary financing plan cause a financing deficit, elimina
deficit by drawing on a line of credit. The line of credit would be tapped on the last day of the year, so it would
no additional interest expenses for that year. (6) If there is a financing surplus, eliminate it by paying a special
dividend. After forecasting the 2017 financial statements, answer the following questions.
� =���+��
��� − ��
Retained earnings 200.0
Total common equity $620.0
Total liabs. & equity $1,200.0
Check: TA − Total Liab. & Eq. =
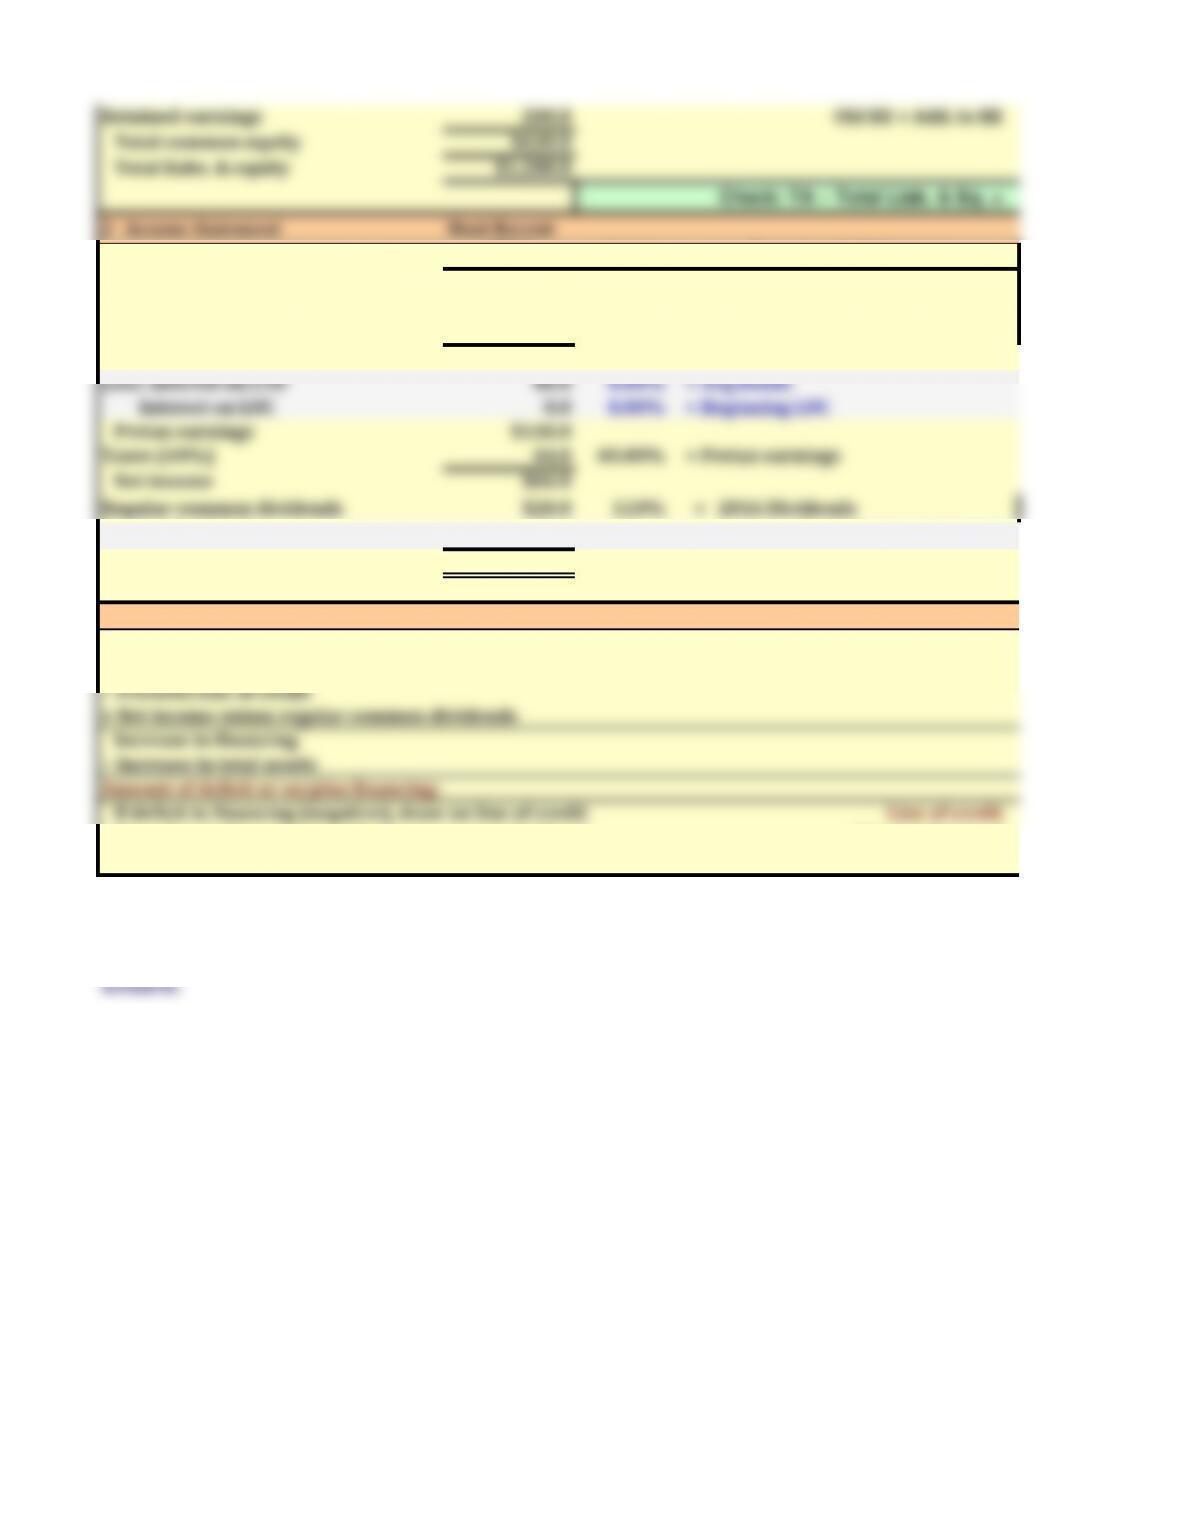
2. Income Statement Most Recent
2016 Input
Sales $2,000.0 110%
Op. costs (excl. depr.) 1,800.0 90.00%
Depreciation 50.0 10.00%
EBIT $150.0
Less: Interest on LTD 40.0 8.00% × Avg bonds
Interest on LOC 0.0 8.00% × Beginning LOC
Pretax earnings $110.0
Taxes (40%) 44.0 40.00%
Net income $66.0
Special dividends $0.0 Pay if financing surplus
Addition to RE $46.0 Net income – Dividends
3. Elimination of the Financial Deficit or Surplus
Increase in spontaneous liabilities (accounts payable and accruals)
+ Increase in long-term debt and common stock
− Previous line of credit
+ Net income minus regular common dividends
Increase in financing
− )ncrease in total assets
Amount of deficit or surplus financing:
If deficit in financing (negative), draw on line of credit Line of credit
If surplus in financing (positive), pay special dividend Special dividend
Go to Scenario Manager and choose the Improve Scenario. This will update the financial statements shown abo
Note: see to right for the Improve Scenario's financial statements with fixed values and no
g. Repeat the analysis performed the previous question but now assume that Hatfield is able to improve the fol
inputs: operating costs (excluding depreciation)/sales = 89.5% and inventories/sales = 16%. This is the Impro
scenario.
Basis for 2017 Forecast
× 2016 Sales
× 2017 Sales
Old RE + Add. to RE
× Pretax earnings
× 2017 Net fixed assets
− Previous line of credit
− )ncrease in total assets
10/28/15
2016
$2,000.0
$1,800.0
$50.0
$150.0
$40.0
$110.0
$44.0
$66.0
$20.0
$46.0
10.0
$6.6
$2.0
$52.80
Hatfield Industry
48.3% 36.7%
3.8 8.9
5.5% 10.2%
3.30% 4.99%
1.67 2.04
1.94 1.58
10.6% 16.1%
8.0 16.0
(atfield Medical Supply’s stock price had been lagging its industry averages, so its board of directors brought in a
consulting
he strategic plan.
)n her previous job, Novak’s primary task had been to help clients develop financial forecasts, and that was one
Novak began as she always did, by comparing (atfield’s financial ratios to the industry averages. )f any ratio was
he situation. The
following data shows (atfield’s latest financial statements plus some ratios and other data that Novak plans to use in
me Statement
t per Share)
ROE
10.6%
16.1%
M ×S1 × –POR
$50.6
Increase in
retained earnings
b. Use the AFN equation to estimate (atfield’s required new external capital for if the sale growth rate is %.
Assume that the firm’s ratios will remain the same in . (int: (atfield was operating at full capacity in
other things held
s held constant?
the growth rate,
ow
a. Using (atfield’s data and its industry averages, how well run would you say (atfield appears to be in comparison
r answer, and
s one part of your
4.283%
d. Define the term self-supporting growth rate. What is (atfield’s self-supporting growth rate? Would the self-
mentioned in the
over time if the
See PowerPoint
g external funds,
's Goal Seek function
zero and then
lysis, and Goal
box, choose 0 as
s the value for the
nged. (2) Sales
capital (WACC) is


