84 2676.4919 219.82866 462561.7233
85 -10.40211 -364.0957 -140440.7626
86 -618.5412 233.0352 -307260.417
87 361.9738 203.851 -78270.11082
88 1626.8792 23.499795 -398079.6619
89 -412.2452 34.719609 -95947.29666
90 -234.3981 -216.0283 -5029.615088
91 303.79883 304.30627 -30490.98433
92 1227.4221 36.261383 -306704.1902
93 2631.0847 177.34174 235014.611
94 797.8256 79.759648 -184392.7201
95 1198.391 -127.908 -685180.6324
96 900.67885 -323.4024 -894241.9511
97 -264.07 35.972449 -115968.1259
98 328.90068 -402.7766 -472399.8201
99 520.23727 -186.8377 -441804.9933
100 347.26066 130.00594 -130995.1322
10/28/2015
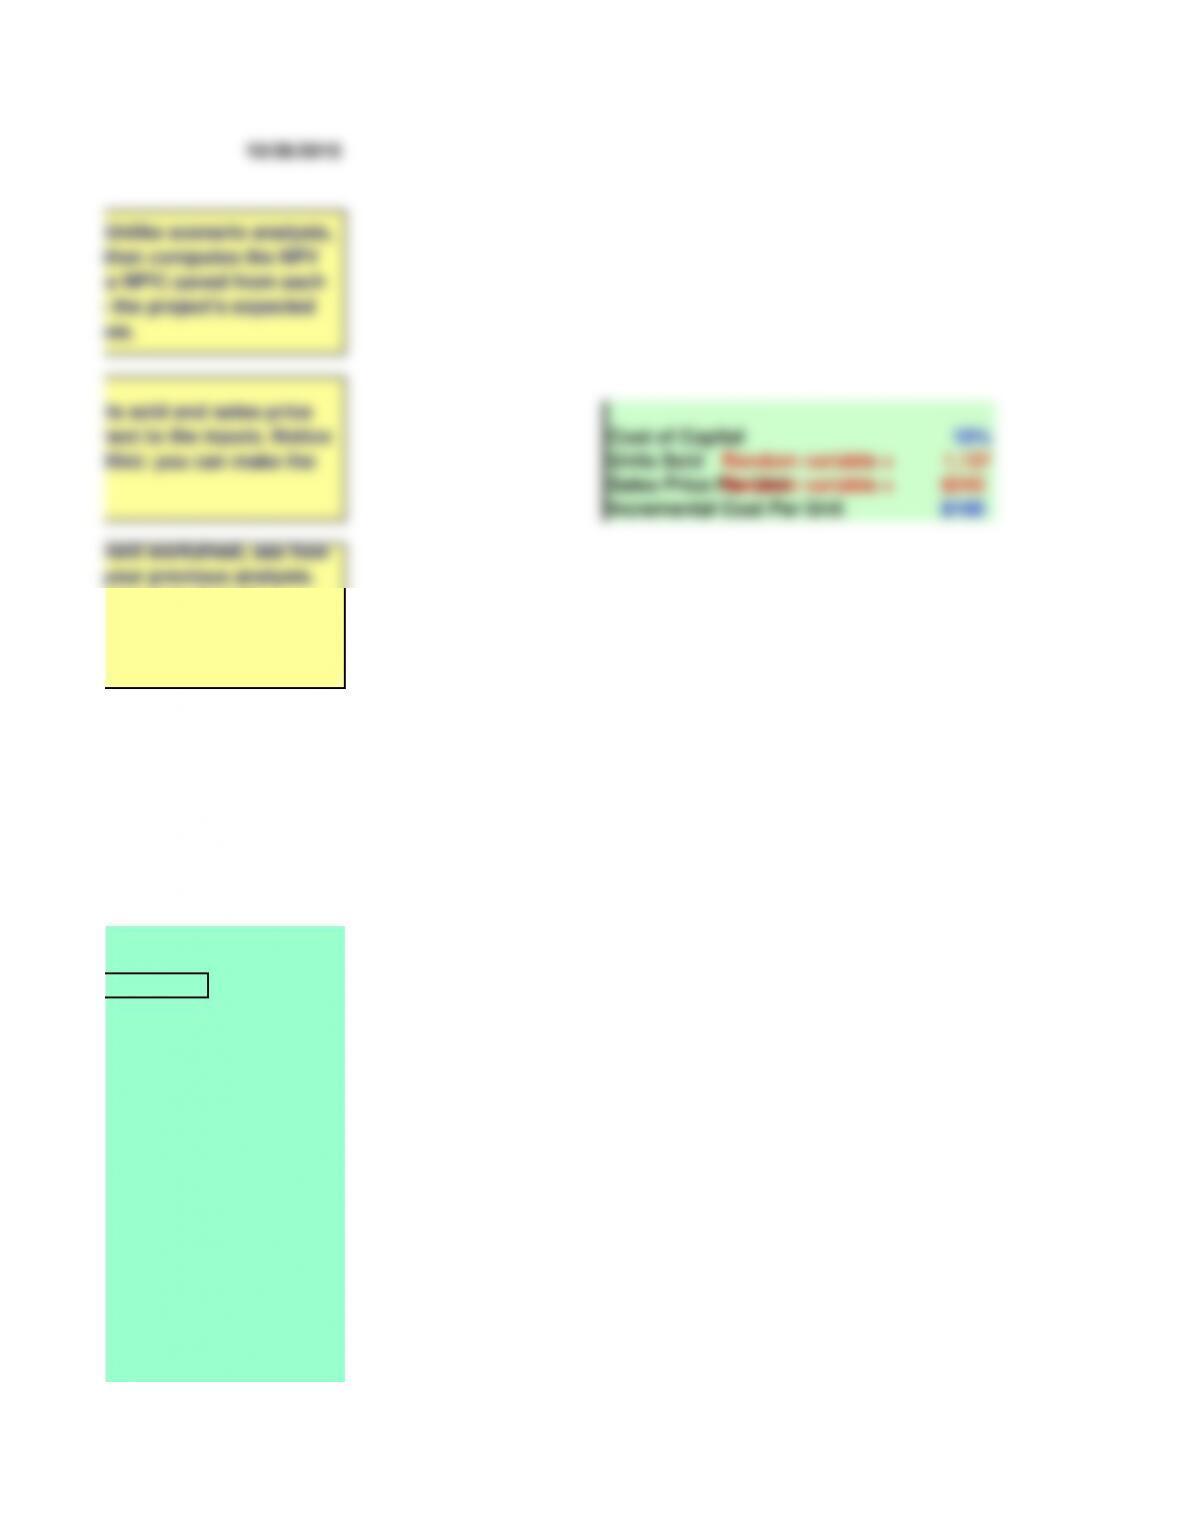
Cost of Capital 10%
Units Sold Random variable = 1,137
Sales Price Per UnitRandom variable = $243
Incremental Cost Per Unit $100
($663,986)
e used Unlike scenario analysis,
d then computes the NPV
s (like NPV) saved from each
imate the project’s expected
comes.
units sold and sales price
next to the inputs. Notice
e (Hint: you can make the
ferent worksheet, see how
r your previous analysis.
e went into that file,
ause we pasted them into
e then edited this
al

Remainin
g Book
Value
$160,008
53,328
17,784
0
Year 4
1,345
($103.53)
$109.27
($139,240)
146,960
17,784
($303,984)
(121,594)
($182,390)
17,784
($164,606)
Year 4
($139,240)
(16,709)
include inflation when
net working capital.
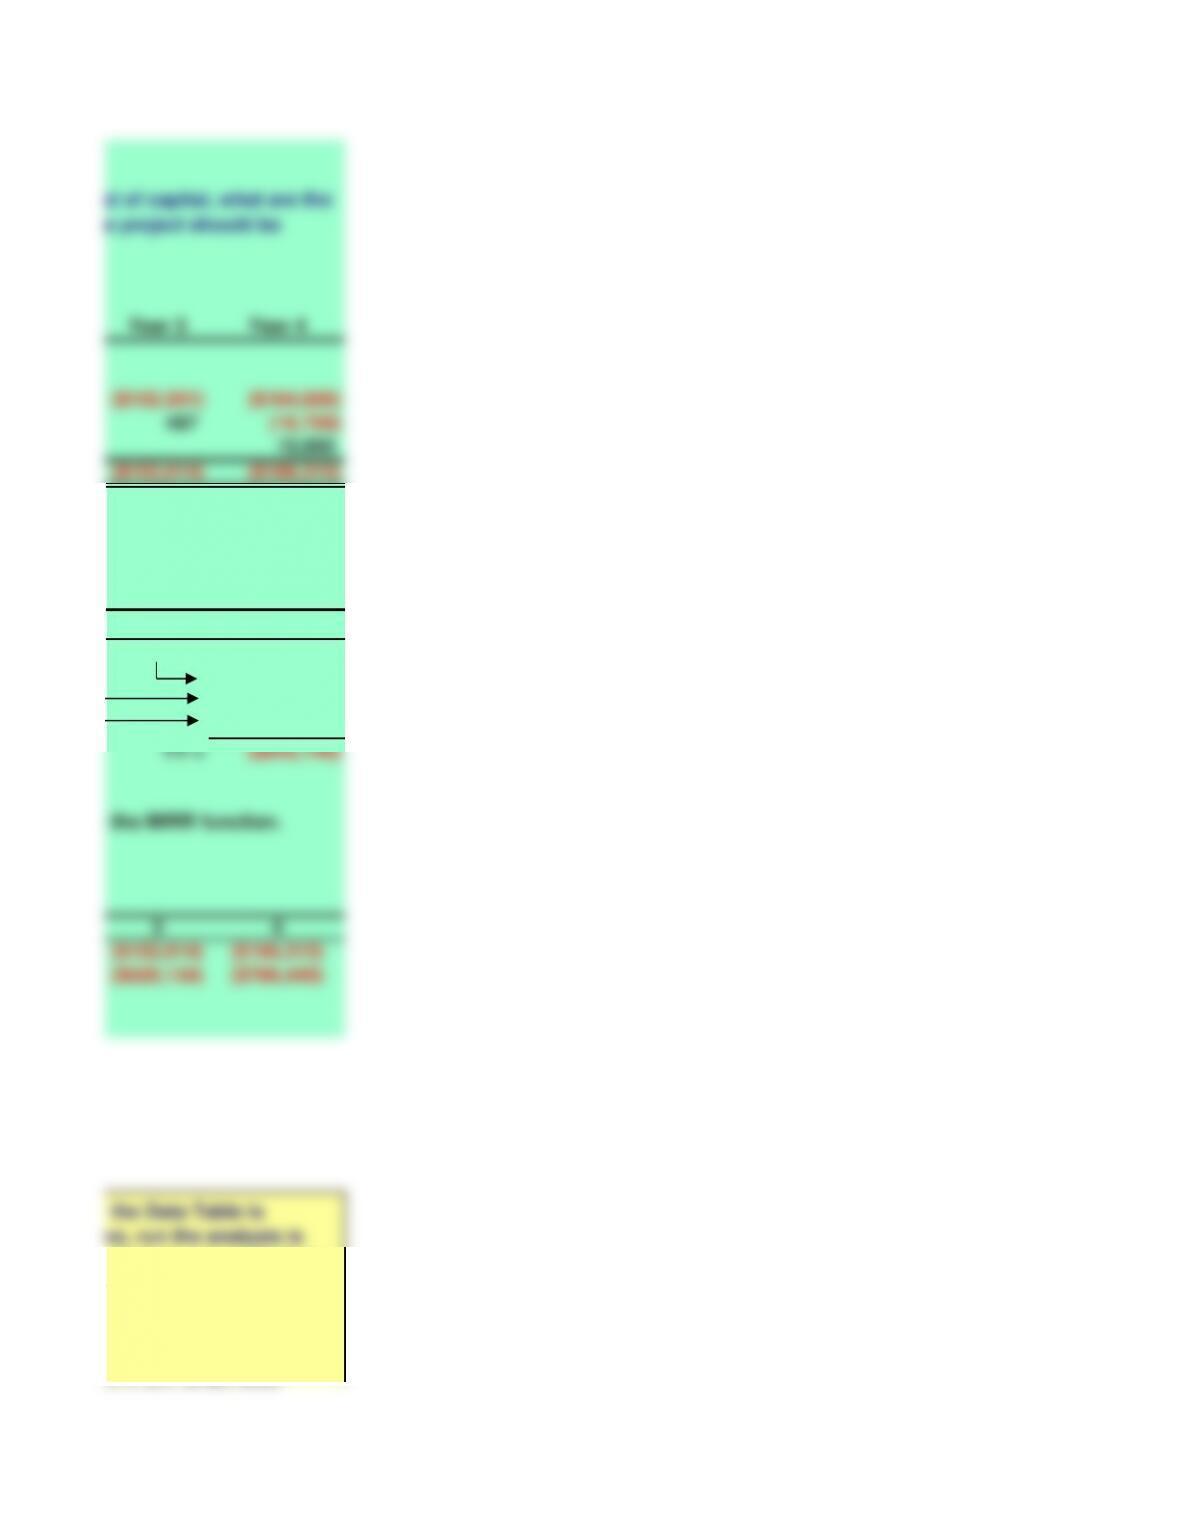
Year 3 Year 4
($152,501) ($164,606)
487 (16,709)
15,000
($152,014) ($166,315)
3 4
($152,014) ($166,315)
(167,215)
(143,649)
(165,965)
TV = ($643,146)
3 4
($152,014) ($166,315)
($620,134) ($786,449)
en the Data Table is
above, run the analysis is
so that we can verify that
ed in each row) to
e Data Table to treat these as
nd the resulting NPV. In
uts in the Data Table into
ates a row of the Data
age project cost of capital, what are the
project’s NPV, IRR, MIRR, PI, payback, and discounted payback? Do these indicators suggest that the project should be
s
use the MIRR function.
s
Don’t change the the red cell.
Scratch work for chart: see comments.
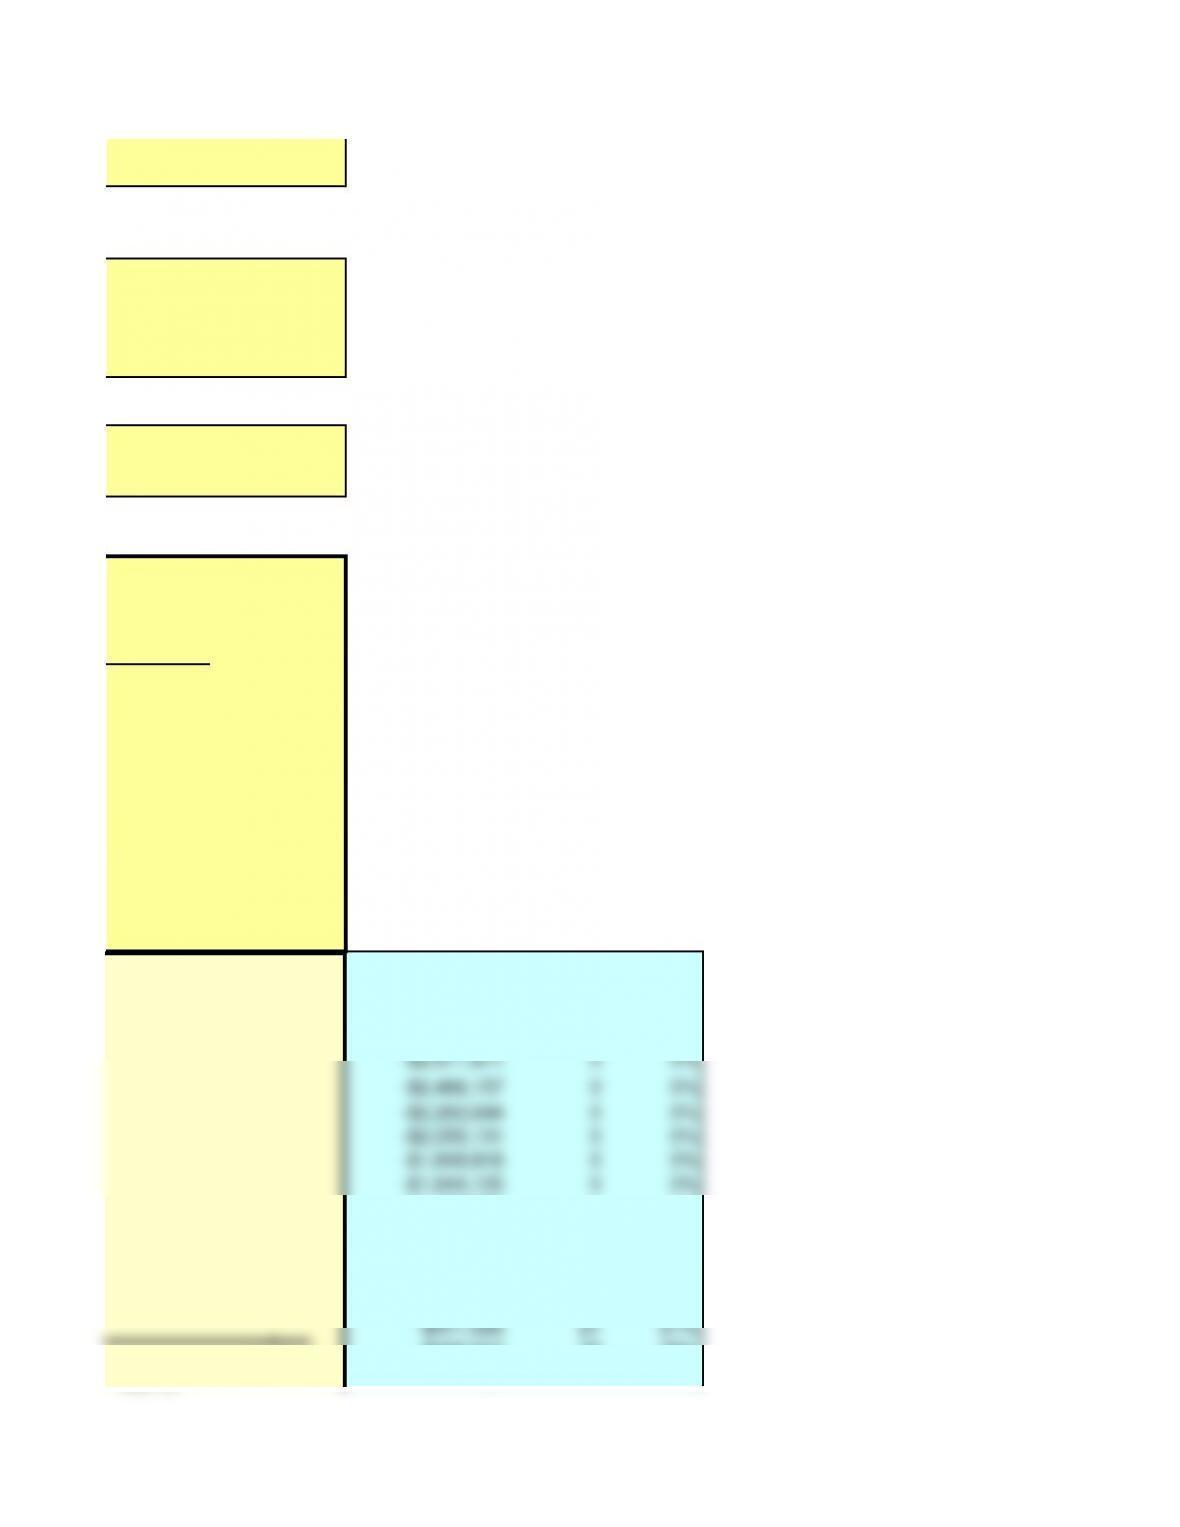
Count
Range bottom 1Percent
-$2,877,184 0 0%
-$2,671,671 0 0%
-$2,466,157 0 0%
-$2,260,644 0 0%
-$2,055,131 0 0%
-$1,849,618 0 0%
-$1,644,105 0 0%
-$205,513 35 35%
$0 11 11%
lation. The summary of
and are updated
able changes. In our case, we
n, the Data Table is
0 rows, it updates very
a tables.
ates a row of the Data
2,877,184
NPV ($)
$205,513 66%
$411,026 33%
$616,539 11%
$822,052 00%
$1,027,566 33%
$1,233,079 00%
$2,466,157 00%
$2,671,671 00%
$2,877,184 00%
Sum 99 100%
NPV ($)

Expected
Value
Std. Dev.
1,250 200
$200 $30