
k. Assume that Sidney Johnson is confident of her estimates of all the variables that affect the project’s cash
0 units a
1,600 units
chance of
swer: See
(3.) Use the worst-, most likely, and best–case NPVs and probabilities of occurrence to find the project’s
iable at a
s us to bring

sis above.)
sequently,
CC to risk
ini Case Show
adjust for risk.
made?
0.4. Would
red here?
cipal
eet this file for
cording the
ine the inputs
ld even use
create a table
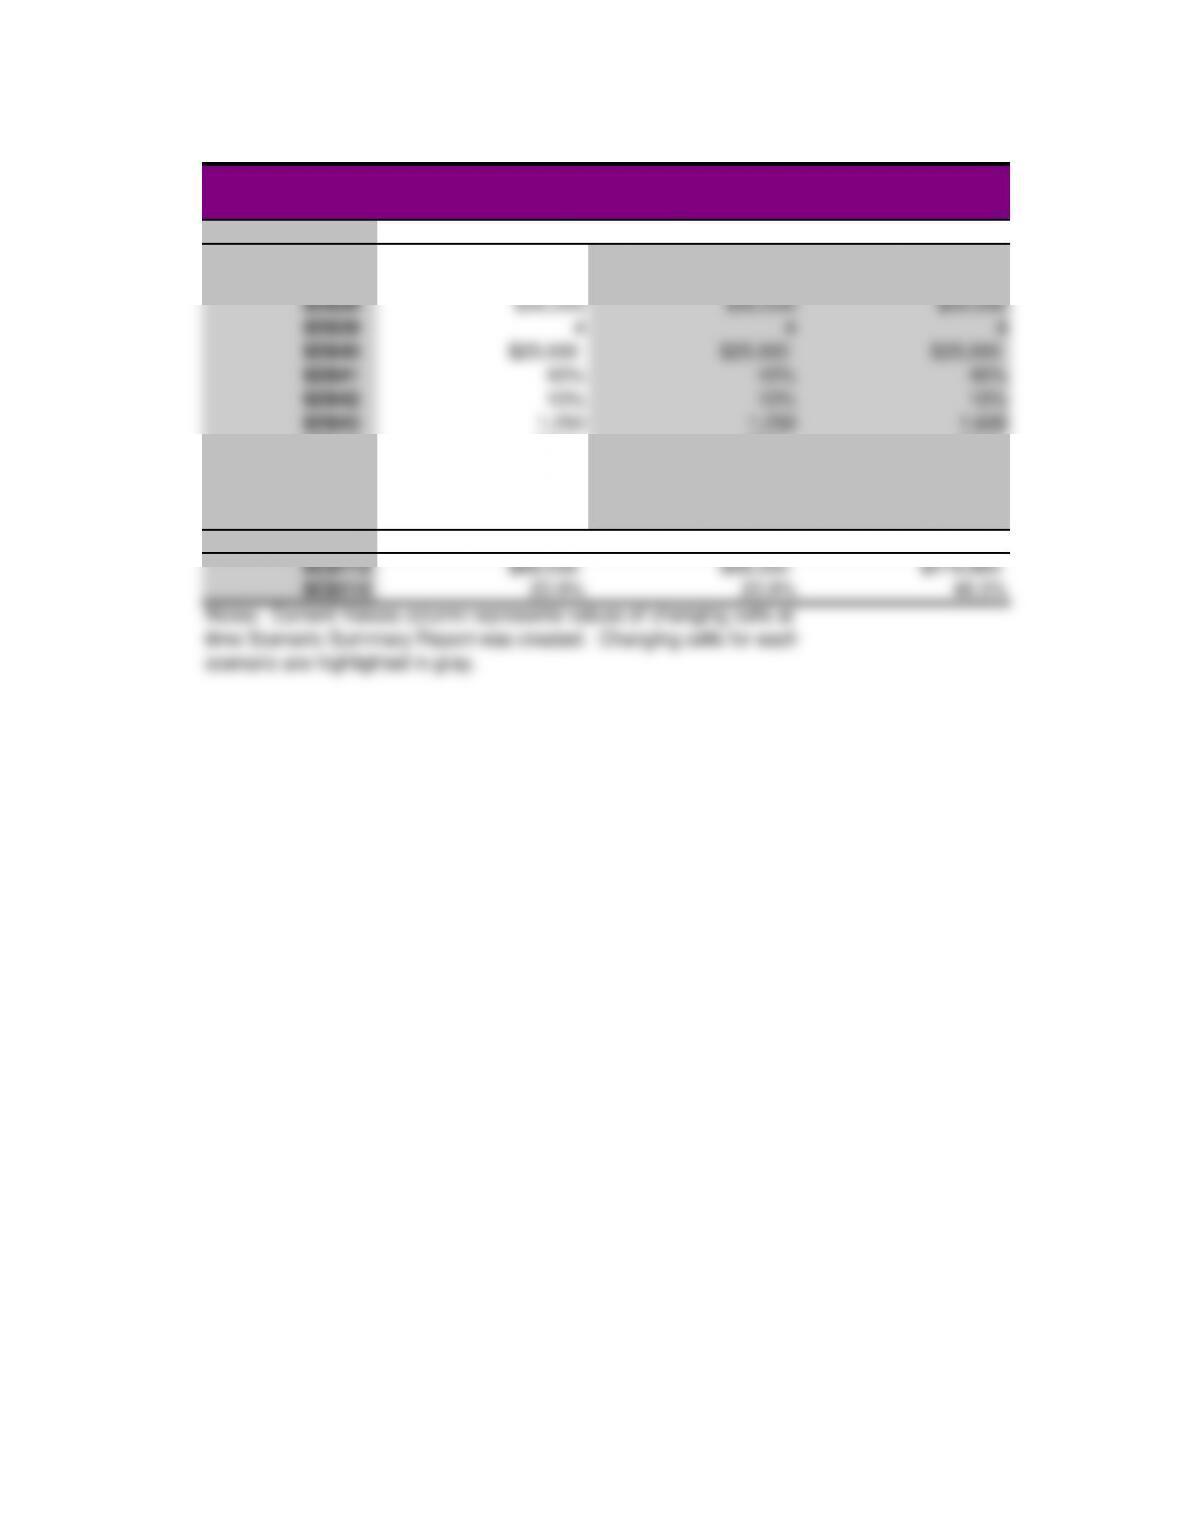
Scenario Summary
Current Values: Base Case Best Case
Changing Cells:
$D$36 $200,000 $200,000 $200,000
$D$37 $10,000 $10,000 $10,000
$D$38 $30,000 $30,000 $30,000
$D$39 4 4 4
$D$40 $25,000 $25,000 $25,000
$D$41 40% 40% 40%
$D$42 10% 10% 10%
$D$43 1,250 1,250 1,600
$D$44 $200 $200 $240
$D$45 $100 $100 $100
$D$46 12% 12% 12%
$D$47 3% 3% 3%
Result Cells:
$C$113 $88,030 $88,030 $278,965
$C$114 23.9% 23.9% 48.3%
Notes: Current Values column represents values of changing cells at
time Scenario Summary Report was created. Changing cells for each
scenario are highlighted in gray.

Worst Case Base-but forget inflation
$200,000 $200,000
$10,000 $10,000
$30,000 $30,000
4 4
$25,000 $25,000
40% 40%
10% 10%
900 1,250
$160 $200
$100 $100
12% 12%
3% 0%
($48,514) $78,387
1.0% 22.7%
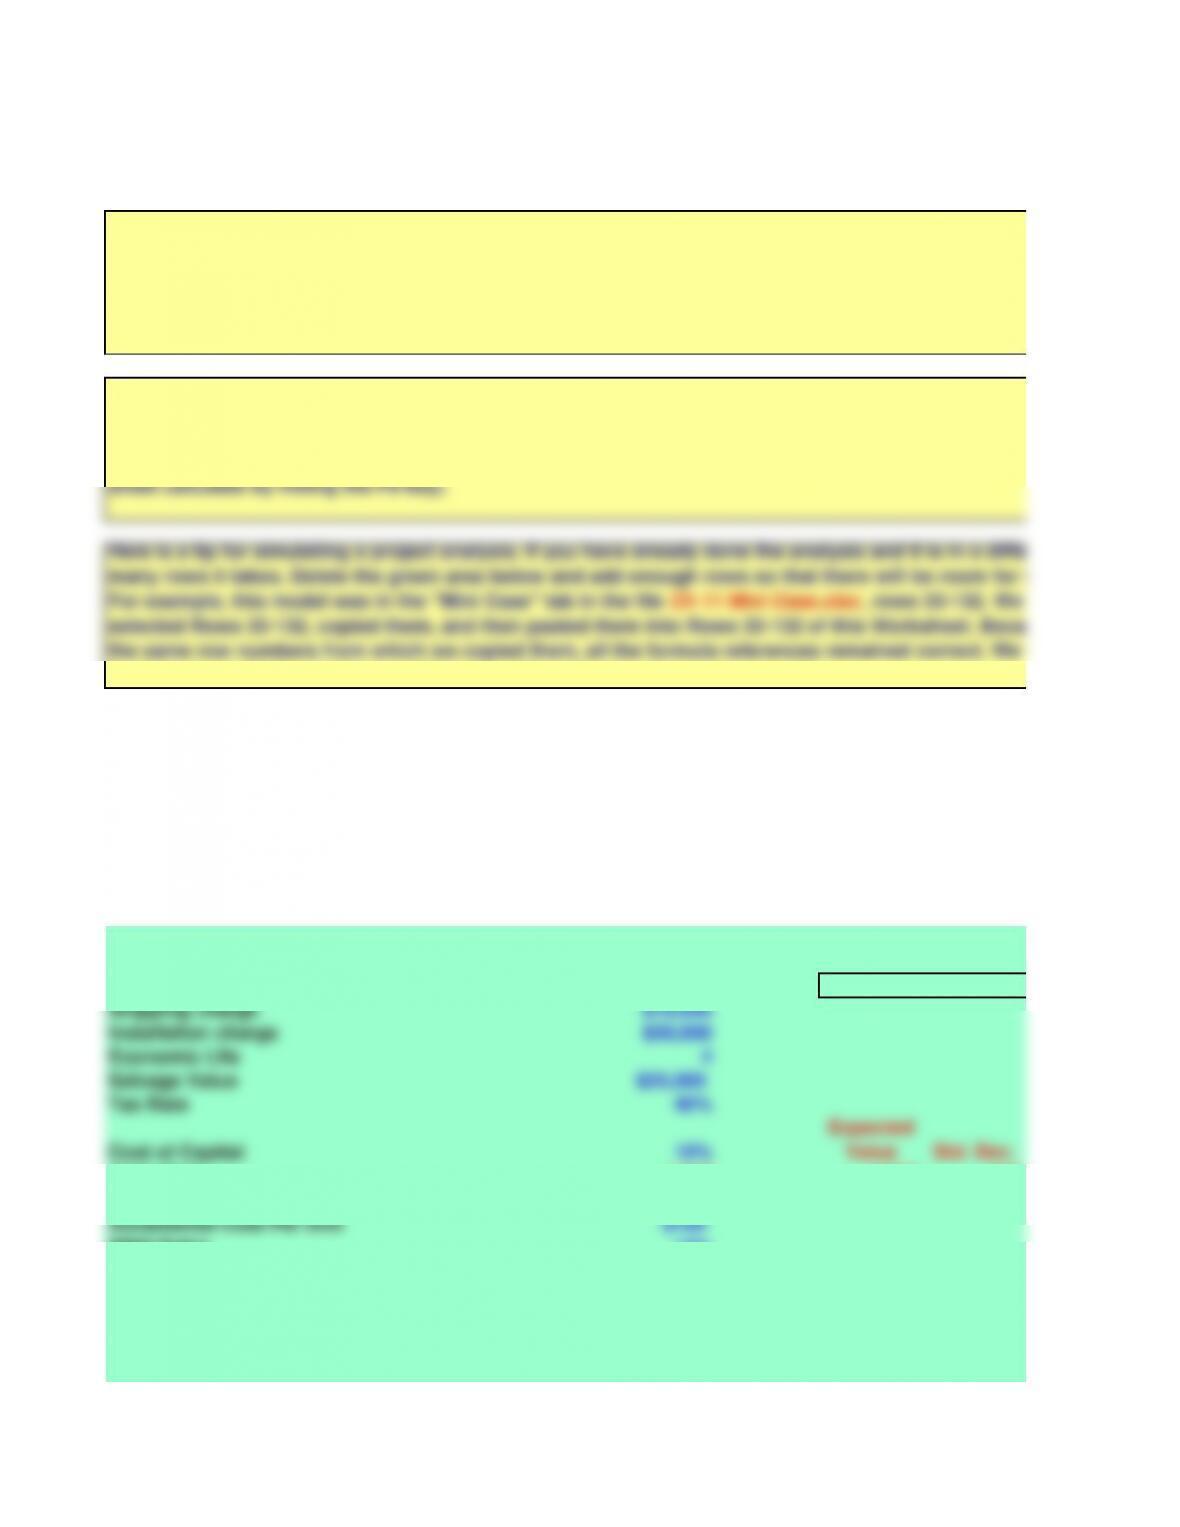
Part I: Input Data
Equipment cost $200,000 Key Output: NPV =
Shipping charge $10,000
Installation charge $30,000
Economic Life 4
Salvage Value $25,000
Tax Rate 40%
Cost of Capital 10%
Expected
Value
Std. Dev.
Units Sold 1,345 1,250 200
Sales Price Per Unit ($95) $200 $30
Incremental Cost Per Unit $100
NWC/Sales 12%
Inflation rate 3%
Monte Carlo simulation is similar to scenario analysis in that different values of key inputs are used Un
Monte Carlo simulation draws a trial set of input values from specified probability distributions and t
for this trial. This process is repeated for hundreds, or even thousands, of trials, with key results (like
trial. After running the number of desired trials, the NPVs from the trials can be averaged to estimate th
NPV; the trial results can also be used to provide a histogram showing the project’s possible outcomes
The green area below is the same project as in the mini case, but we have replaced the inputs for unit
with random variables drawn from normal distributions with the expected values and means shown next
that each time the sheet makes a calculation, the values for unit sales, sales price, and NPV change (Hin
sheet calculate by hitting the F9 key).
Here is a tip for simulating a project analysis. If you have already done the analysis and it is in a differ
many rows it takes. Delete the green area below and add enough rows so that there will be room for y
For example, this model was in the “Mini Case” tab in the file Ch 11 Mini Case.xlsx , rows 33-132. We w
selected Rows 33-132, copied them, and then pasted them into Rows 33-132 of this Worksheet. Because w
the same row numbers from which we copied them, all the formula references remained correct. We th
worksheet to add the random variables for units sold and sales price per unit.
b. Disregard the assumptions in Part a. What is Shrieves’ depreciable basis? What are the annual
depreciation expenses?
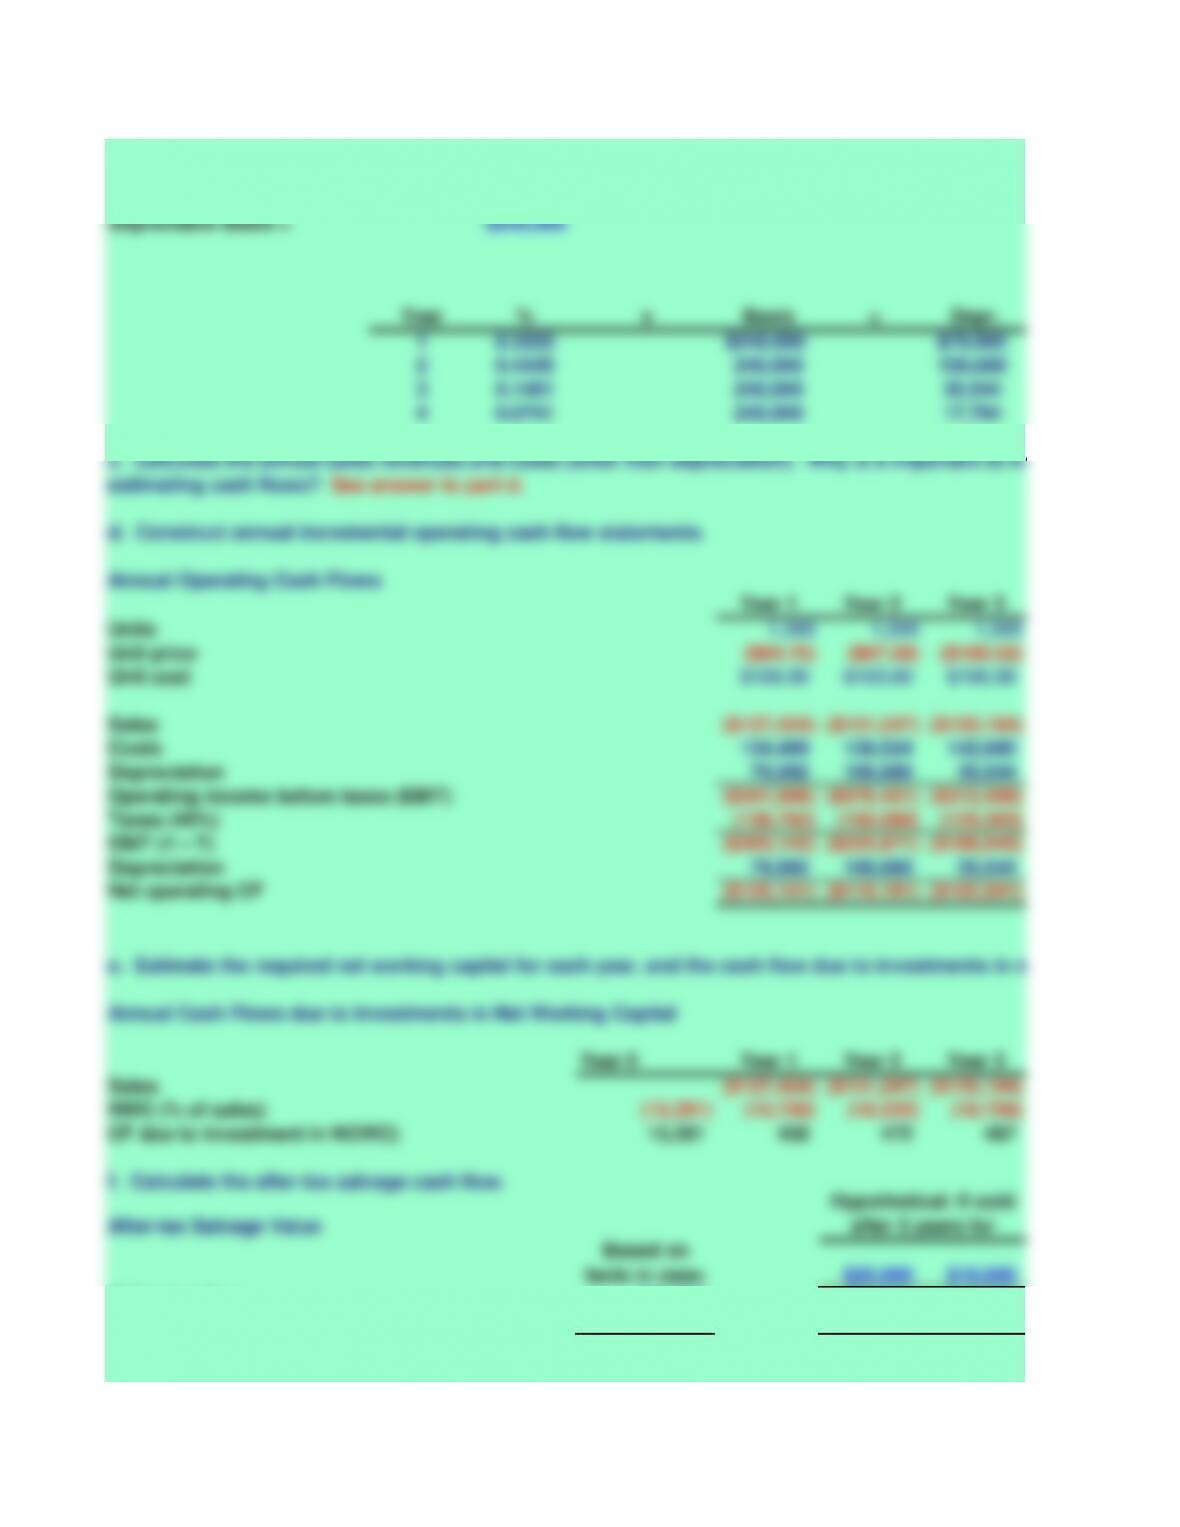
Annual Depreciation Expense
Depreciable Basis = Equipment + Freight + Installation
Depreciable Basis = $240,000
Year % x Basis = Depr.
10.3333 $240,000 $79,992
20.4445 240,000 106,680
30.1481 240,000 35,544
40.0741 240,000 17,784
Annual Operating Cash Flows
Unit price ($94.75) ($97.59) ($100.52)
Unit cost $100.00 $103.00 $106.09
Depreciation 79,992 106,680 35,544
Operating income before taxes (EBIT) ($341,906) ($376,451) ($313,408)
Taxes (40%) (136,762) (150,580) (125,363)
Depreciation 79,992 106,680 35,544
Annual Cash Flows due to Investments in Net Working Capital
CF due to investment in NOWC) 15,291 459 472 487
f. Calculate the after-tax salvage cash flow.
Salvage value $25,000 $25,000 $10,000
Gain or loss $25,000 $7,216 ($7,784)
Tax on salvage value 10,000 2,886 (3,114)
Net terminal cash flow $15,000 $22,114 $13,114
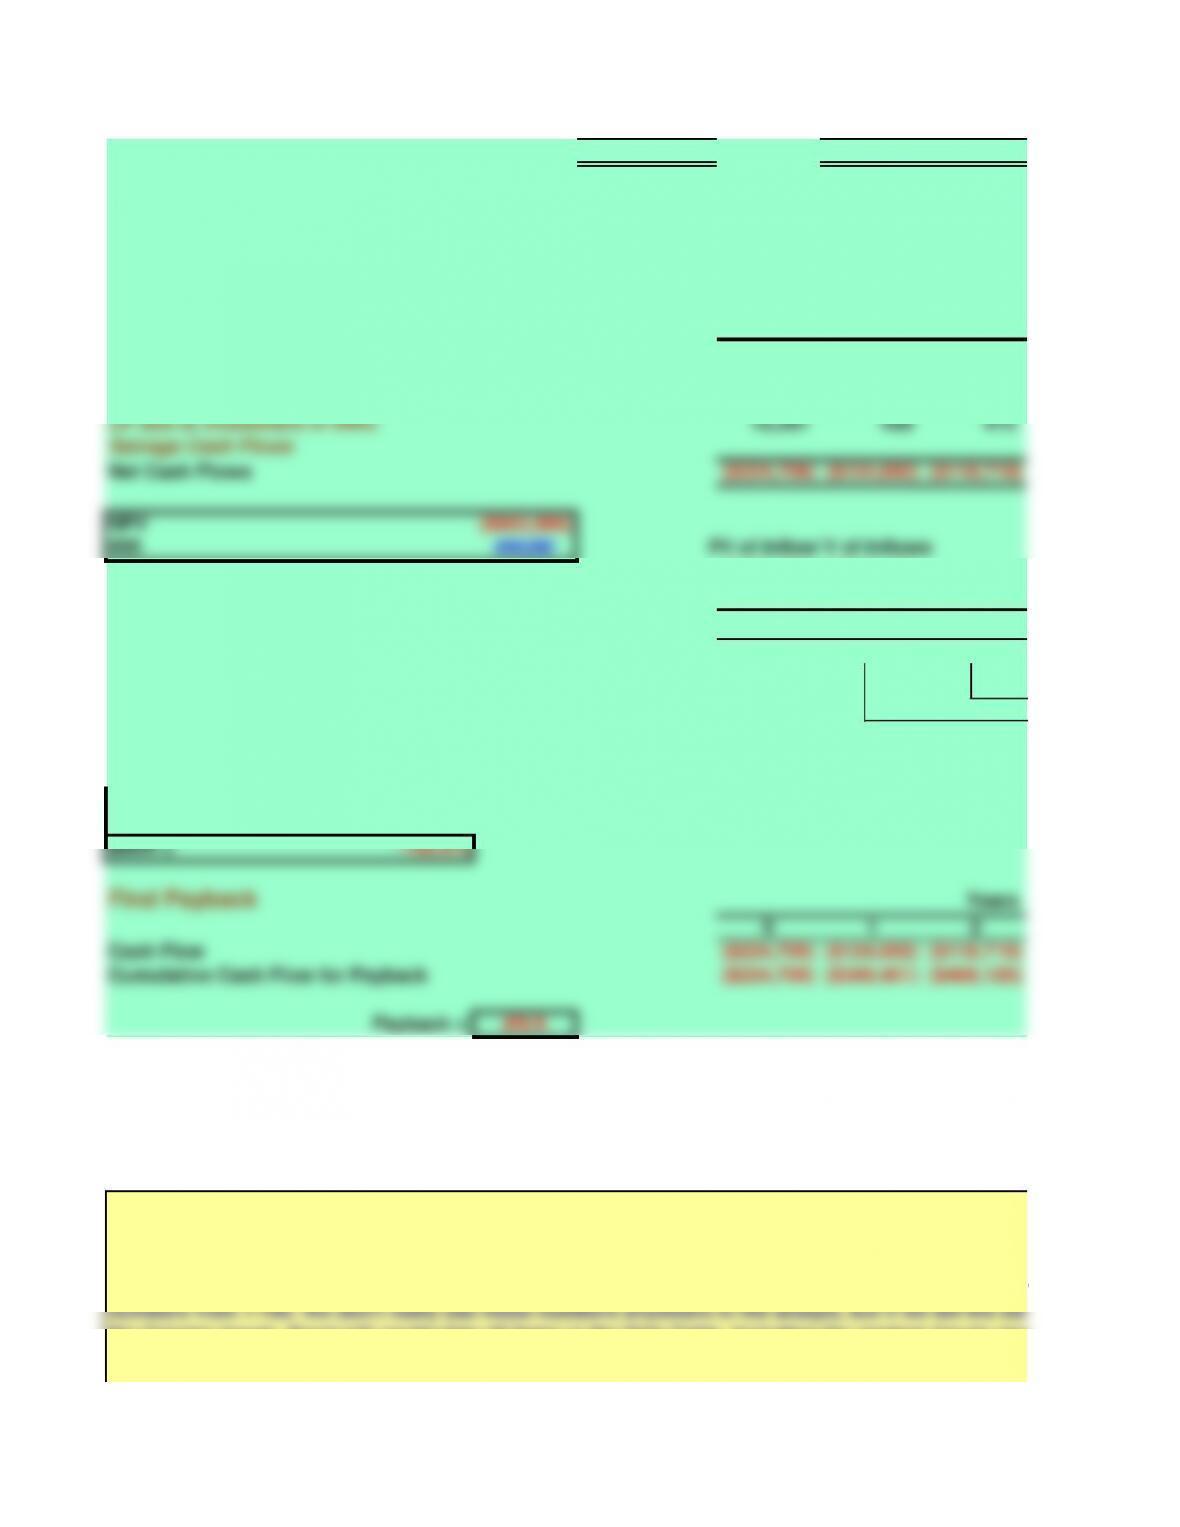
Projected Net Cash Flows
Year 0 Year 1 Year 2
Investment Outlay: Long Term Assets ($240,000)
Operating Cash Flows ($125,151) ($119,191)
CF due to investment in NWC 15,291 459 472
Salvage Cash Flows
Net Cash Flows ($224,709) ($124,692) ($118,719)
NPV ($663,986)
IRR #NUM!
PV of Inflows
TV of Inflows
($439,277) ($643,146)
Find MIRR 0 1 2
Net Cash Flows ($224,709) ($124,692) ($118,719)
PV= ($224,709)
MIRR = -100.0%
Find Payback
0 1 2
Cash Flow ($224,709) ($124,692) ($118,719)
Cumulative Cash Flow for Payback ($224,709) ($349,401) ($468,120)
Payback = #N/A
How the Simulation Works
We use a Data Table to perform the simulation (the Data Table is below, shaded bright yellow). When t
updated, it will insert new random variables for each of the inputs we allow to change in Panel A abov
Panel C above, and then save the NPV for each trial (we also save the input variables for each trial so t
they are behaving as we expect). We set the first column of the Data Table (the variable to be changed in
numbers from 1-100. We don’t really use these numbers anywhere in the analyis, but if we tell the Dat
the Column inputs, Excel will recalculate all items in the Data Table, including the random inputs and t
other words, we “trick” Excel into doing a simulation. We tell Excel to insert each of the Column input
the cell immediately below this box. This cell isn’t linked to anything else, but each time Excel updates a
g. Calculate the net cash flows for each year. Based on these cash flows and the average project cost o
project’s NPV, IRR, MIRR, PI, payback, and discounted payback? Do these indicators suggest that the project should be
undertaken?
Years
To find MIRR, we could now find the discount rate that equates the PV and TV. But it is easier to use th
Years
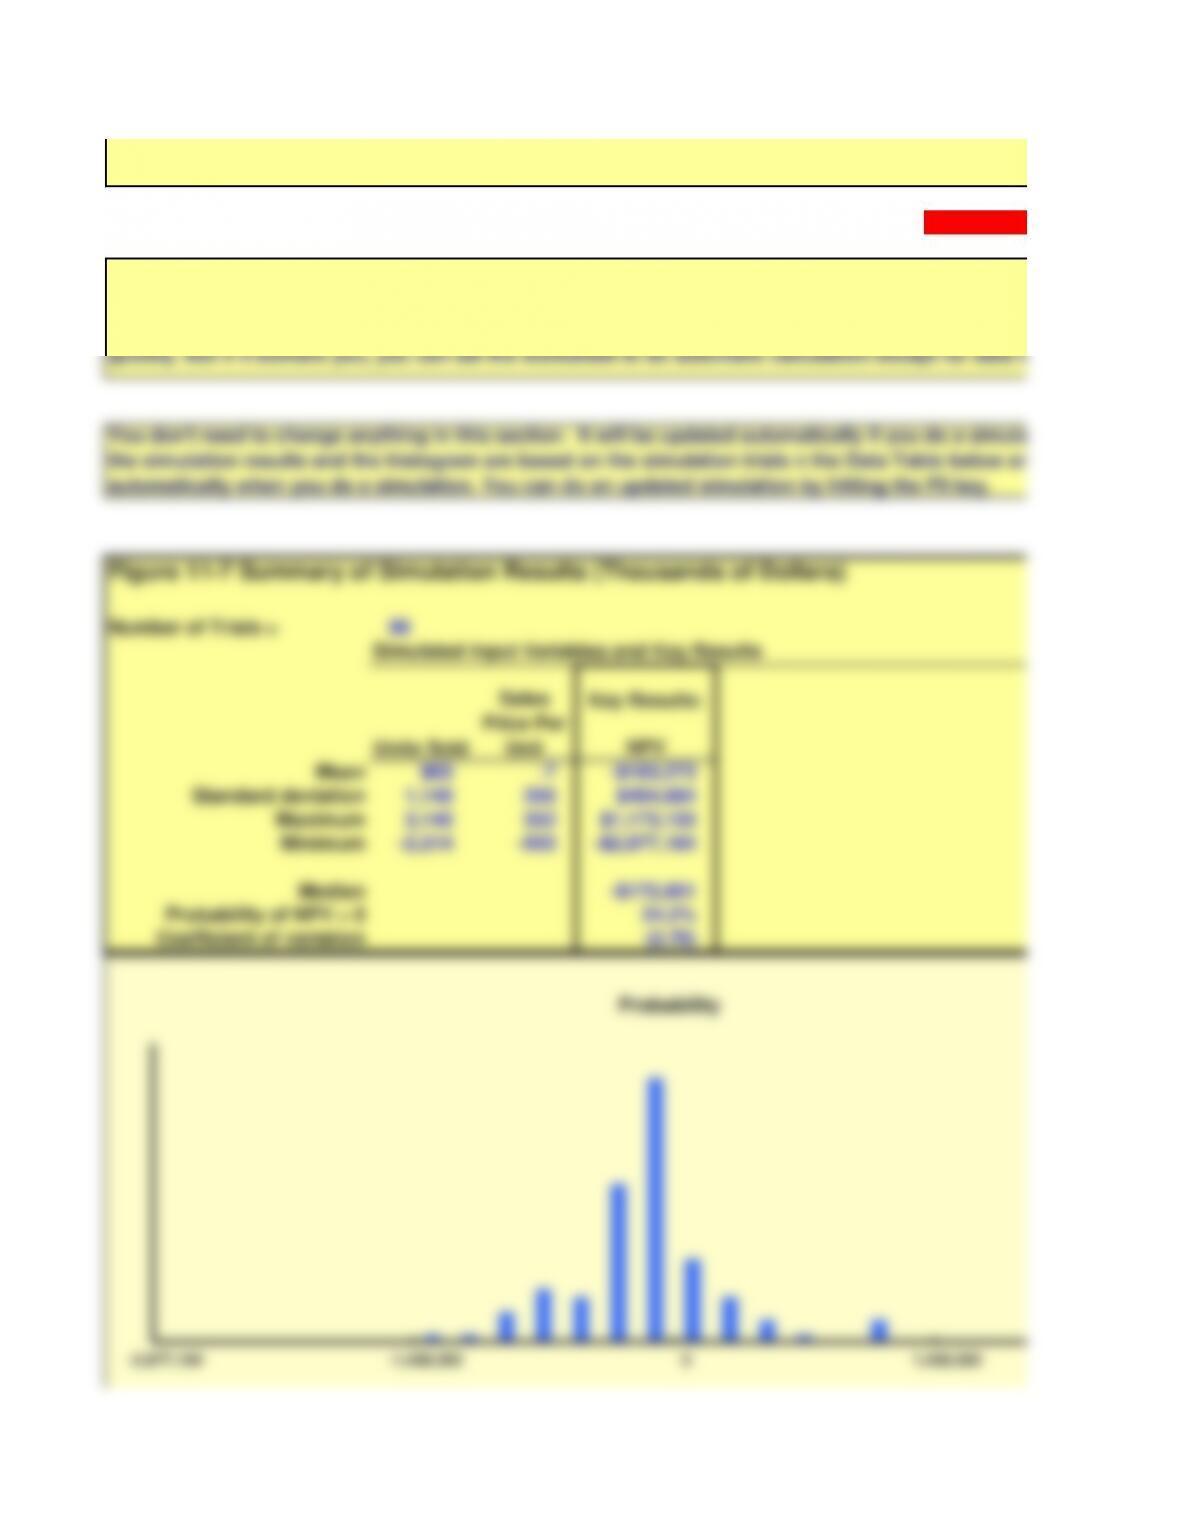
Column input cell to “trick” Excel into updating random variables in Data Table: 1
Number of Trials = 99
NPV
Mean $65 -7 -$183,273
Standard deviation 1,140 205 $494,684
Maximum 3,140 552 $1,173,103
Minimum -2,214 -503 -$2,877,184
Median -$172,851
Probability of NPV > 0 24.2%
Coefficient of variation (2.70)
Units Sold
Sales
Price Per
Unit
Simulated Input Variables and Key Results
Key Results:
You don’t need to change anything in this section. It will be updated automatically if you do a simulatio
the simulation results and the histogram are based on the simulation trials n the Data Table below and
automatically when you do a simulation. You can do an updated simulation by hitting the F9 key.
Figure 11-7 Summary of Simulation Results (Thousands of Dollars)
Excel normally updates all values in a Data Table each time any cell that is related to the Data Table c
have random variables in the Data Table, so each time any cell in the worksheet makes a calculation, th
updated. If the Data Table has many rows, updating it can take up to 20 or 30 seconds. With only 100 r
quickly. But if it bothers you, you can set the worksheet to do automatic calculation except for data tab
the cell immediately below this box. This cell isn’t linked to anything else, but each time Excel updates a
Table, all the random values will be updated.
-2,877,184 -1,438,592 0 1,438,592
Probability

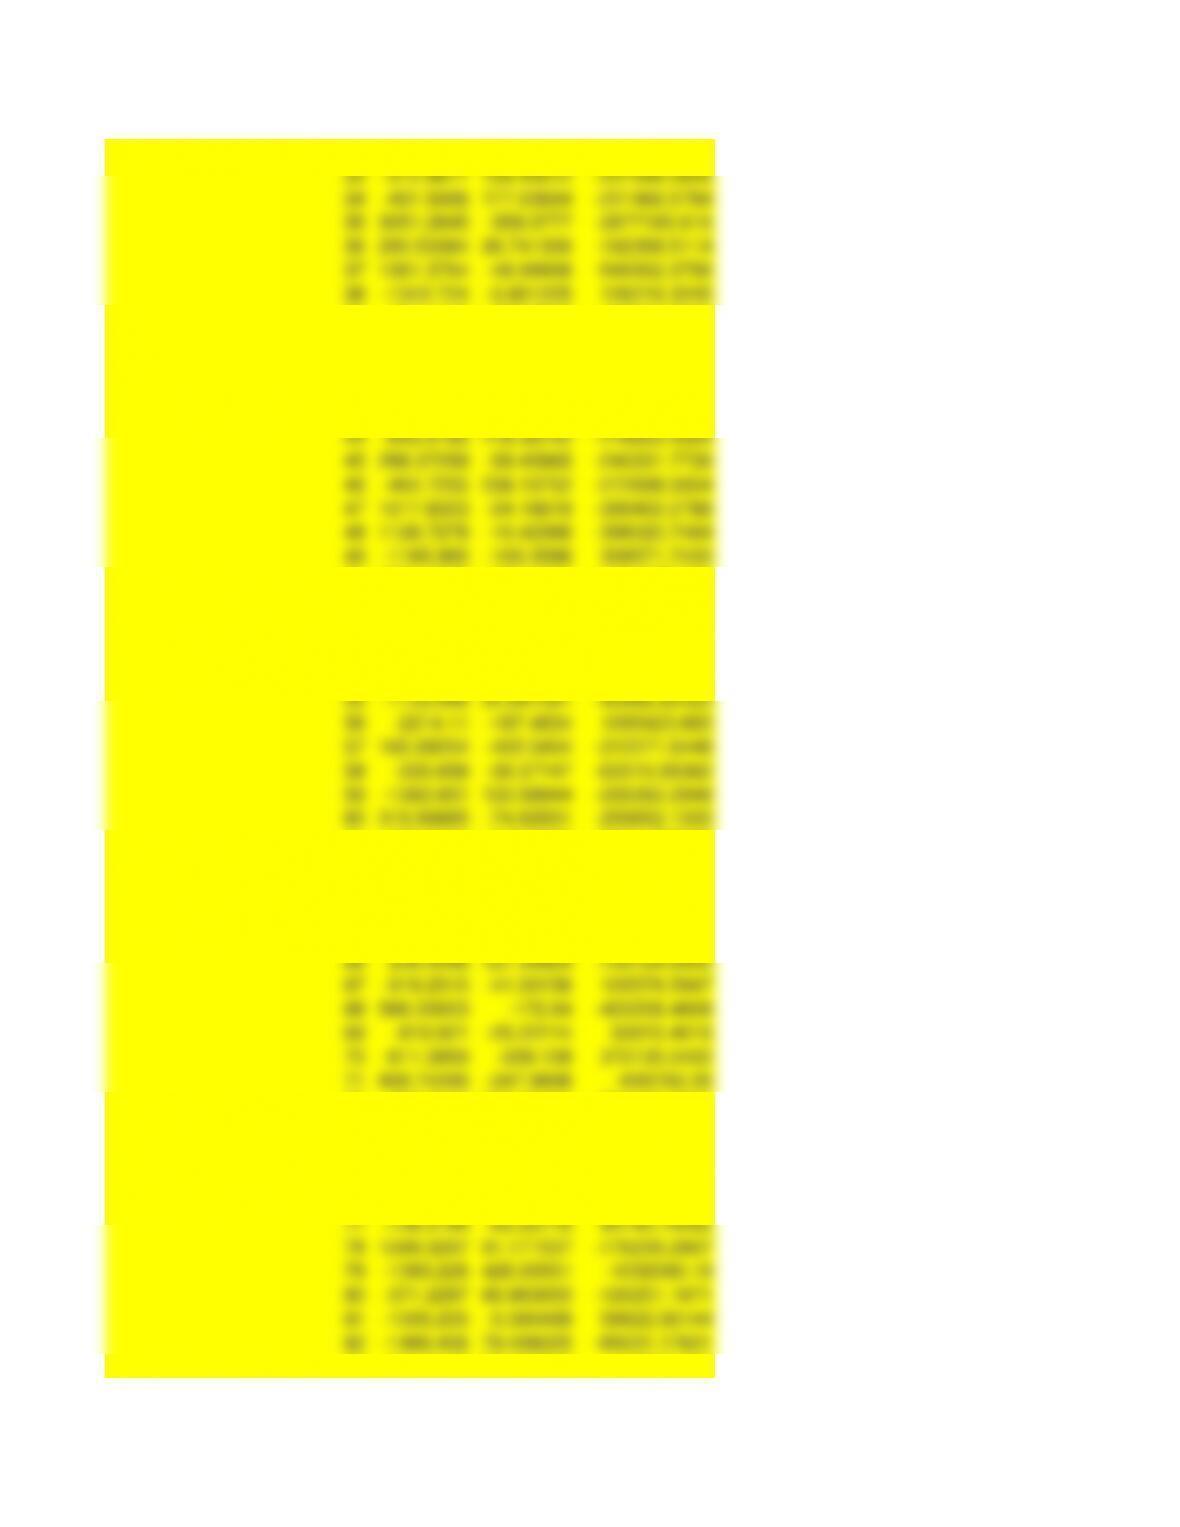
Output of Simulation in Data Table
Trial Number Units Sold
Sales
Price Per
Unit
NPV
1,345 ($95) ($663,986)
1 -1357.983 -187.8574 614898.0757
2 -930.5034 -111.3573 235878.2711
3166.06972 -502.67 -344944.515
4 -734.9891 22.429019 -36190.91031
5539.6038 -102.9465 -364735.2607
61.5705594 -67.83734 -150378.3582
7 -756.2016 118.06201 -173395.2469
8575.67868 -146.2061 -427478.4764
9 -485.1668 206.63383 -248437.6426
10 2673.7587 279.96948 774310.9465
11 -1581.565 -21.32976 229178.0115
12 105.50476 -7.477356 -172306.2774
13 -635.2593 102.60432 -150555.4811
14 -317.8318 153.06284 -181362.1886
15 2.0340518 -159.5238 -150893.6349
16 576.2056 386.49464 168540.1424
23 -2213.277 -17.78319 365325.6612
24 930.82887 -50.2184 -425179.9837
25 1427.7914 -99.32133 -708364.7238
26 240.68066 280.9724 -66201.08472
27 -846.3312 -61.99266 119825.0515
32 272.49991 -154.6384 -285735.6003
33 -512.9677 159.45012 -207068.0609
34 -491.5068 177.03694 -221466.5784
35 3051.2845 -358.0777 -2877183.616
36 290.53384 26.741306 -192358.5114
37 1361.3764 -48.99906 -549302.3756
38 -1342.724 -3.801225 126216.3245
45 288.37299 -59.45965 -240331.7739
46 -464.7255 238.10752 -272698.0054
47 1017.8323 -24.16619 -399402.2788
48 1126.7278 -10.42366 -396020.7464
49 -1165.965 -100.3566 308571.7433
56 -2214.11 -187.4834 1095423.683
57 165.69204 -402.5404 -312271.6448
58 -335.698 -30.37147 -63510.26362
59 -1262.651 122.58944 -200262.2948
60 319.90685 -74.62931 -259652.1333
67 -919.2515 -41.00156 105576.5947
68 568.33003 -172.84 -453339.4609
69 -810.921 -25.22114 50615.4016
70 -811.3959 -229.128 372135.0422
71 808.74396 -247.9898 -699782.39
78 1249.3297 91.171537 -176239.2807
79 -1393.228 428.00551 -1032080.19
80 -371.2297 60.983055 -120251.1671
81 -1005.205 -5.390489 59922.56144
82 -1480.406 79.498225 -85031.17621