Unlock document.
This document is partially blurred.
Unlock all pages and 1 million more documents.
Get Access
1
2
3
4
5
6
7
8
9
10
11
12
13
15
16
17
18
19
26
27
28
29
30
31
35
36
37
A B C D E F G H I J
10/28/2015
Situation
250 60 Franchise L
320 80
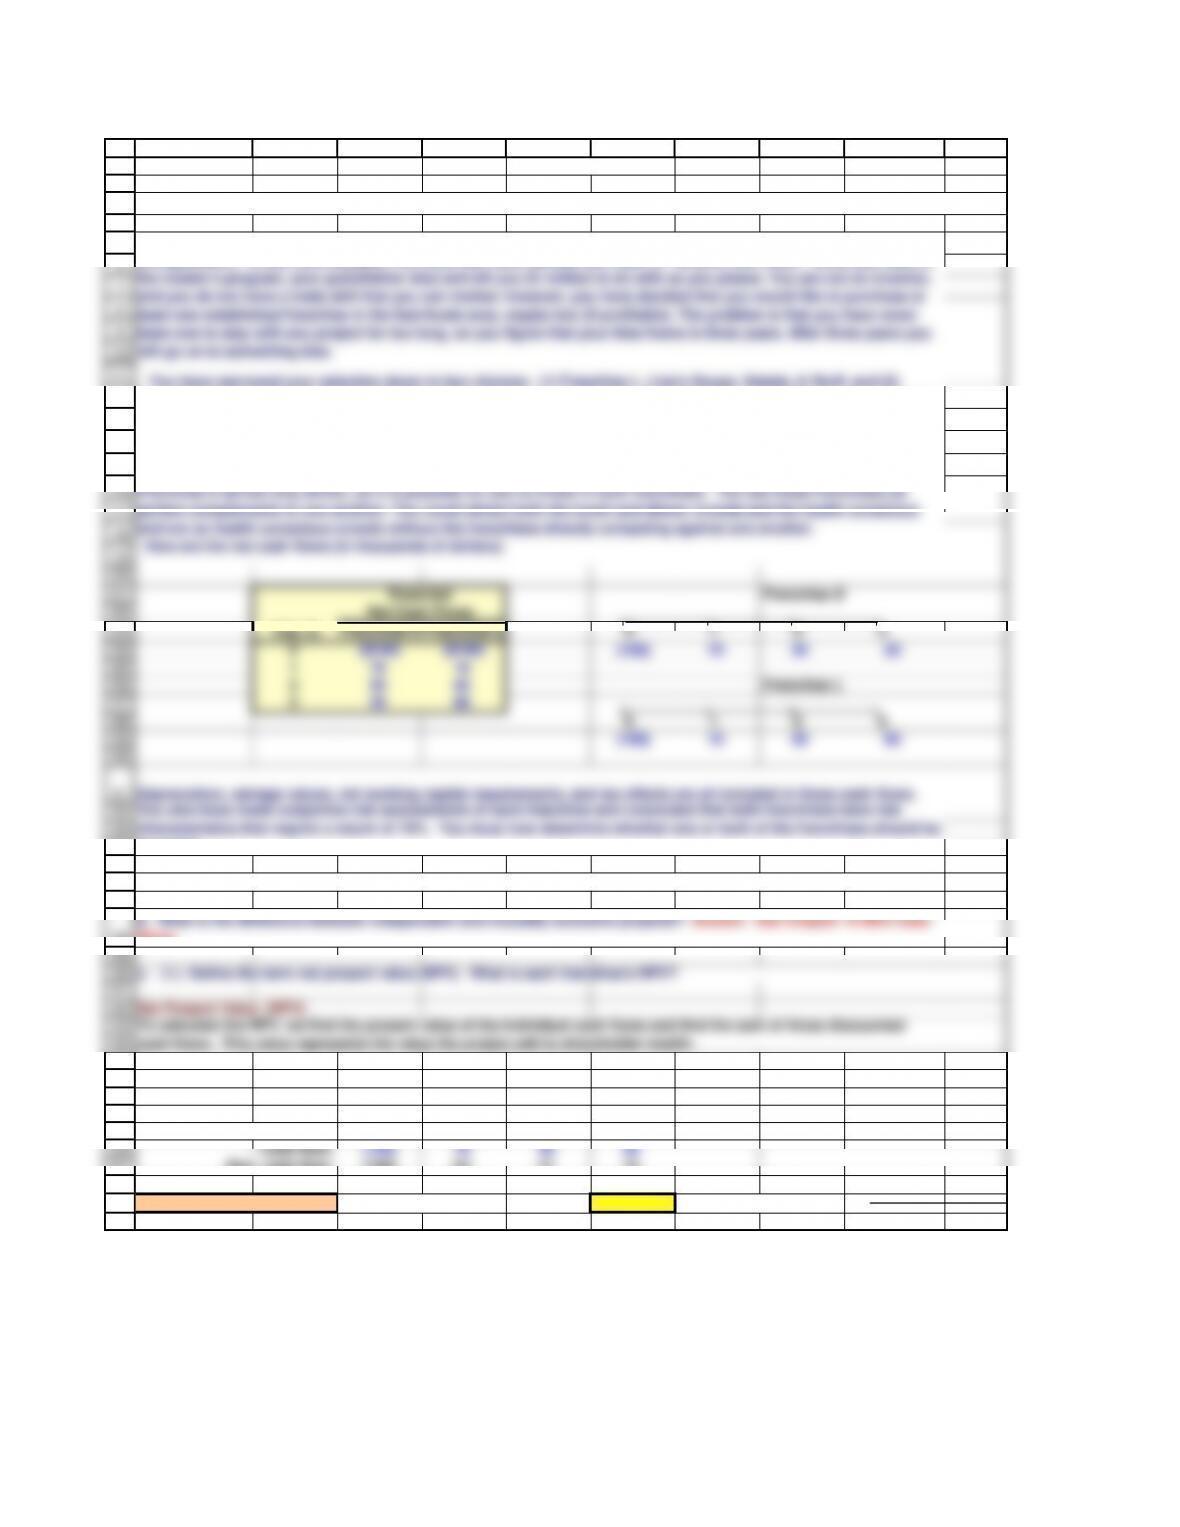
0 1 2 3
(100) 10 60 80
Depreciation, salvage values, net working capital requirements, and tax effects are all included in these cash flows.
a. What is capital budgeting? Answer: See Chapter 10 Mini Case Show
b. What is the difference between independent and mutually exclusive projects? Answer: See Chapter 10 Mini Case
Chapter 10. Mini Case
You have narrowed your selection down to two choices: (1) Franchise L, Lisa's Soups, Salads, & Stuff, and (2)
Franchise S, Sam's Fabulous Fried Chicken. The net cash flows shown below include the price you would receive for
selling the franchise in Year 3 and the forecast of how each franchise will do over the 3-year period. Franchise L's
cash flows will start off slowly but will increase rather quickly as people become more health conscious, while
Franchise S's cash flows will start off high but will trail off as other chicken competitors enter the marketplace and as
people become more health conscious and avoid fried foods. Franchise L serves breakfast and lunch, while
Franchise S serves only dinner, so it is possible for you to invest in both franchises. You see these franchises as
perfect complements to one another: You could attract both the lunch and dinner crowds and the health conscious
and not so health conscious crowds without the franchises directly competing against one another.
Here are the net cash flows (in thousands of dollars):
You have just graduated from the MBA program of a large university, and one of your favorite courses was "Today's
Entrepreneurs." In fact, you enjoyed it so much you have decided you want to "be your own boss." While you were in
the master's program, your grandfather died and left you $1 million to do with as you please. You are not an inventor,
and you do not have a trade skill that you can market; however, you have decided that you would like to purchase at
least one established franchise in the fast-foods area, maybe two (if profitable). The problem is that you have never
been one to stay with any project for too long, so you figure that your time frame is three years. After three years you
will go on to something else.
55
56
57
58
59
60
61
62
63
64
65
66
67
68
69
70
71
72
73
74
75
76
77
78
79
80
81
82
83
84
85
86
90
91
92
93
94
95
96
98
99
100
101
102
103
104
105
109
110
111
112
113
114
115
116
117
118
119
120
121
A B C D E F G H I J
Franchise L
Time period: 0 1 2 3
Cash flow: (100) 10 60 80
Disc. cash flow: (100) 9 50 60
NPV(L) = $18.78 $18.78 = Uses NPV function.
Internal Rate of Return (IRR)
Year (t)
Franchise S
Franchise L
0($100) ($100)
0($100) 0 123
140 (100) 40 40 40
240
340
IRR = 9.70% Note: You can use the Rate function if
payments are constant.
Similarity to a bond:
0 1 2 3 4 5 6 7 8 9
(1,134) 90 90 90 90 90 90 90 90 90
IRR = 7.08%
The NPV method of capital budgeting dictates that all independent projects that have positive NPV should accepted.
The rationale behind that assertion arises from the idea that all such projects add wealth, and that should be the
overall goal of the manager in all respects. If strictly using the NPV method to evaluate two mutually exclusive
projects, you would want to accept the project that adds the most value (i.e. the project with the higher NPV). Hence,
if considering the above two projects, you would accept both projects if they are independent, and you would only
accept Project S if they are mutually exclusive.
(3.) Would the NPVs change if the cost of capital changed? Answer: See Chapter 10 Mini Case Show
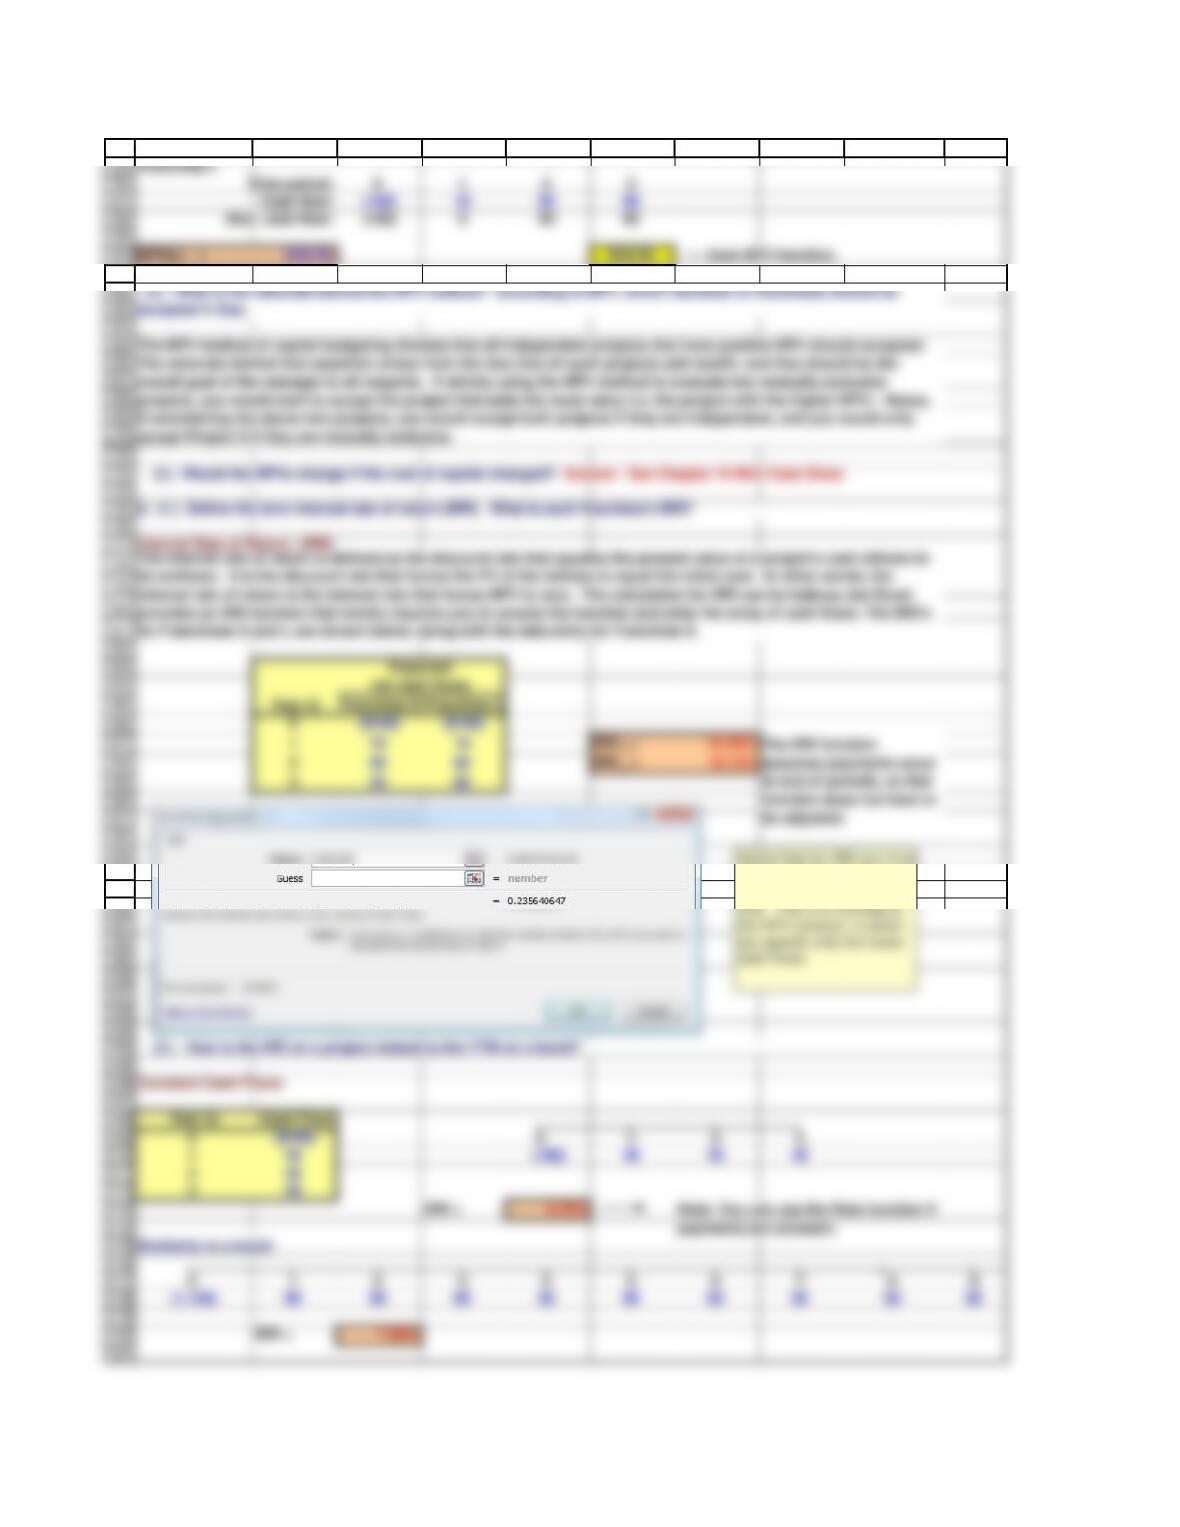
The internal rate of return is defined as the discount rate that equates the present value of a project's cash inflows to
its outflows. It is the discount rate that forces the PV of the inflows to equal the initial cost. In other words, the
internal rate of return is the interest rate that forces NPV to zero. The calculation for IRR can be tedious, but Excel
provides an IRR function that merely requires you to access the function and enter the array of cash flows. The IRR's
for Franchises S and L are shown below, along with the data entry for Franchise S.
d. (1.) Define the term internal rate of return (IRR). What is each franchise's IRR?
(2.) How is the IRR on a project related to the YTM on a bond?
net cash flows
(2.) What is the rationale behind the NPV method? According to NPV, which franchise or franchises should be
accepted if they
Expected
be adjusted.
Notice that for IRR you must
specify all cash flows,
including the time zero cash
flow. This is in contrast to
you specify only the future
cash flows.
122
123
124
125
126
127
128
129
130
131
132
133
134
135
143
144
145
146
147
148
149
150
151
152
153
154
155
156
157
158
159
160
161
162
163
164
165
166
167
168
169
170
171
172
173
174
175
176
177
178
179
180
181
182
A B C D E F G H I J
2% 35.53 2% 42.86
4% 31.32 4% 36.21
6% 27.33 6% 30.00
8% 23.56 8% 24.21
10% 19.98 10% 18.78
12% 16.60 12% 13.70
14% 13.38 14% 8.94
16% 10.32 16% 4.46
18% 7.40 18% 0.26
20% 4.63 20% (3.70)
22% 1.98 22% (7.43)
24% (0.54) 24% (10.95)
f. What is the underlying cause of ranking conflicts between NPV and IRR?
The IRR method of capital budgeting maintains that projects should be accepted if their IRR is greater than the cost of
capital. Strict adherence to the IRR method would further dictate that mutually exclusive projects should be chosen
on the basis of the greatest IRR. In this scenario, both franchises have IRRs that exceed the cost of capital (10%) and
both should be accepted, if they are independent. If, however, the franchises are mutually exclusive, we would
choose Franchise S. Recall, that this was our determination using the NPV method as well. The question that
naturally arises is whether or not the NPV and IRR methods will always arrive at the same conclusion.
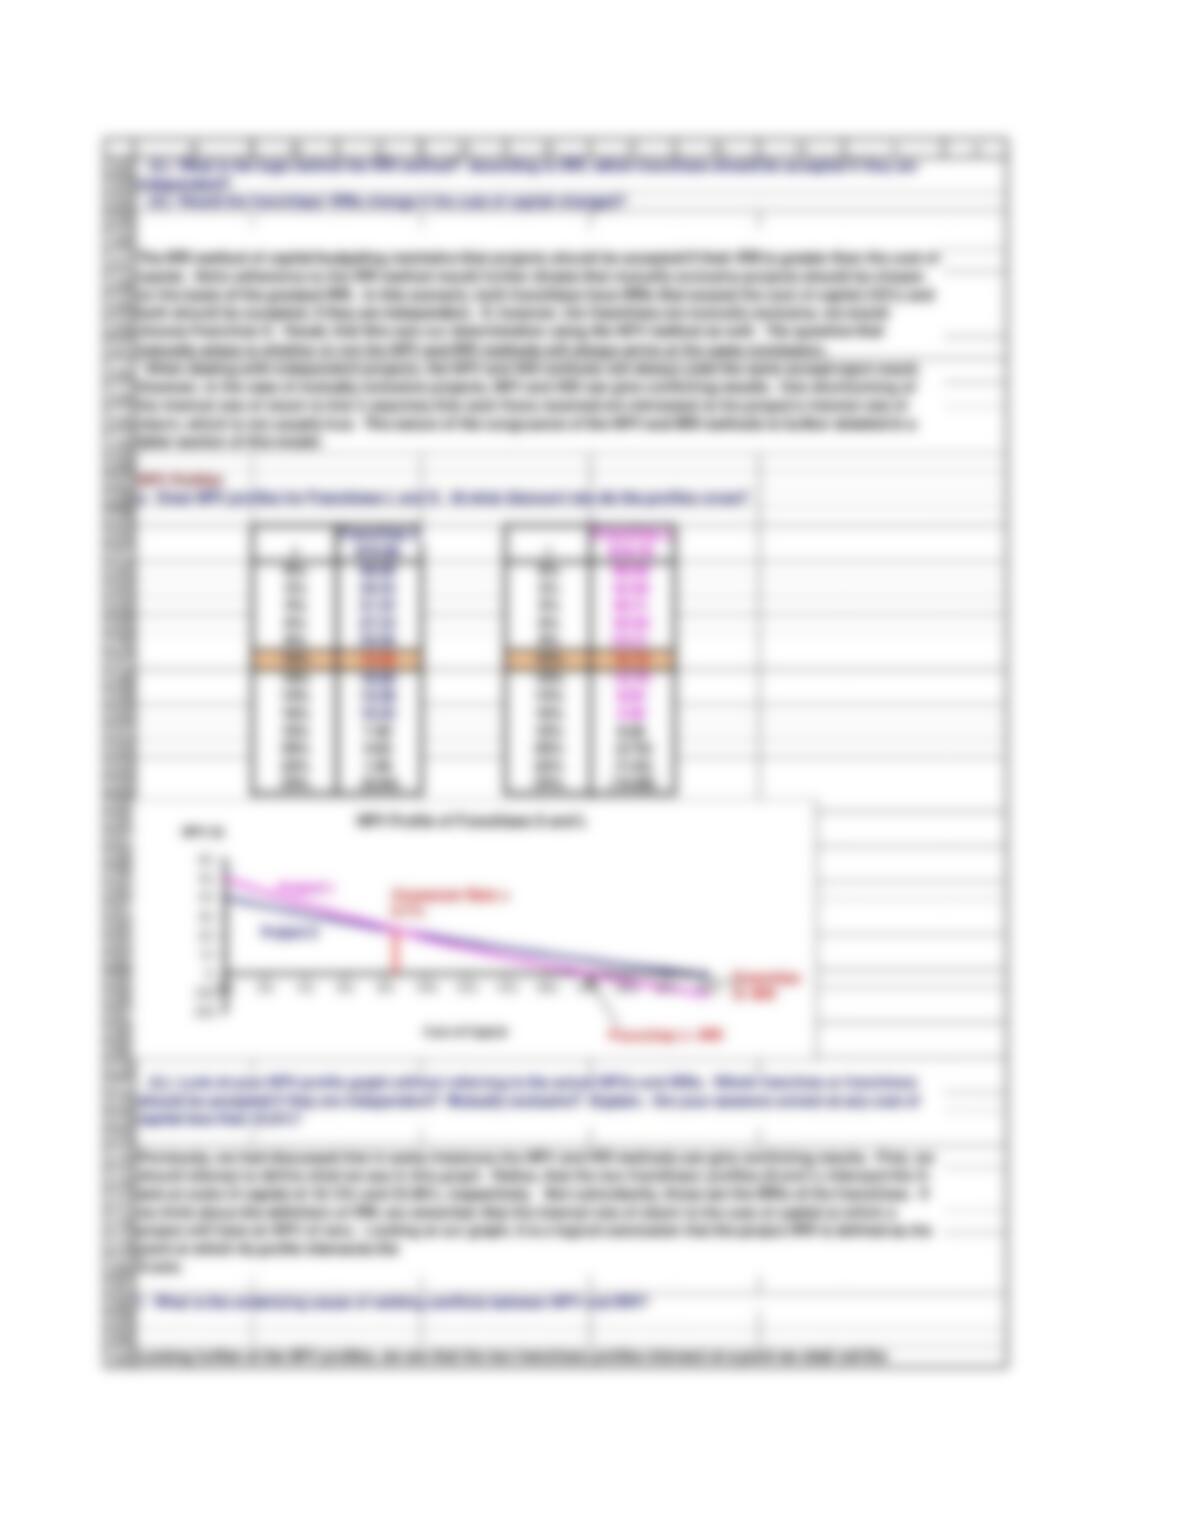
Previously, we had discussed that in some instances the NPV and IRR methods can give conflicting results. First, we
should attempt to define what we see in this graph. Notice, that the two franchises' profiles (S and L) intersect the X-
axis at costs of capital of 18.13% and 23.56%, respectively. Not coincidently, those are the IRRs of the franchises. If
we think about the definition of IRR, we remember that the internal rate of return is the cost of capital at which a
project will have an NPV of zero. Looking at our graph, it is a logical conclusion that the project IRR is defined as the
point at which its profile intersects the
X-axis.
(4.) Would the franchises' IRRs change if the cost of capital changed?
(2.) Look at your NPV profile graph without referring to the actual NPVs and IRRs. Which franchise or franchises
should be accepted if they are independent? Mutually exclusive? Explain. Are your answers correct at any cost of
capital less than 23.6%?
When dealing with independent projects, the NPV and IRR methods will always yield the same accept/reject result.
However, in the case of mutually exclusive projects, NPV and IRR can give conflicting results. One shortcoming of
the internal rate of return is that it assumes that cash flows received are reinvested at the project's internal rate of
return, which is not usually true. The nature of the congruence of the NPV and IRR methods is further detailed in a
latter section of this model.
(3.) What is the logic behind the IRR method? According to IRR, which franchises should be accepted if they are
independent?
(20)
(10)
0
10
20
30
40
50
60
0% 2% 4% 6% 8% 10% 12% 14% 16% 18% 20% 22% 24%
NPV ($)
Cost of Capital
NPV Profile of Franchises S and L
Project L
Project S
Franchise L- IRR
Franchise
S- IRR
Crossover Rate =
8.7%
186
187
188
189
190
191
192
193
194
195
196
197
198
199
200
201
202
203
204
205
206
207
208
212
213
214
215
216
217
218
A B C D E F G H I J
Cash Flow
Year (t)
Franchise S
Franchise L Differential
0($100) ($100) 0
170 10 60
250 60 (10)
320 80 (60)
IRR = Crossover rate = 8.68%
Modified Internal Rate of Return (MIRR)
The modified internal rate of return is the discount rate that causes a project's cost (or cash outflows) to equal the
present value of the project's terminal value. The terminal value is defined as the sum of the future values of the
project's cash inflows, compounded at the project's cost of capital. To find MIRR, calculate the PV of the outflows
g. Define the term modified IRR (MIRR). Find the MIRRs for Franchises L and S.
Expected
Net Cash Flows
The intuition behind the relationship between the NPV profile and the crossover rate is as follows: (1) Distant cash
flows are heavily penalized by high discount rates--the denominator is (1 + r)t, and it increases geometrically; hence, it
gets very large at high values of t. (2) Long-term projects like L have most of their cash flows coming in the later
crossover rate. We observe that at costs of capital greater than the crossover rate, the franchise with the greater IRR
(Franchise S, in this case) also has the greater NPV. But at costs of capital less than the crossover rate, the franchise
with the lesser IRR has the greater NPV. This relationship is the source of discrepancy between the NPV and IRR
methods. By looking at the graph, we see that the crossover rate appears to occur at approximately 8.7%. Luckily,
there is a more precise way of determining the crossover rate. To find the crossover rate, we will find the difference
between the two franchises' cash flows in each year, and then find the IRR of this series of differential cash flows.
This IRR is the crossover rate.
236
237
238
239
240
241
242
243
244
245
246
247
249
250
251
253
254
255
256
258
259
260
261
262
263
264
265
266
267
269
270
271
272
273
274
275
276
277
278
279
281
282
283
284
285
286
287
288
289
290
291
292
293
294
295
296
297
298
299
300
301
302
A B C D E F G H I J
PROFITABILITY INDEX
h. What does the profitability index (PI) measure? What are the PI's for Franchises S and L?
For Franchise S:
PI(S) = PV of future cash flows ÷Initial cost
PI(S) = $119.98 ÷$100
PI(S) = 1.1998
PI(L) = PV of future cash flows ÷Initial cost
PI(L) = $118.78 ÷$100
PI(L) = 1.1878
i. (1.) What is the payback period? Find the paybacks for Franchises L and S.
Payback Period
Franchise S
Time period: 0 1 2 3
Cash flow: (100) 70 50 20
Cumulative cash flow: (100) (30) 20 40
—1.60 —
Alternative calcuation using the Excel PERCENTRANK function
Payback: 1.600
Franchise L
Time period: 0 1 2 3
Cash flow: (100) 10 60 80
Cumulative cash flow: (100) (90) (30) 50
Payback: 2.375
Discounted Payback Period
r = 10%
Franchise S
Time period: 0 1 2 3
Cash flow: (100) 70 50 20
Disc. cash flow: (100) 64 41 15 Cash Flows Discounted ba
Disc. cum. cash flow: (100) (36) 5 20
The profitability index is the present value of all future cash flows divided by the intial cost. It measures the PV per
dollar of investment.
Discounted payback period uses the project's cost of capital to discount the expected cash flows. The calculation of
discounted payback period is identical to the calculation of regular payback period, except you must base the
calculation on a new row of discounted cash flows. Note that both projects have a cost of capital of 10%.
(3.) What is the difference between the regular and discounted payback periods?
inflows exceed the initial cash outflows. That is the payback year. Then we take the previous year and add to it the
fraction calculated as the unrecovered balance at the end of that year divided by the following year's cash flow.
Generally speaking, the shorter the payback period, the better the investment.
(2.) What is the rationale for the payback method? According to the payback criterion, which franchise or
franchises should
be accepted if the firm's maximum acceptable payback is 2 years, and if Franchise L and S are independent? If
See the discussion on the PERCENTRANK function in the
Toolkit for this Chapter. Note that if cash flows are
nonnormal, the PERCENTRANK function will not always give
correct result. In that case, use the onger procedure shown
above.
Intermediate calculation to
identify payback:

303
304
305
A B C D E F G H I J
Discounted Payback: 1.9

306
307
308
309
310
311
312
313
314
315
316
317
318
319
320
321
322
323
324
325
326
327
328
329
330
331
332
333
334
335
336
337
338
339
340
341
342
343
344
345
346
347
348
349
350
351
352
353
354
355
356
A B C D E F G H I J
Franchise L
Time period: 0 1 2 3 4
Cash flow: (100) 10 60 80 0
Disc. cash flow: (100) 9 50 60 0
Disc. cum. cash flow: (100) (91) (41) 19 19
Discounted Payback: 2.7
Multiple IRRs
Project M: 0 1 2
(800) 5,000 (5,000)
The project is estimated to be of average risk, so its cost of capital is 10%.
(2.) What is Project P's NPV? What is its IRR? Its MIRR?
NPVM = ($386.78)
IRR M
1 = 25.0% MIRR = 5.6%
IRR M
2 = 400% =IRR(C326:E326,200%)
012
(800.0) 5,000 (5,000)
(4.) What is the main disadvantage of discounted payback? Is the payback method of any real usefulness in capital
budgeting
The inherent problem with both paybacks is that they ignore cash flows that occur after the payback period mark and
neither provides a specific acceptance rule. While the discounted method accounts for timing issues (to some
extent), it still falls short of fully analyzing projects. However, all else equal, these two methods do provide some
information about projects' liquidity and risk.
(1.) What are normal and nonnormal cash flows? Answer: See Chapter 10 Mini Case Show
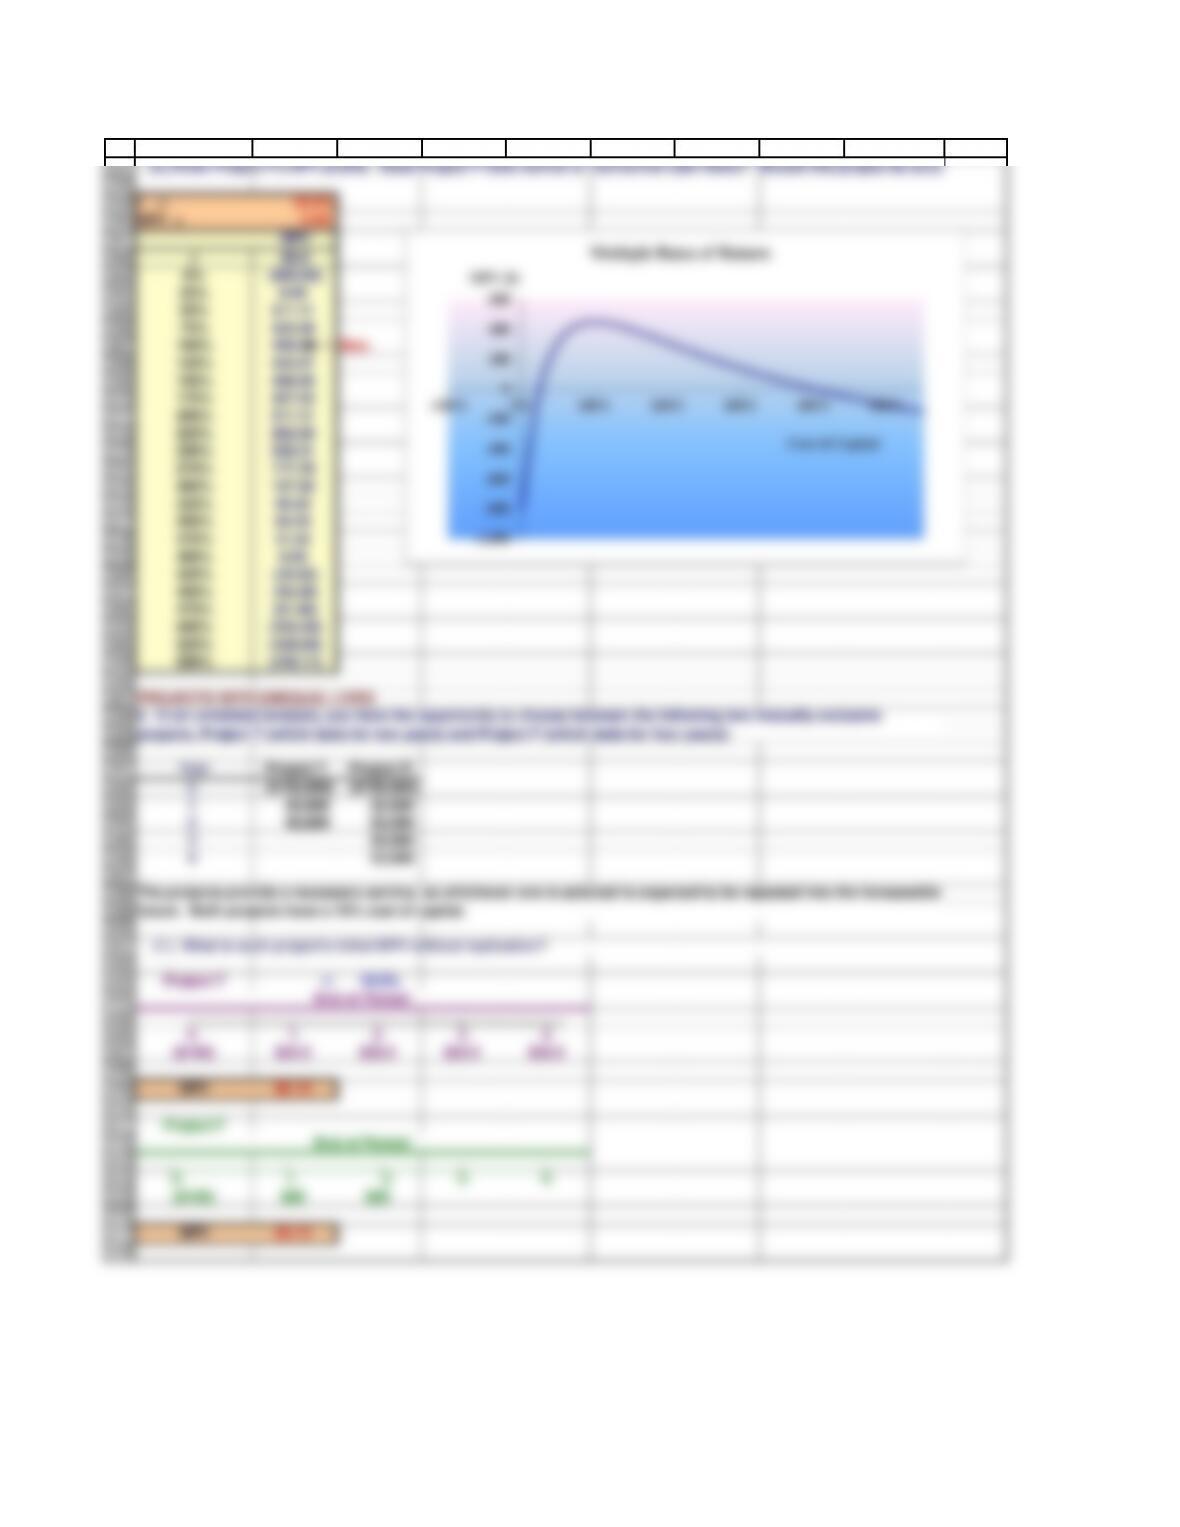
We will solve this IRR twice, the first time using the default guess of 10%, and the second time we will enter a guess of
200%. Notice, that the first IRR calculation is exactly as it was above.
The two solutions to this problem tell us that this project will have a positive NPV for all costs of capital between 25%
and 400%. We illustrate this point by creating a data table and a graph of the project NPVs.
j. As a separate project (Project P), you are considering sponsoring a pavilion at the upcoming World's Fair. The
pavilion would cost $800,000, and it is expected to result in $5 million of incremental cash inflows during its 1 year of
operation. However, it would then take another year, and $5 million of costs, to demolish the site and return it to its
original condition. Thus, Project P's expected net cash flows look like this (in thousands of dollars):
357
358
359
360
361
362
363
364
365
366
367
368
369
370
371
372
373
374
375
376
377
378
379
380
381
382
383
384
385
386
387
388
389
390
391
392
393
394
395
396
397
398
399
400
401
402
403
404
405
406
407
408
409
410
411
412
413
414
415
416
417
418
A B C D E F G H I J
r = 25.0%
NPV = 0.00
NPV
r$0.0
0% (800.00)
25% 0.00
50% 311.11
75% 424.49
100% 450.00 Max.
125% 434.57
150% 400.00
175% 357.02
200% 311.11
225% 265.09
250% 220.41
275% 177.78
300% 137.50
325% 99.65
350% 64.20
375% 31.02
400% 0.00
425% (29.02)
450% (56.20)
475% (81.66)
500% (105.56)
525% (128.00)
550% (149.11)
PROJECTS WITH UNEQUAL LIVES
Year Project T Project R
0($100,000) ($100,000)
160,000 33,500
260,000 33,500
333,500
433,500
Project T r: 10.0%
0 1 2 3 4
($100) $33.5 $33.5 $33.5 $33.5
NPV $6.19
Project F
0 1 2 3 4
($100) $60 $60
NPV $4.13
(1.) What is each project’s initial NPV without replication?
The projects provide a necessary service, so whichever one is selected is expected to be repeated into the foreseeable
future. Both projects have a 10% cost of capital.
(3.) Draw Project P's NPV profile. Does Project P have normal or nonnormal cash flows? Should this project be accept
k. In an unrelated analysis, you have the opportunity to choose between the following two mutually exclusive
projects, Project T (which lasts for two years) and Project F (which lasts for four years):
End of Period:
End of Period:
-1,000
-800
-600
-400
-200
0
200
400
600
-100% 0% 100% 200% 300% 400% 500%
NPV ($)
Cost of Capital
Multiple Rates of Return
419
420
421
422
423
424
425
426
427
428
429
430
431
432
434
435
438
439
440
441
442
443
444
445
446
447
448
450
451
452
453
454
455
456
457
458
459
460
461
462
463
464
465
466
467
468
469
470
471
472
473
474
475
476
A B C D E F G H I J
Equivalent Annual Annuity (EAA) Approach
Here are the steps in the EAA approach.
1. Find the NPV of each project over its initial life (we already did this in our previous analysis).
NPVC = $6.19
NPVR = $4.13
2. Convert the NPV into an annuity payment with a life equal to the life of the project.
EAAT = $1.95 Note: we used Excel's PMT function by using the function wizard.
EAAF = $2.38
Project T
($100) $60 $60
($100) $60 $60
($100) $60 ($40) $60 $60
NPV $7.55
Project T
0 1 2 3
($100) $60 $60
($105) $60 $60
($100) $60 ($45) $60 $60
NPV $3.42
ECONOMIC LIFE VS. PHYSICAL LIFE
Year
Operating
Cash Flow
Salvage
Value
0($5,000) $5,000
1$2,100 $3,100
2$2,000 $2,000
3$1,750 $0
3-Year NPV =
Initial Cost +
PV of
Operating
Cash Flow
+
PV of
Salvage
Value
=($5,000.00) +$4,876.78 +$0.00
3-Year NPV = ($123.22)
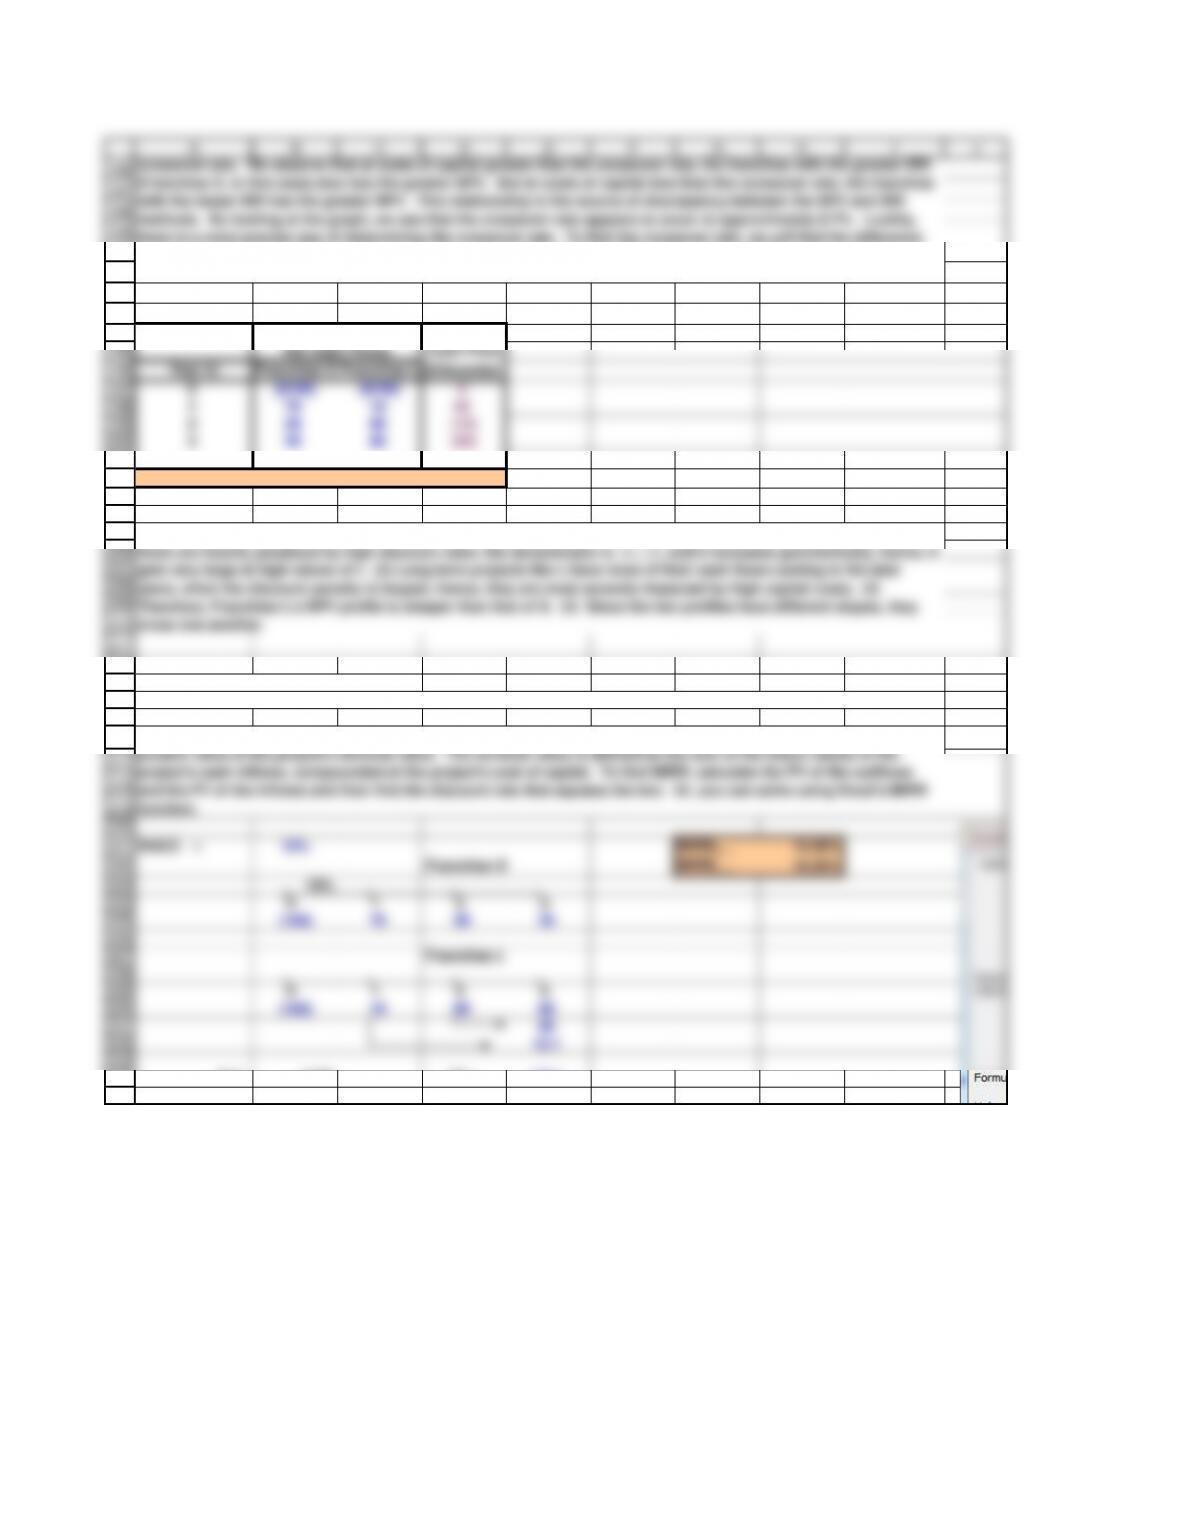
l. You are also considering another project which has a physical life of 3 years; that is, the machinery will be totally
worn out after 3 years. However, if the project were terminated prior to the end of 3 years, the machinery would have
a positive salvage value. Here are the project’s estimated cash flows:
The asset has a negative NPV if it is kept for three years. But even though the asset will last three years, it might be
better to operate the asset for either one or two years, and then salvage it.
(1.) Using the 10% cost of capital, what is the project's NPV If it is operated for the full 3 years?
End of Period:
End of Period:
(2.) What is each project’s equivalent annual annuity?
(4.) Now assume that the cost to replicate Project T in 2 years will increase to $105,000 because of inflationary
pressures.
(3.) Now apply the replacement chain approach to determine the projects’ extended NPVs. Which project should be
chosen?
482
483
484
485
486
487
488
489
490
A B C D E F G H I J
1-Year NPV =
Initial Cost +
PV of
Operating
+
PV of
Salvage
=($5,000.00) +$1,909.09 +$2,818.18
1-Year NPV = ($272.73)
The project's NPV will only be positive when it is operated for 2 years. Therefore, the project's economic life is 2 years.
(4.) What is the project’s optimal (economic) life?
(3.) At the end of Year 1?


