Unlock document.
This document is partially blurred.
Unlock all pages and 1 million more documents.
Get Access
Solution 7/16/2015
Chapter: 25
Problem: 7
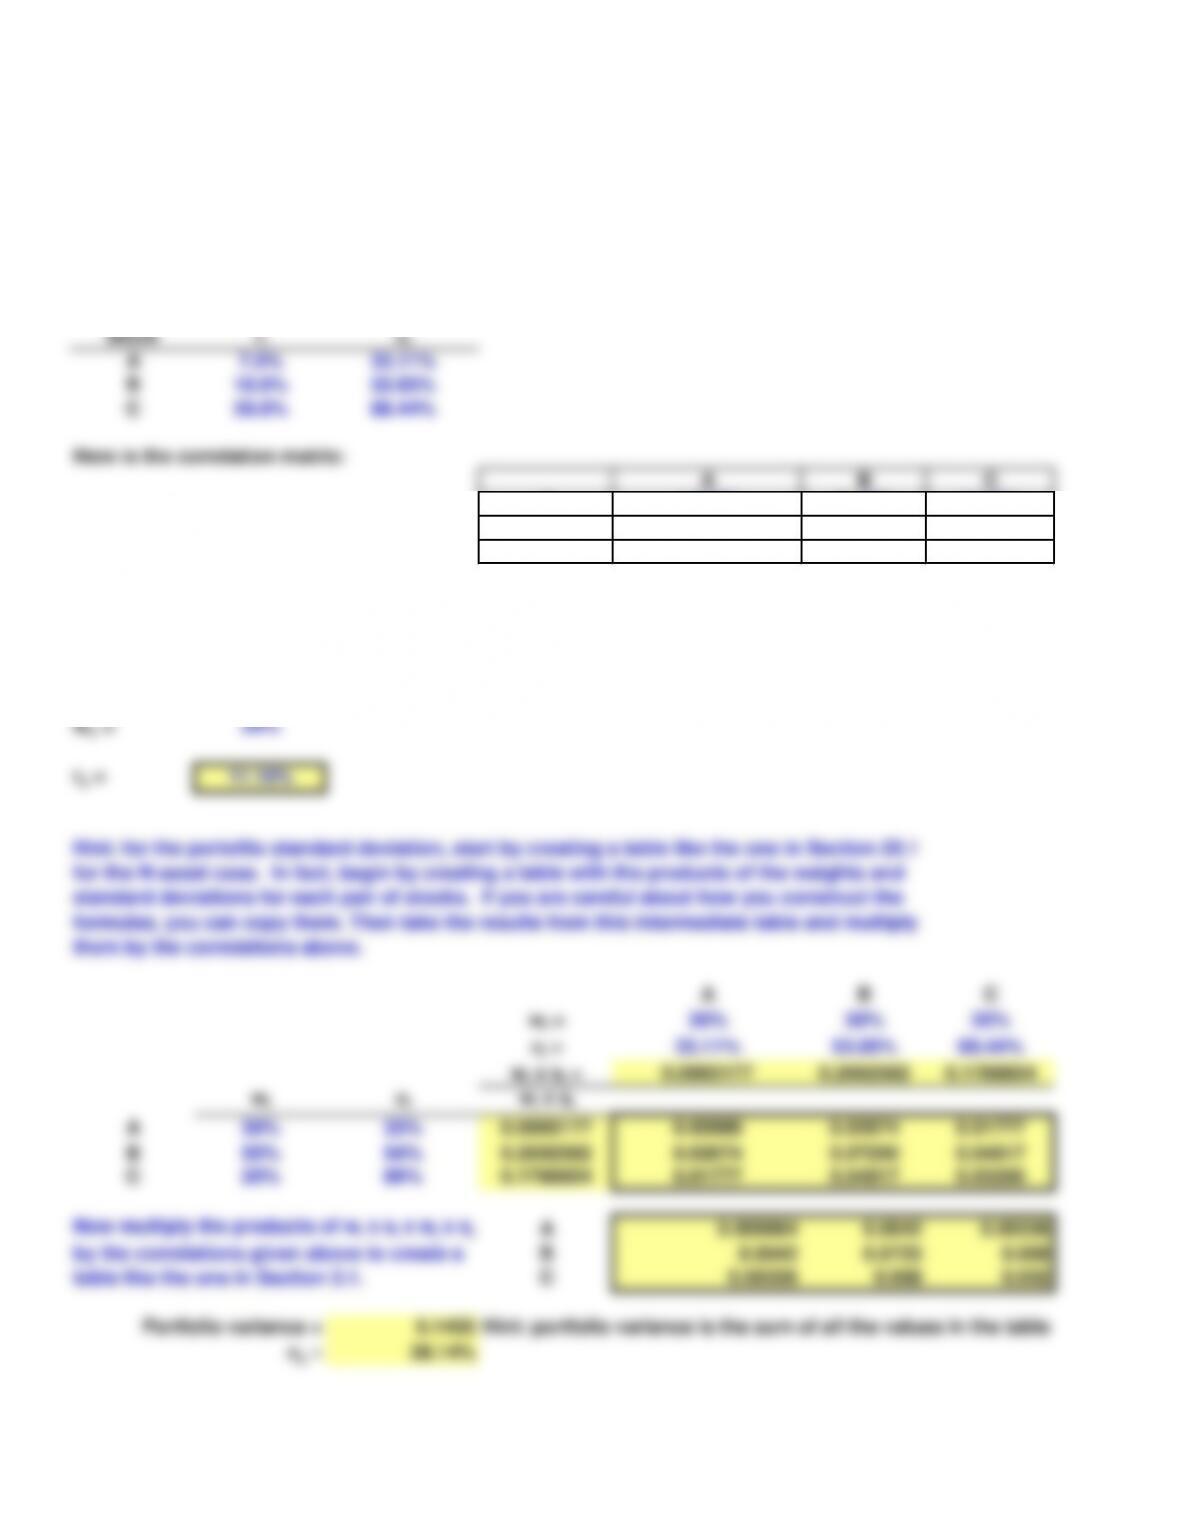
Here are the expected returns and standard deviations for stocks A, B, and C:
Stock
risi
A7.0% 33.11%
B10.0% 53.85%
C20.0% 89.44%
Here is the correlation matrix:
A B C
A1.0000 0.1571 0.1891
B0.1571 1.0000 0.1661
C0.1891 0.1661 1.0000
wA = 30%
wB = 50%
wC = 20%
rp = 11.10%
A B C
wi = 30% 50% 20%
si = 33.11% 53.85% 89.44%
wi x si = 0.0993177 0.2692582 0.1788854
wisiwi x si
A30% 33% 0.0993177 0.00986 0.02674 0.01777
B50% 54% 0.2692582 0.02674 0.07250 0.04817
C20% 89% 0.1788854 0.01777 0.04817 0.03200
A0.009864 0.0042 0.00336
B0.0042 0.0725 0.008
C0.00336 0.008 0.032
Portfolio variance = 0.1455 Hint: portfolio variance is the sum of all the values in the table immediately above.
sp = 38.14%
Following is information for the required returns and standard deviations of returns for A, B,
a. Suppose a portfolio has 30 percent invested in A, 50 percent in B, and 20 percent in C.
What are the expected return and standard deviation of the portfolio?
Now multiply the products of wi x si x wj x sj
by the correlations given above to create a
table like the one in Section 3.1.
Hint: for the portoflio standard deviation, start by creating a table like the one in Section 25.1
for the N-asset case. In fact, begin by creating a table with the products of the weights and
standard deviations for each pair of stocks. If you are careful about how you construct the
formulas, you can copy them. Then take the results from this intermediate table and multiply
them by the correlations above.
Portoflio #
wA wB wC Variance sp rp
10.0 0.0 1.0 0.8000 89.44% 20.00%
20.0 0.1 0.9 0.6653 81.57% 19.00%
30.0 0.2 0.8 0.5492 74.11% 18.00%
40.0 0.3 0.7 0.4517 67.21% 17.00%
50.0 0.4 0.6 0.3728 61.06% 16.00%
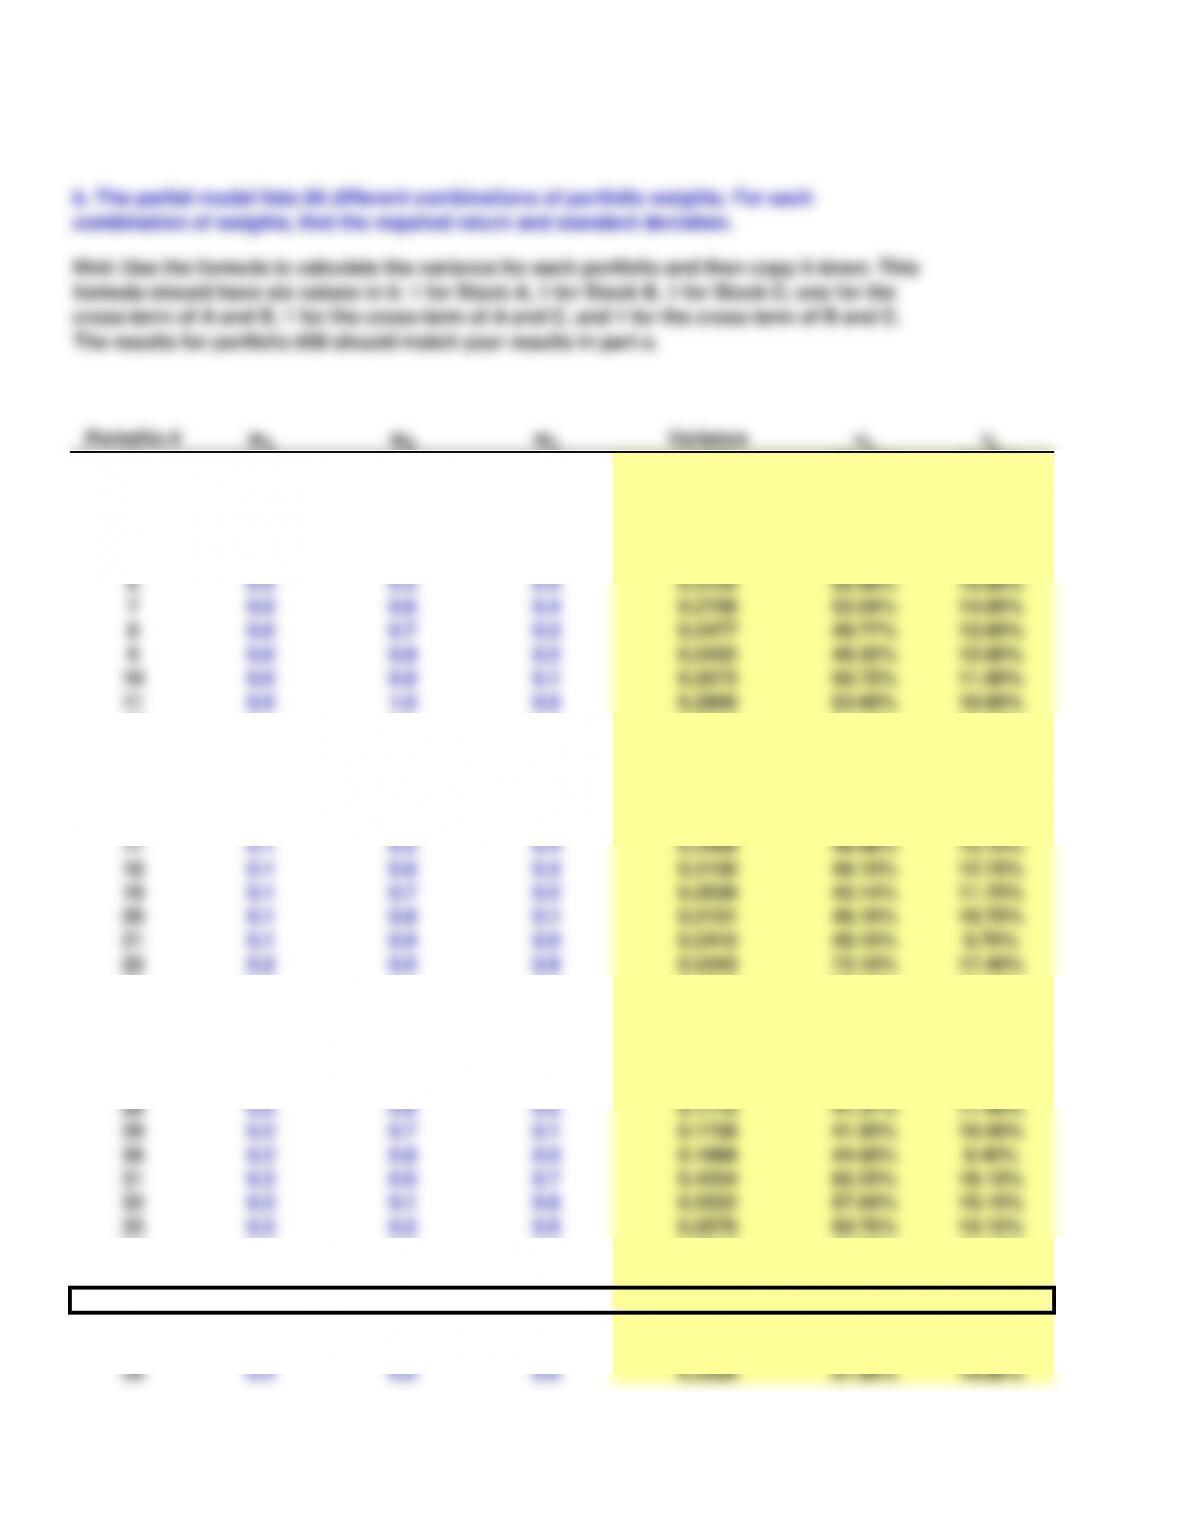
b. The partial model lists 66 different combinations of portfolio weights. For each
combination of weights, find the required return and standard deviation.
Hint: Use the formula to calculate the variance for each portfolio and then copy it down. This
formula should have six values in it: 1 for Stock A, 1 for Stock B, 1 for Stock C, one for the
cross-term of A and B, 1 for the cross-term of A and C, and 1 for the cross term of B and C.
The results for portfolio #36 should match your results in part a.
40 0.4 0.1 0.5 0.2531 50.31% 13.80%
41 0.4 0.2 0.4 0.1923 43.86% 12.80%
42 0.4 0.3 0.3 0.1502 38.76% 11.80%
43 0.4 0.4 0.2 0.1267 35.59% 10.80%
44 0.4 0.5 0.1 0.1217 34.89% 9.80%
45 0.4 0.6 0.0 0.1354 36.79% 8.80%
46 0.5 0.0 0.5 0.2554 50.54% 13.50%
47 0.5 0.1 0.4 0.1899 43.58% 12.50%
48 0.5 0.2 0.3 0.1430 37.82% 11.50%
49 0.5 0.3 0.2 0.1147 33.87% 10.50%
50 0.5 0.4 0.1 0.1050 32.40% 9.50%
51 0.5 0.5 0.0 0.1139 33.75% 8.50%
52 0.6 0.0 0.4 0.1943 44.08% 12.20%
53 0.6 0.1 0.3 0.1427 37.77% 11.20%
54 0.6 0.2 0.2 0.1096 33.11% 10.20%
55 0.6 0.3 0.1 0.0952 30.85% 9.20%
56 0.6 0.4 0.0 0.0993 31.51% 8.20%
57 0.7 0.0 0.3 0.1492 38.63% 10.90%
58 0.7 0.1 0.2 0.1114 33.38% 9.90%
59 0.7 0.2 0.1 0.0922 30.36% 8.90%
60 0.7 0.3 0.0 0.0916 30.26% 7.90%
61 0.8 0.0 0.2 0.1201 34.65% 9.60%
62 0.8 0.1 0.1 0.0961 31.00% 8.60%
63 0.8 0.2 0.0 0.0907 30.12% 7.60%
64 0.9 0.0 0.1 0.1069 32.69% 8.30%
65 0.9 0.1 0.0 0.0967 31.10% 7.30%
66 1.0 0.0 0.0 0.1096 33.11% 7.00%
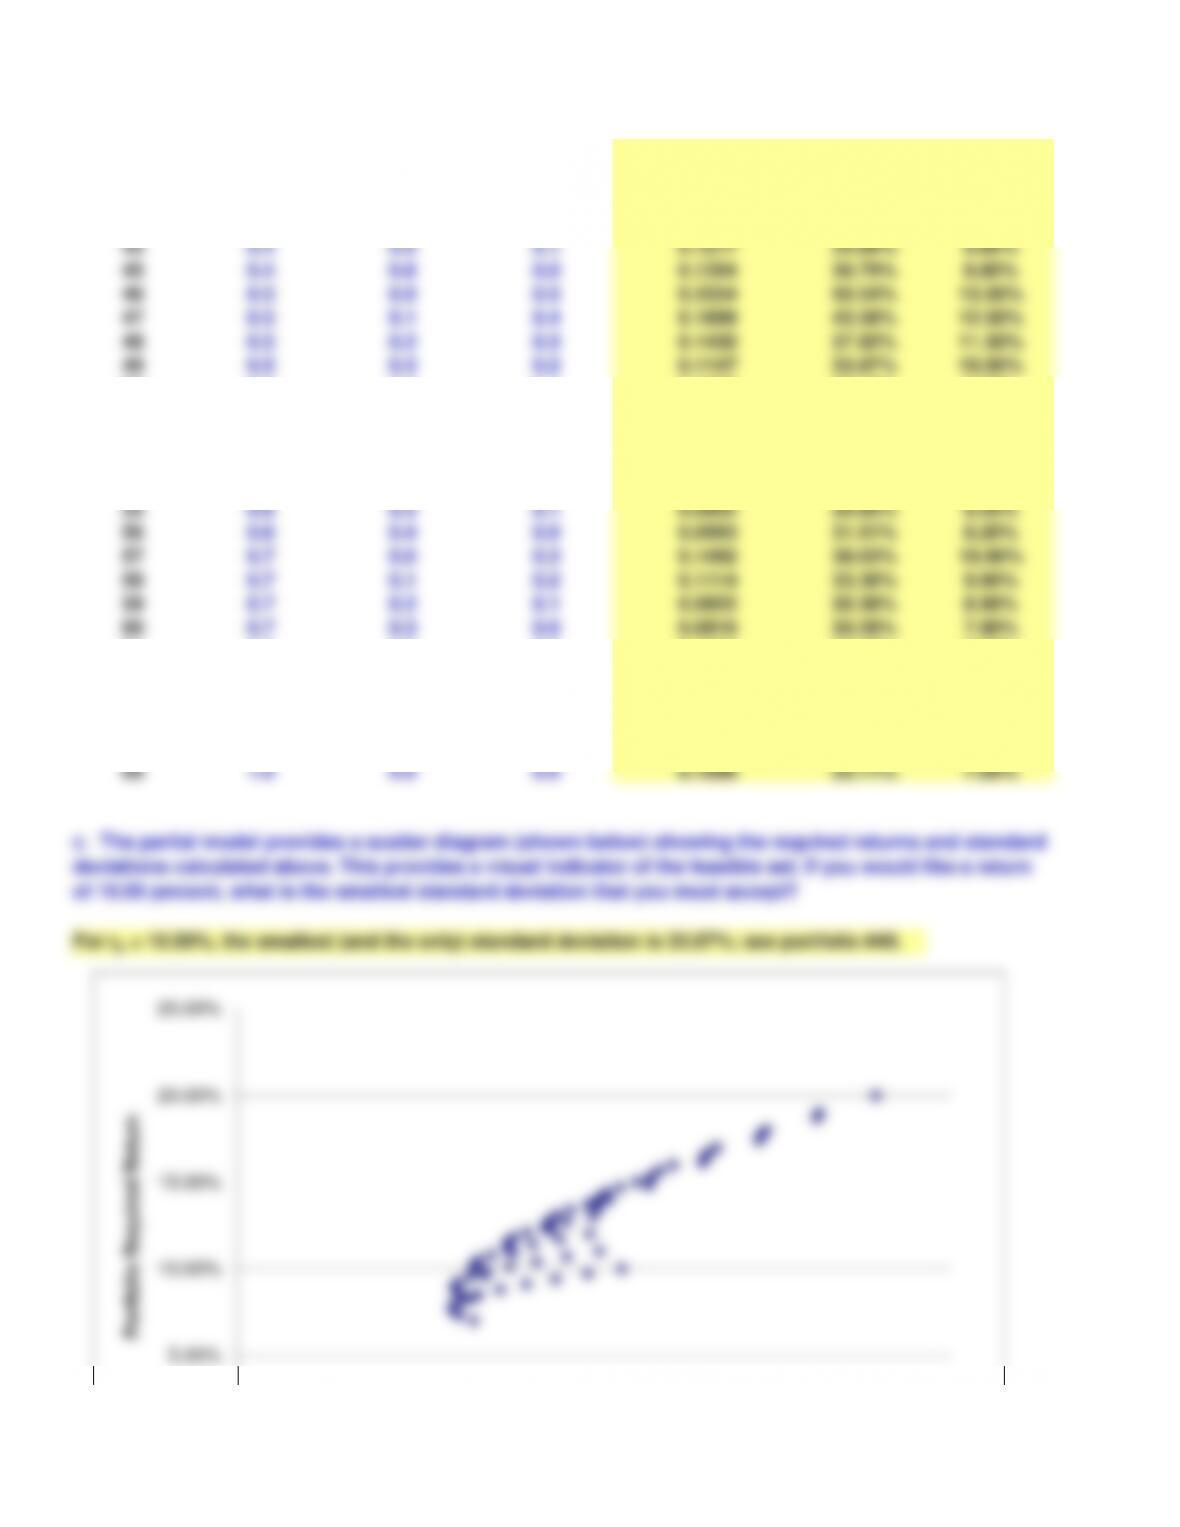
c. The partial model provides a scatter diagram (shown below) showing the required returns and standard
deviations calculated above. This provides a visual indicator of the feasible set. If you would like a return
of 10.50 percent, what is the smallest standard deviation that you must accept?
For rp = 10.50%, the smallest (and the only) standard deviation is 33.87%; see portfolio #49.
5.00%
10.00%
15.00%
20.00%
25.00%
Portfolio Required Return
0.00%
0.00% 20.00% 40.00% 60.00% 80.00% 100.00%
Portfolio Standard Deviation
Hint: put the products of weights and standard deviations for each stock in this row.
Hint: the values in this box should equal wi x si x wj x sj.
Hint: you could sort the date above by rp and sp.


