Solution to Build a Model Problem
Chapter: 12
Problem: 11
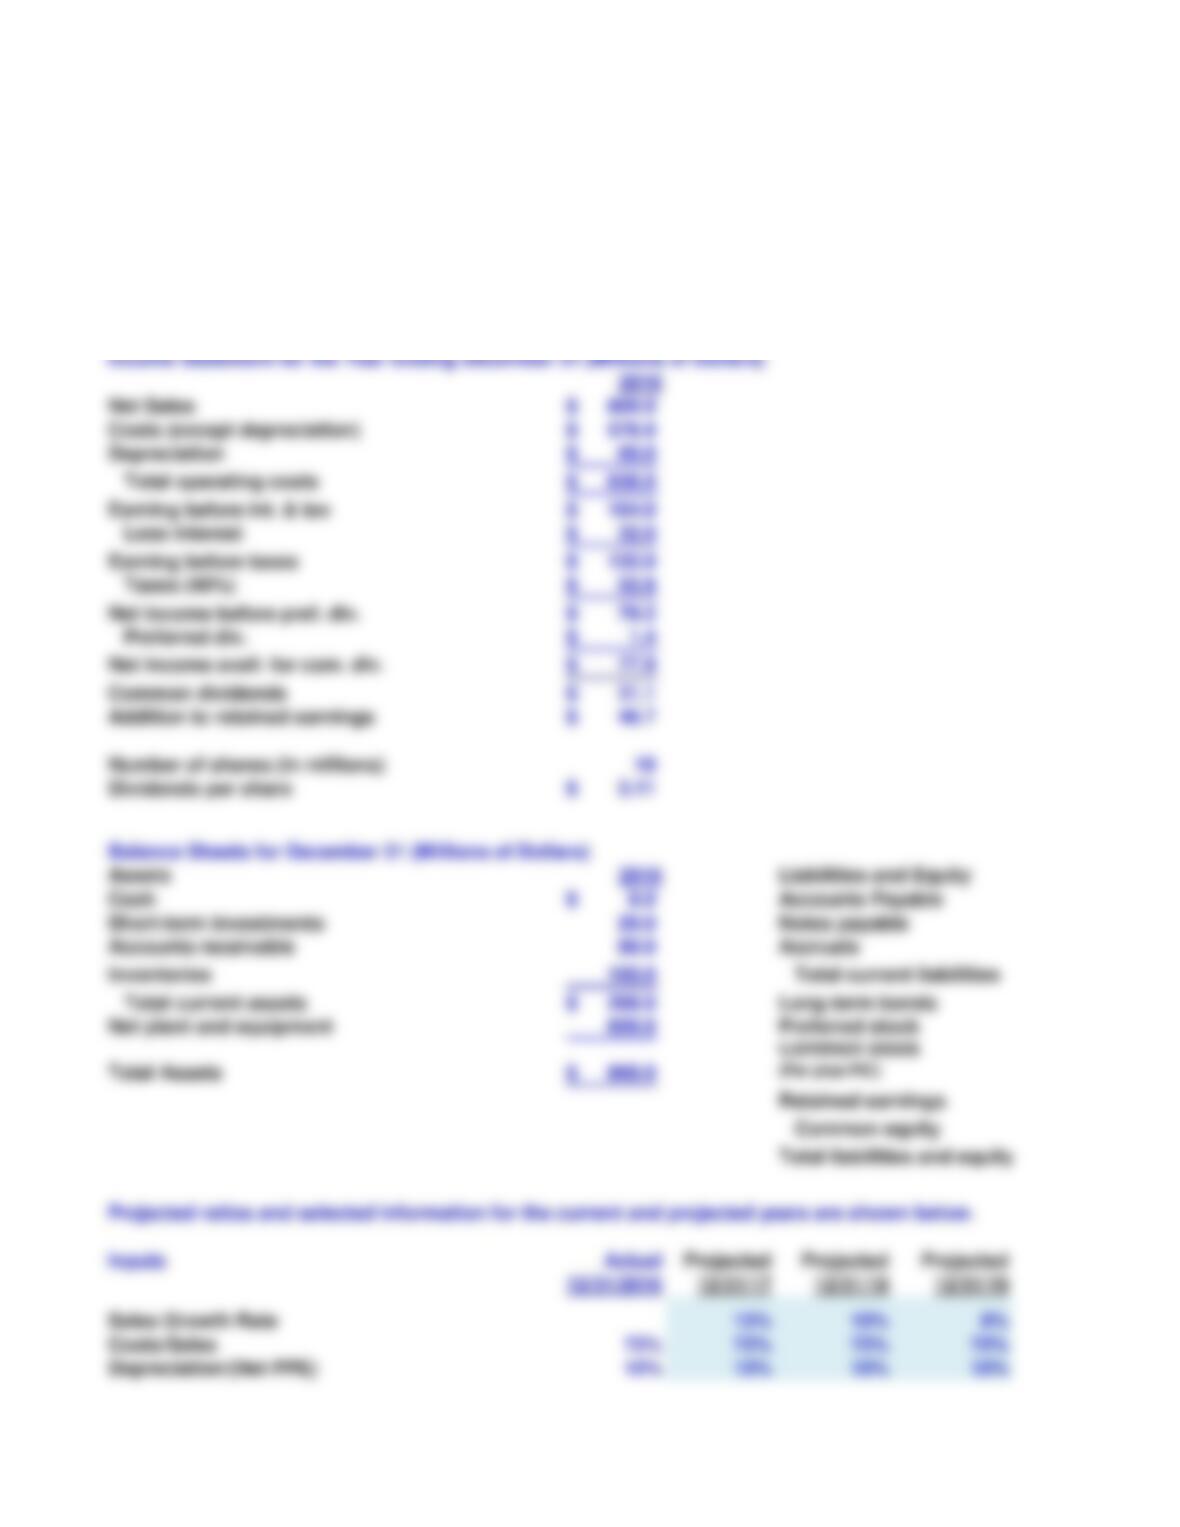
2016
Net Sales 800.0$
Costs (except depreciation) 576.0$
Depreciation 60.0$
Total operating costs 636.0$
Earning before int. & tax 164.0$
Less interest 32.0$
Earning before taxes 132.0$
Taxes (40%) 52.8$
Net income before pref. div. 79.2$
Preferred div. 1.4$
Net income avail. for com. div. 77.9$
Common dividends 31.1$
Addition to retained earnings 46.7$
Number of shares (in millions) 10
Dividends per share 3.11$
Assets 2016 Liabilities and Equity
Cash 8.0$ Accounts Payable
Short-term investments 20.0 Notes payable
Accounts receivable 80.0 Accruals
Inventories 160.0 Total current liabilities
Total current assets 268.0$ Long-term bonds
Net plant and equipment 600.0 Preferred stock
Total Assets 868.0$
Retained earnings
Common equity
Total liabilities and equity
Inputs Actual Projected Projected Projected
12/31/2016 12/31/17 12/31/18 12/31/19
Sales Growth Rate 15% 10% 6%
Costs/Sales 72% 72% 72% 72%
Depreciation/(Net PPE) 10% 10% 10% 10%
Start with the partial model in the file Ch12 P11 Build a Model.xlsx on the textbook’s Web site, which contains
Henley Corporation’s most recent financial statements. Use the following ratios and other selected information
for the current and projected years to answer the next questions.
Income Statement for the Year Ending December 31 (Millions of Dollars)
Balance Sheets for December 31 (Millions of Dollars)
Common Stock
(Par plus PIC)
Projected ratios and selected information for the current and projected years are shown below.
Cash/Sales 1% 1% 1% 1%
(Acct. Rec.)/Sales 10% 10% 10% 10%
Inventories/Sales 20% 20% 20% 20%
(Net PPE)/Sales 75% 75% 75% 75%
(Acct. Pay.)/Sales 2% 2% 2% 2%
Accruals/Sales 5% 5% 5% 5%
Tax rate 40% 40% 40% 40%
Weighted average cost of capital (WACC) 10.5% 10.5% 10.5% 10.5%
Actual Projected Projected Projected
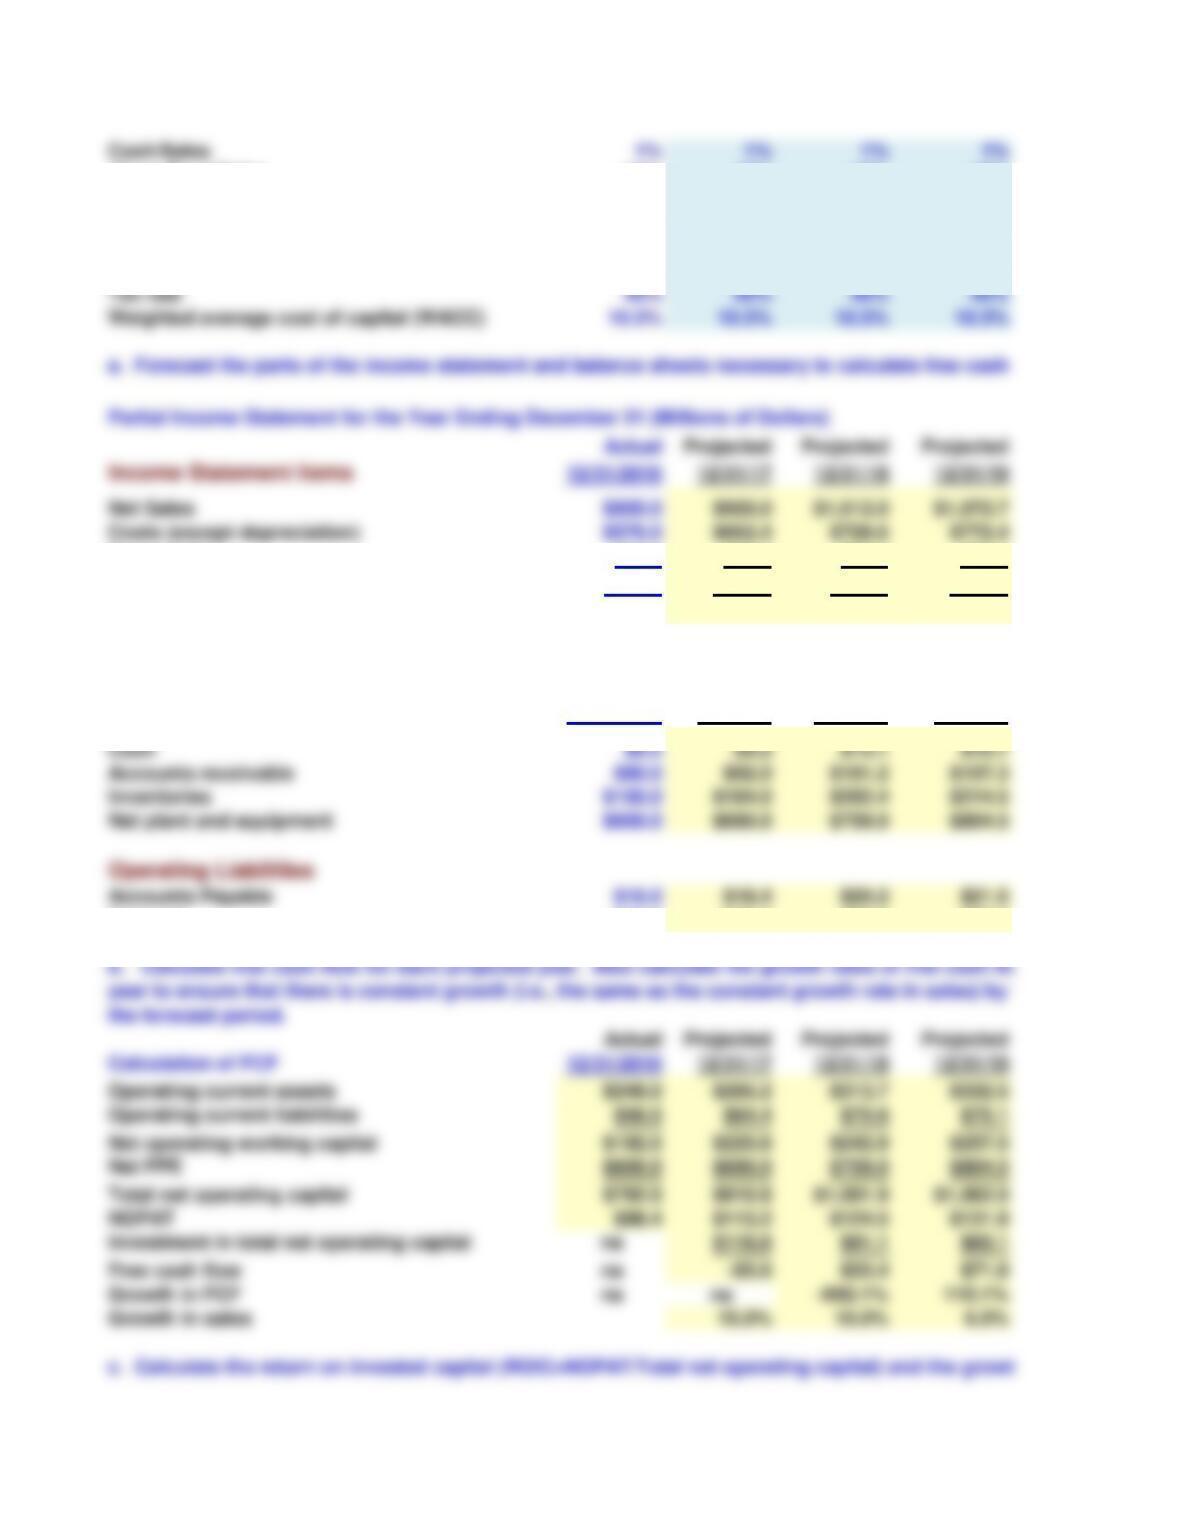
Income Statement Items 12/31/2016 12/31/17 12/31/18 12/31/19
Net Sales $800.0 $920.0 $1,012.0 $1,072.7
Costs (except depreciation) $576.0 $662.4 $728.6 $772.4
Depreciation $60.0 $69.0 $75.9 $80.5
Total operating costs $636.0 $731.4 $804.5 $852.8
Earning before int. & tax $164.0 $188.6 $207.5 $219.9
Actual Projected Projected Projected
Operating Assets 12/31/2016 12/31/17 12/31/18 12/31/19
Cash $8.0 $9.2 $10.1 $10.7
Accounts receivable $80.0 $92.0 $101.2 $107.3
Inventories $160.0 $184.0 $202.4 $214.5
Net plant and equipment $600.0 $690.0 $759.0 $804.5
Operating Liabilities
Accounts Payable $16.0 $18.4 $20.2 $21.5
Accruals $40.0 $46.0 $50.6 $53.6
Actual Projected Projected Projected
Calculation of FCF 12/31/2016 12/31/17 12/31/18 12/31/19
Operating current assets $248.0 $285.2 $313.7 $332.5
Operating current liabilities $56.0 $64.4 $70.8 $75.1
Net operating working capital $192.0 $220.8 $242.9 $257.5
Net PPE $600.0 $690.0 $759.0 $804.5
Total net operating capital $792.0 $910.8 $1,001.9 $1,062.0
NOPAT $98.4 $113.2 $124.5 $131.9
Investment in total net operating capital na $118.8 $91.1 $60.1
Free cash flow na -$5.6 $33.4 $71.8
Growth in FCF na na -692.1% 115.1%
Growth in sales 15.0% 10.0% 6.0%
Partial Income Statement for the Year Ending December 31 (Millions of Dollars)
Partial Balance Sheets for December 31 (Millions of Dollars)
a. Forecast the parts of the income statement and balance sheets necessary to calculate free cash flow.
b. Calculate free cash flow for each projected year. Also calculate the growth rates of free cash flow each
year to ensure that there is constant growth (i.e., the same as the constant growth rate in sales) by the end of
the forecast period.
c. Calculate the return on invested capital (ROIC=NOPAT/Total net operating capital) and the growth rate in
free cash flow. What is the ROIC in the last year of the forecast? What is the long–term constant growth rate in
free cash flow (gL is the growth rate in FCF in the last forecast period because all ratios are constant)? Do you
think that Hensley‘s value would increase if it could add growth without reducing its ROIC? (Hint: Growth will
Actual Projected Projected Projected
12/31/2016 12/31/17 12/31/18 12/31/19
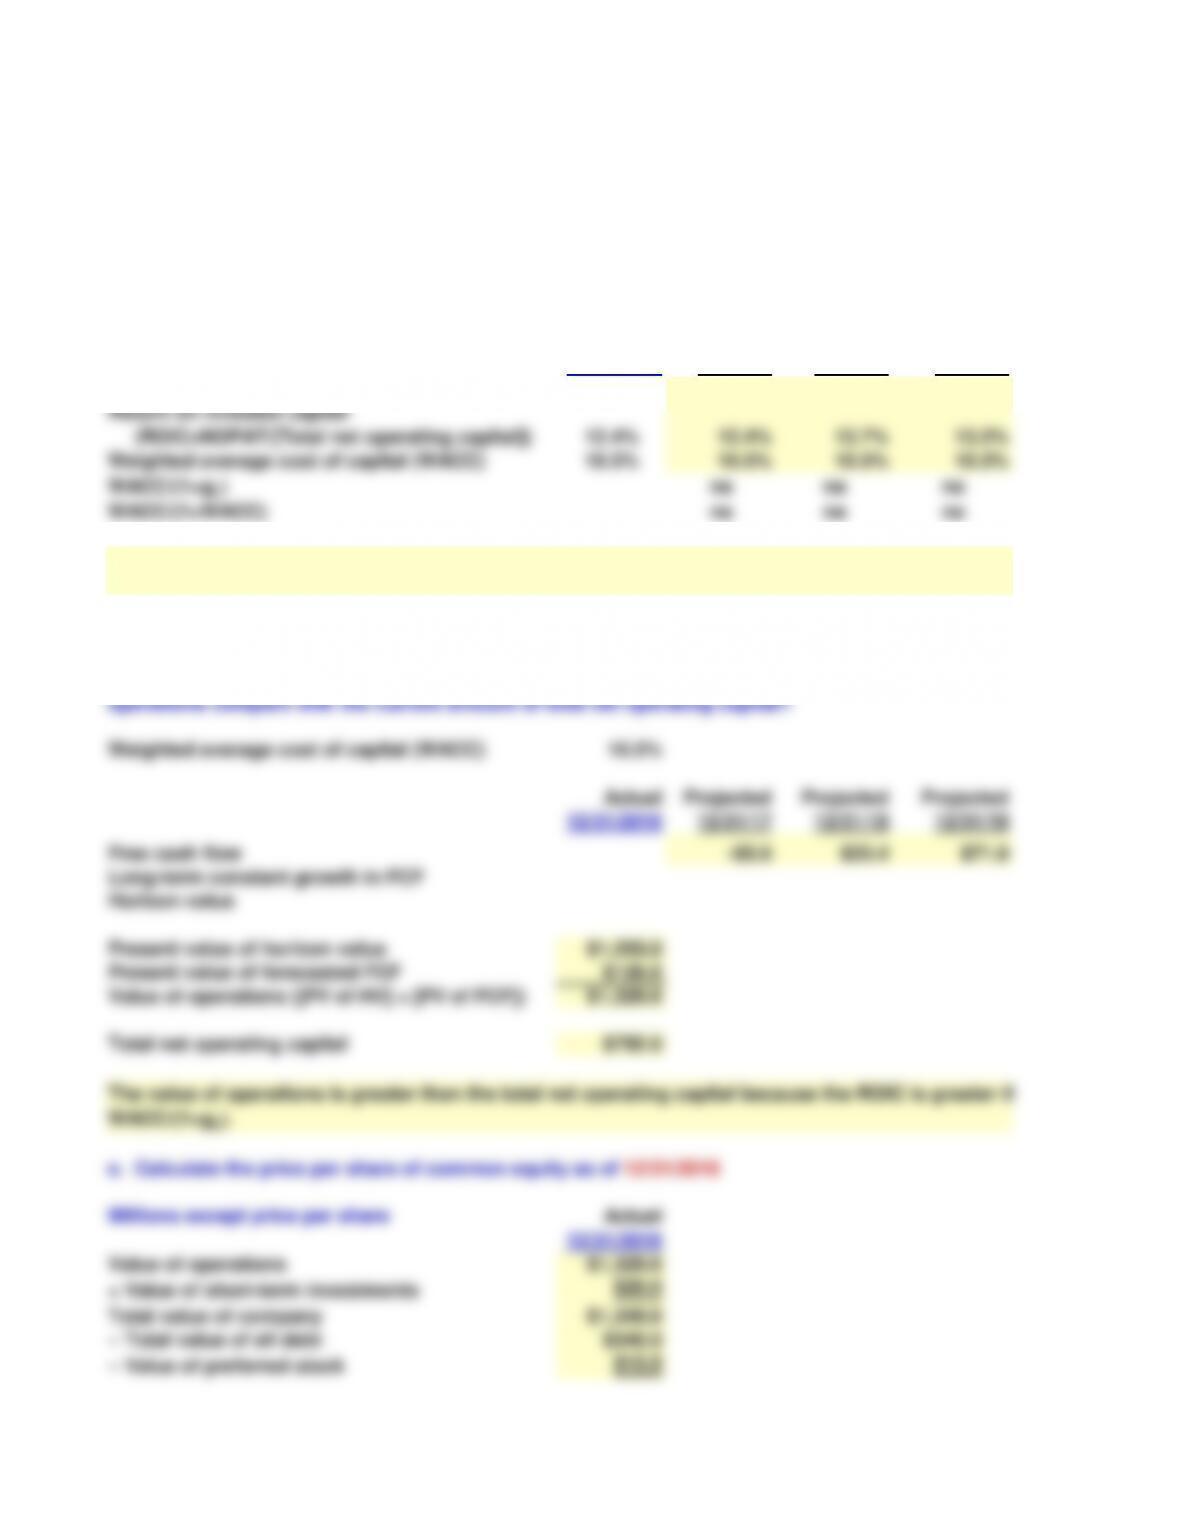
Return on invested capital
(ROIC=NOPAT/[Total net operating capital])
12.4% 12.4% 13.7% 13.2%
Weighted average cost of capital (WACC) 10.5% 10.5% 10.5% 10.5%
WACC/(1+gL)na na na
WACC/(1+WACC) na na na
Weighted average cost of capital (WACC) 10.5%
Actual Projected Projected Projected
12/31/2016 12/31/17 12/31/18 12/31/19
Free cash flow -$5.6 $33.4 $71.8
Long-term constant growth in FCF
Horizon value
Present value of horizon value $1,203.0
Present value of forecasted FCF $126.6
Value of operations (]PV of HV] + [PV of FCF]) $1,329.6
Total net operating capital $792.0
Millions except price per share Actual
12/31/2016
Value of operations $1,329.6
+ Value of short-term investments $20.0
Total value of company $1,349.6
− Total value of all debt $340.0
− Value of preferred stock $15.0
e. Calculate the price per share of common equity as of 12/31/2016
c. Calculate the return on invested capital (ROIC=NOPAT/Total net operating capital) and the growth rate in
free cash flow. What is the ROIC in the last year of the forecast? What is the long-term constant growth rate in
free cash flow (gL is the growth rate in FCF in the last forecast period because all ratios are constant)? Do you
think that Hensley’s value would increase if it could add growth without reducing its ROIC? (Hint: Growth will
add value if the ROIC > WACC/[1+WACC]). Do you think that the company will have a value of operations
greater than its total net operating capital? (Hint: Is ROIC > WACC/[1+gL]?)
d. Calculate the current value of operations. (Hint: First calculate the horizon value at the end of the forecast
period, which is equal to the value of operations at the end of the forecast period. Assume that the annual
growth rate beyond the horizon is equal to the growth rate at the horizon.) How does the current value of
operations compare with the current amount of total net operating capital?
ROIC is greater than WACC/(1+gL), so the value of operations should be greater than the total net operating
capital. Also, ROIC is greater than WACC/(1+WACC), so growth should add value.
The value of operations is greater than the total net operating capital because the ROIC is greater than
WACC/(1+gL).

Value of common equity $994.6
Divided by number of shares 10
Price per share $99.5

8/3/15
2016
16.0$
40.0
40.0
96.0$
300.0$
15.0$
257.0$
200.0
457.0$
868.0$
Projected
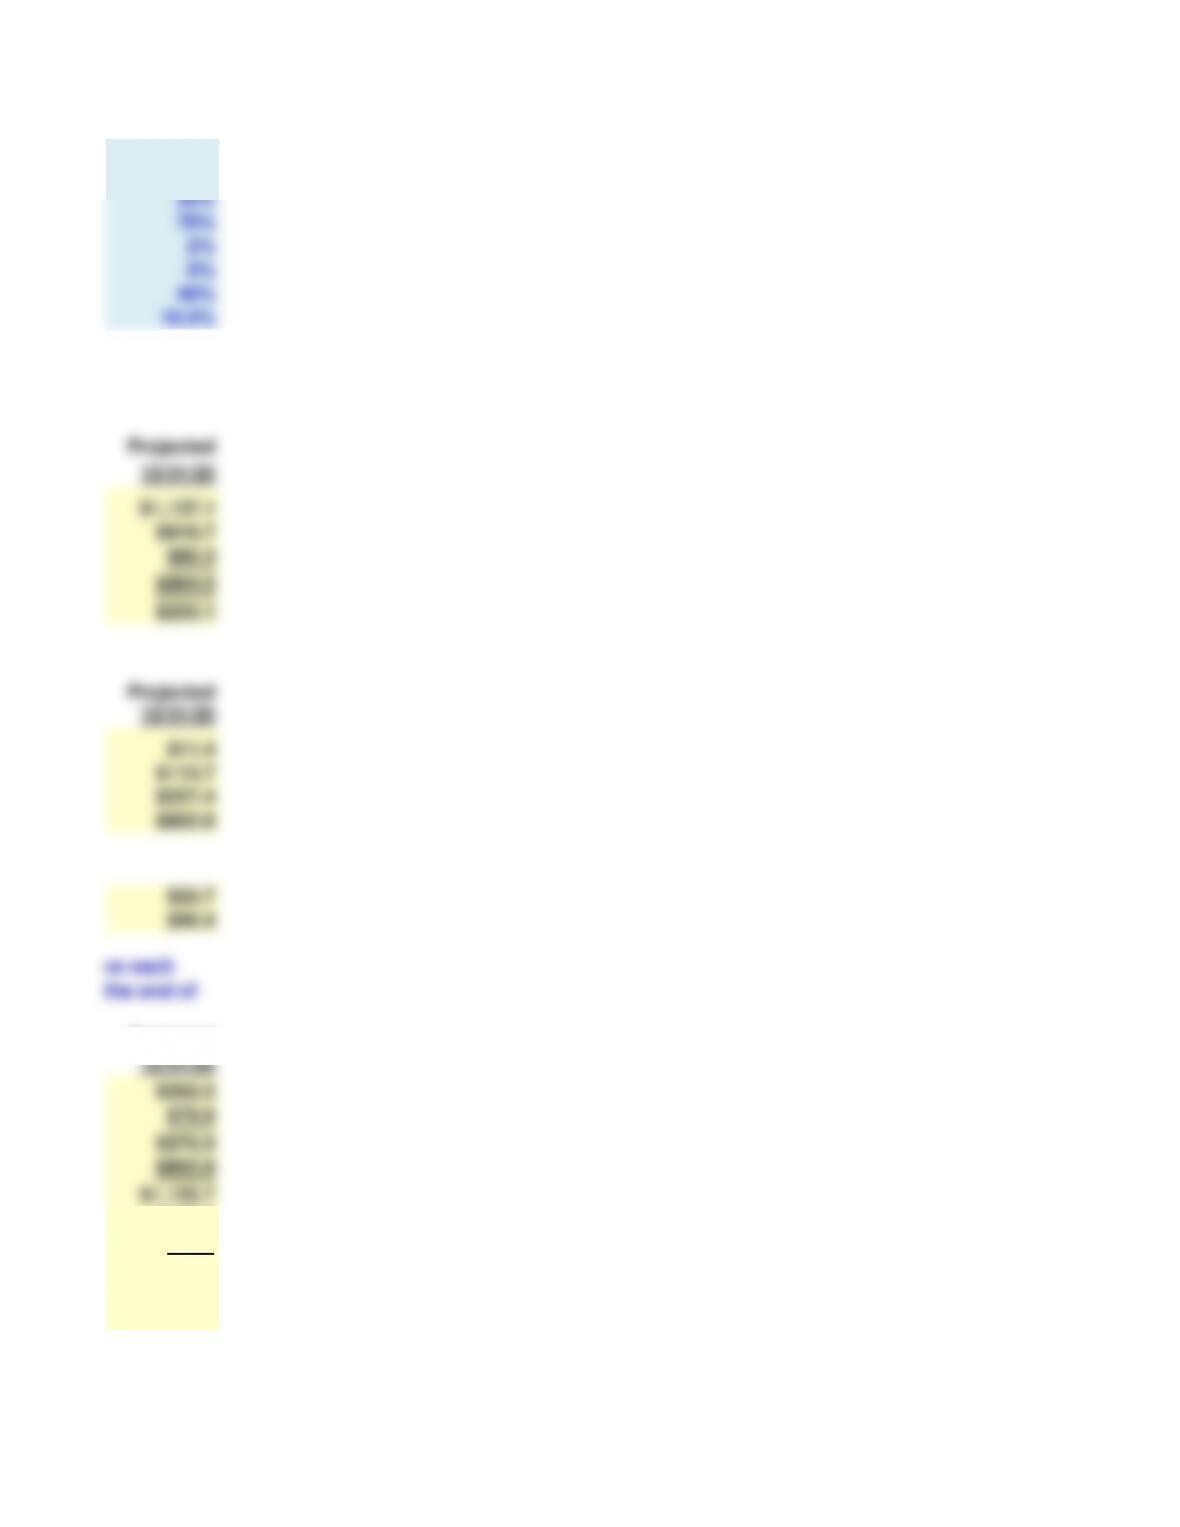
12/31/20
6%
72%
10%
Start with the partial model in the file Ch12 P11 Build a Model.xlsx on the textbook’s Web site, which contains
Henley Corporation’s most recent financial statements. Use the following ratios and other selected information
for the current and projected years to answer the next questions.
Income Statement for the Year Ending December 31 (Millions of Dollars)
Balance Sheets for December 31 (Millions of Dollars)
Projected ratios and selected information for the current and projected years are shown below.
1%
10%
20%
75%
2%
5%
40%
10.5%
Projected
12/31/20
$1,137.1
$818.7
$85.3
$904.0
$233.1
Projected
12/31/20
$11.4
$113.7
$227.4
$852.8
$22.7
$56.9
Projected
12/31/20
$352.5
$79.6
$272.9
$852.8
$1,125.7
$139.9
$63.7
$76.1
6.0%
6.0%
Partial Income Statement for the Year Ending December 31 (Millions of Dollars)
Partial Balance Sheets for December 31 (Millions of Dollars)
a. Forecast the parts of the income statement and balance sheets necessary to calculate free cash flow.
b. Calculate free cash flow for each projected year. Also calculate the growth rates of free cash flow each
year to ensure that there is constant growth (i.e., the same as the constant growth rate in sales) by the end of
the forecast period.
c. Calculate the return on invested capital (ROIC=NOPAT/Total net operating capital) and the growth rate in
free cash flow. What is the ROIC in the last year of the forecast? What is the long–term constant growth rate in
free cash flow (gL is the growth rate in FCF in the last forecast period because all ratios are constant)? Do you
think that Hensley‘s value would increase if it could add growth without reducing its ROIC? (Hint: Growth will
add value if the ROIC > WACC/[1+WACC]). Do you think that the company will have a value of operations
greater than its total net operating capital? (Hint: Is ROIC > WACC/[1+gL]?)

Projected
12/31/20
13.2%
10.5%
9.9%
9.5%
Projected
12/31/20
$76.1
6.0%
1,793.6
e. Calculate the price per share of common equity as of 12/31/2016
c. Calculate the return on invested capital (ROIC=NOPAT/Total net operating capital) and the growth rate in
free cash flow. What is the ROIC in the last year of the forecast? What is the long–term constant growth rate in
free cash flow (gL is the growth rate in FCF in the last forecast period because all ratios are constant)? Do you
think that Hensley‘s value would increase if it could add growth without reducing its ROIC? (Hint: Growth will
add value if the ROIC > WACC/[1+WACC]). Do you think that the company will have a value of operations
greater than its total net operating capital? (Hint: Is ROIC > WACC/[1+gL]?)
period, which is equal to the value of operations at the end of the forecast period. Assume that the annual
growth rate beyond the horizon is equal to the growth rate at the horizon.) How does the current value of
operations compare with the current amount of total net operating capital?
ROIC is greater than WACC/(1+gL), so the value of operations should be greater than the total net operating
The value of operations is greater than the total net operating capital because the ROIC is greater than
WACC/(1+gL).