Solution 8/13/2015
Chapter: 11 Estimating Cash Flows and Analyzing Risk
Problem: 18
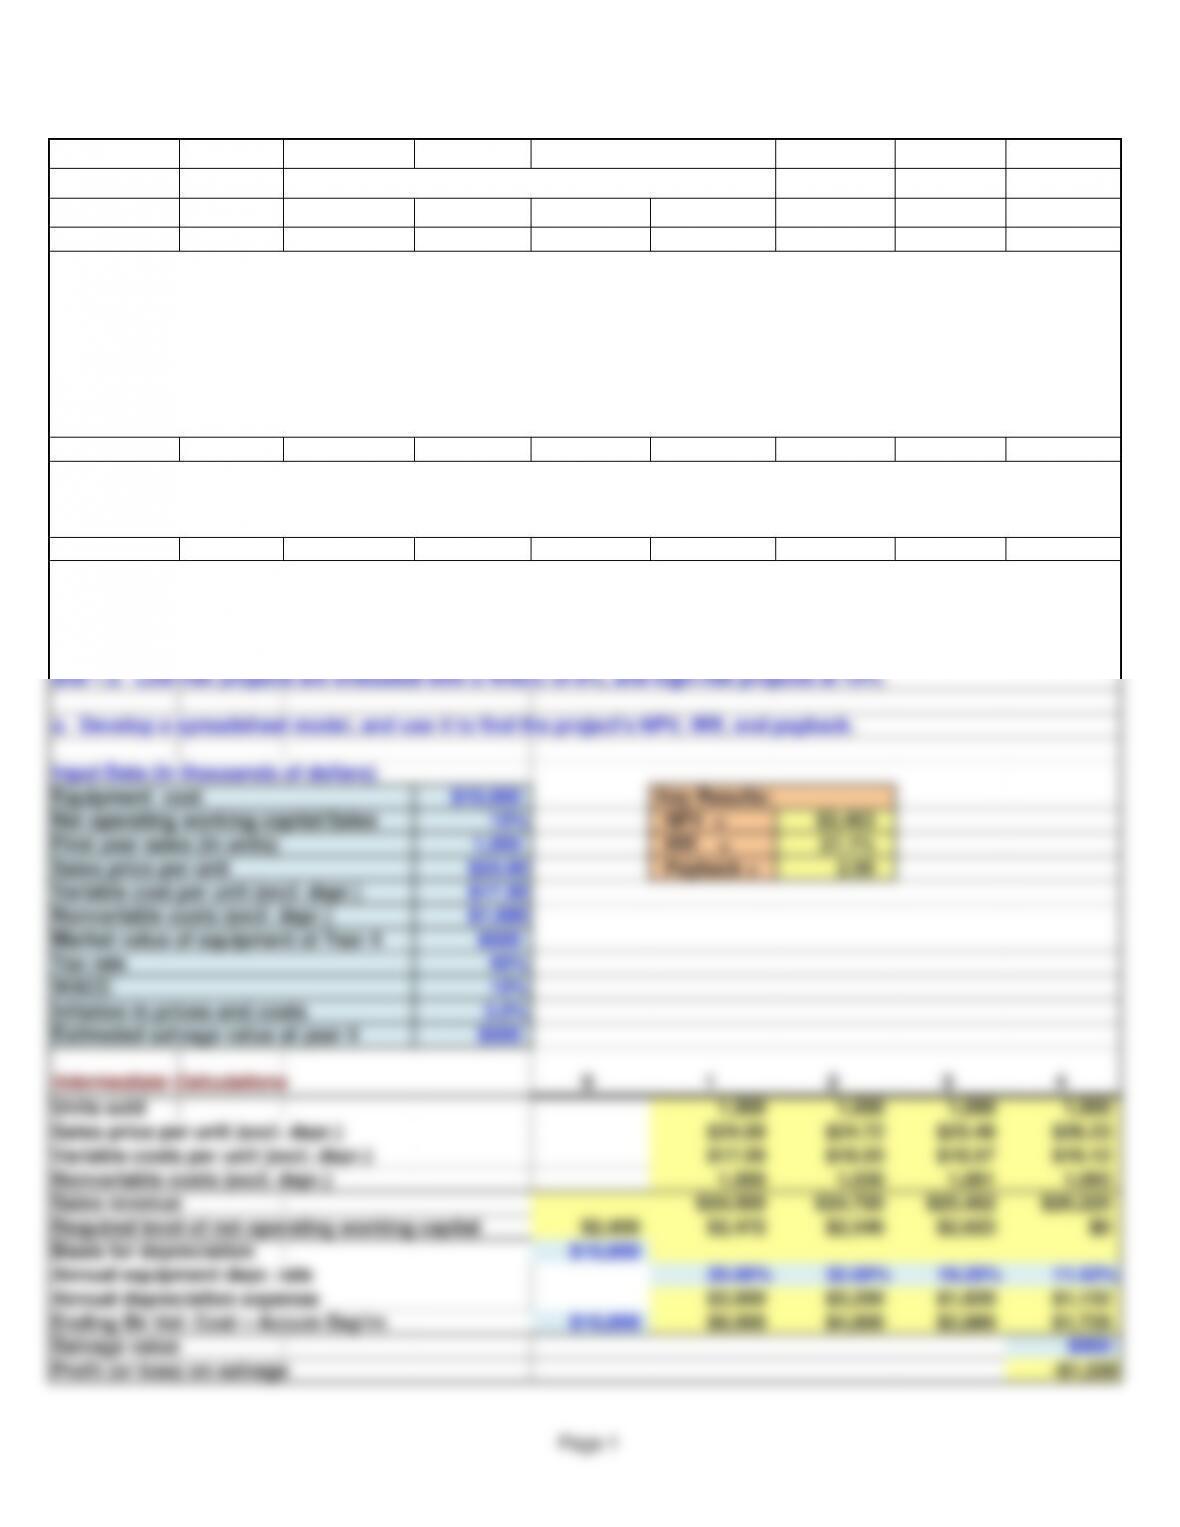
Input Data (in thousands of dollars)
Equipment cost $10,000 Key Results:
Net operating working capital/Sales 10% NPV = $3,463
First year sales (in units) 1,000 IRR = 21.1%
Sales price per unit $24.00 Payback = 2.90
Variable cost per unit (excl. depr.) $17.50
Nonvariable costs (excl. depr.) $1,000
Market value of equipment at Year 4 $500
Tax rate 40%
WACC 10%
Inflation in prices and costs 3.0%
Estimated salvage value at year 4 $500
Intermediate Calculations 0 1 2 3 4
Units sold 1,000 1,000 1,000 1,000
Sales price per unit (excl. depr.) $24.00 $24.72 $25.46 $26.23
Variable costs per unit (excl. depr.) $17.50 $18.03 $18.57 $19.12
Nonvariable costs (excl. depr.) 1,000 1,030 1,061 1,093
Sales revenue $24,000 $24,720 $25,462 $26,225
Required level of net operating working capital $2,400 $2,472 $2,546 $2,623 $0
Basis for depreciation $10,000
Annual equipment depr. rate 20.00% 32.00% 19.20% 11.52%
Annual depreciation expense $2,000 $3,200 $1,920 $1,152
Ending Bk Val: Cost – Accum Dep’rn $10,000 $8,000 $4,800 $2,880 $1,728
Salvage value $500
Profit (or loss) on salvage -$1,228
a. Develop a spreadsheet model, and use it to find the project’s NPV, IRR, and payback.
Webmasters.com has developed a powerful new server that would be used for corporations’ Internet activities. It
would cost $10 million at Year 0 to buy the equipment necessary to manufacture the server. The project would
require net working capital at the beginning of each year in an amount equal to 10% of the year’s projected sales; for
example, NWC0 = 10%(Sales1). The servers would sell for $24,000 per unit, and Webmasters believes that variable
costs would amount to $17,500 per unit. After Year 1, the sales price and variable costs will increase at the inflation
rate of 3%. The company’s nonvariable costs would be $1 million at Year 1 and would increase with inflation.
The equipment would be depreciated over a 5-year period, using MACRS rates. The estimated market value of
the equipment at the end of the project’s 4-year life is $500,000. Webmasters’ federal-plus-state tax rate is 40%. Its
cost of capital is 10% for average-risk projects, defined as projects with a coefficient of variation of NPV between 0.8
and 1.2. Low-risk projects are evaluated with a WACC of 8%, and high-risk projects at 13%.
The server project would have a life of 4 years. If the project is undertaken, it must be continued for the entire 4
years. Also, the project’s returns are expected to be highly correlated with returns on the firm’s other assets. The
firm believes it could sell 1,000 units per year.
Page 1
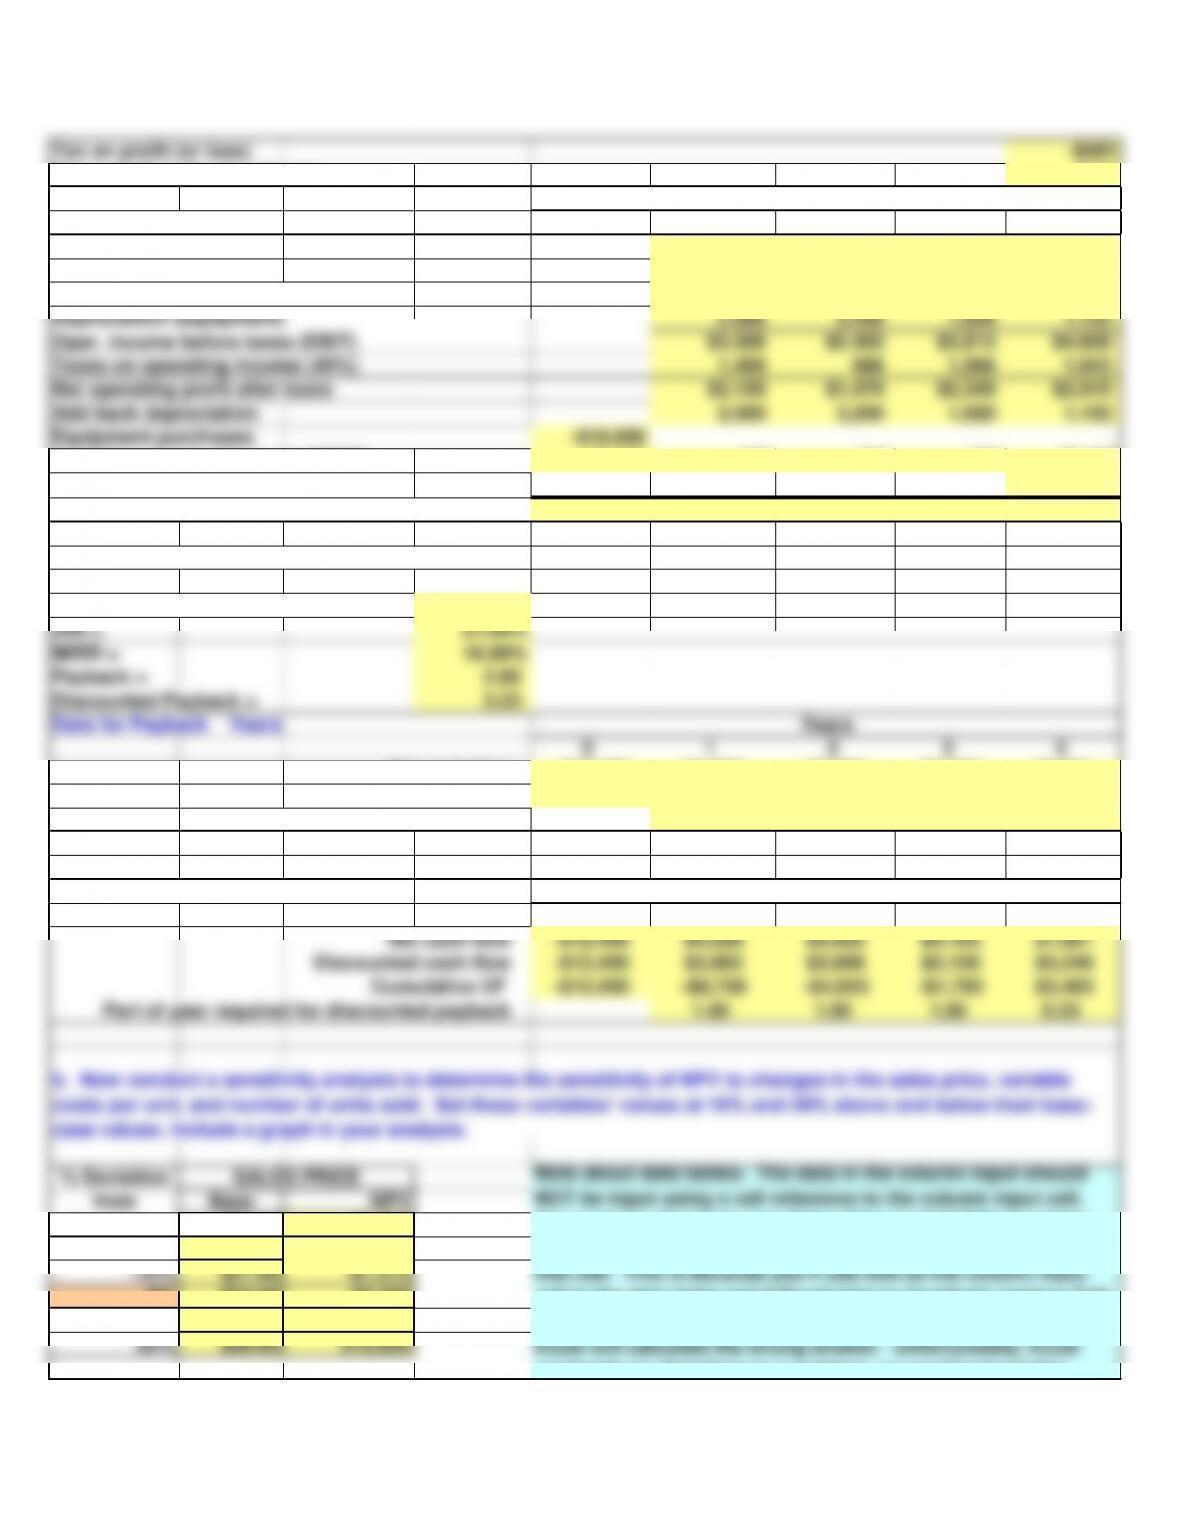
Tax on profit (or loss) -$491
Net cash flow due to salvage $991
Cash Flow Forecast 0 1 2 3 4
Sales revenue $24,000 $24,720 $25,462 $26,225
Variable costs 17,500 18,025 18,566 19,123
Nonvariable operating costs 1,000 1,030 1,061 1,093
Depreciation (equipment) 2,000 3,200 1,920 1,152
Oper. income before taxes (EBIT) $3,500 $2,465 $3,915 $4,858
Taxes on operating income (40%) 1,400 986 1,566 1,943
Net operating profit after taxes $2,100 $1,479 $2,349 $2,915
Add back depreciation 2,000 3,200 1,920 1,152
Equipment purchases -$10,000
Cash flow due to change in NOWC -$2,400 -$72 -$74 -$76 $2,623
Net cash flow due to salvage $991
Net Cash Flow (Time line of cash flows) -$12,400 $4,028 $4,605 $4,193 $7,681
Key Results: Appraisal of the Proposed Project
Net Present Value (at 10%) = $3,463
IRR = 21.09%
MIRR = 16.99%
Payback = 2.90
Discounted Payback = 3.23
Data for Payback Years
0 1 2 3 4
Net cash flow -$12,400 $4,028 $4,605 $4,193 $7,681
Cumulative CF -$12,400 -$8,372 -$3,767 $425 $8,106
Part of year required for payback 1.00 1.00 0.90 0.00
Data for Discounted Payback Years
0 1 2 3 4
Net cash flow -$12,400 $4,028 $4,605 $4,193 $7,681
Discounted cash flow -$12,400 $3,662 $3,806 $3,150 $5,246
Cumulative CF -$12,400 -$8,738 -$4,933 -$1,783 $3,463
Part of year required for discounted payback 1.00 1.00 1.00 0.23
% Deviation
from Base NPV
Base Case $24.00 $3,463
-20% $19.20 -$5,893
-10% $21.60 -$1,215
0% $24.00 $3,463
10% $26.40 $8,141
20% $28.80 $12,820
SALES PRICE
b. Now conduct a sensitivity analysis to determine the sensitivity of NPV to changes in the sales price, variable
costs per unit, and number of units sold. Set these variables’ values at 10% and 20% above and below their base-
case values. Include a graph in your analysis.
Years
Years
Note about data tables. The data in the column input should
NOT be input using a cell reference to the column input cell.
For example, the base case Sales Price in Cell B95 should be
the number $24.00 you should NOT have the formula =D28 in
that cell. This is because you’ll use D28 as the column input
cell in the data table and if Excel tries to iteratively replace Cell
D28 with the formula =D28 rather than a series of numbers,
Excel will calculate the wrong answer. Unfortunately, Excel
won’t tell you that there is a problem, so you’ll just get the
Years
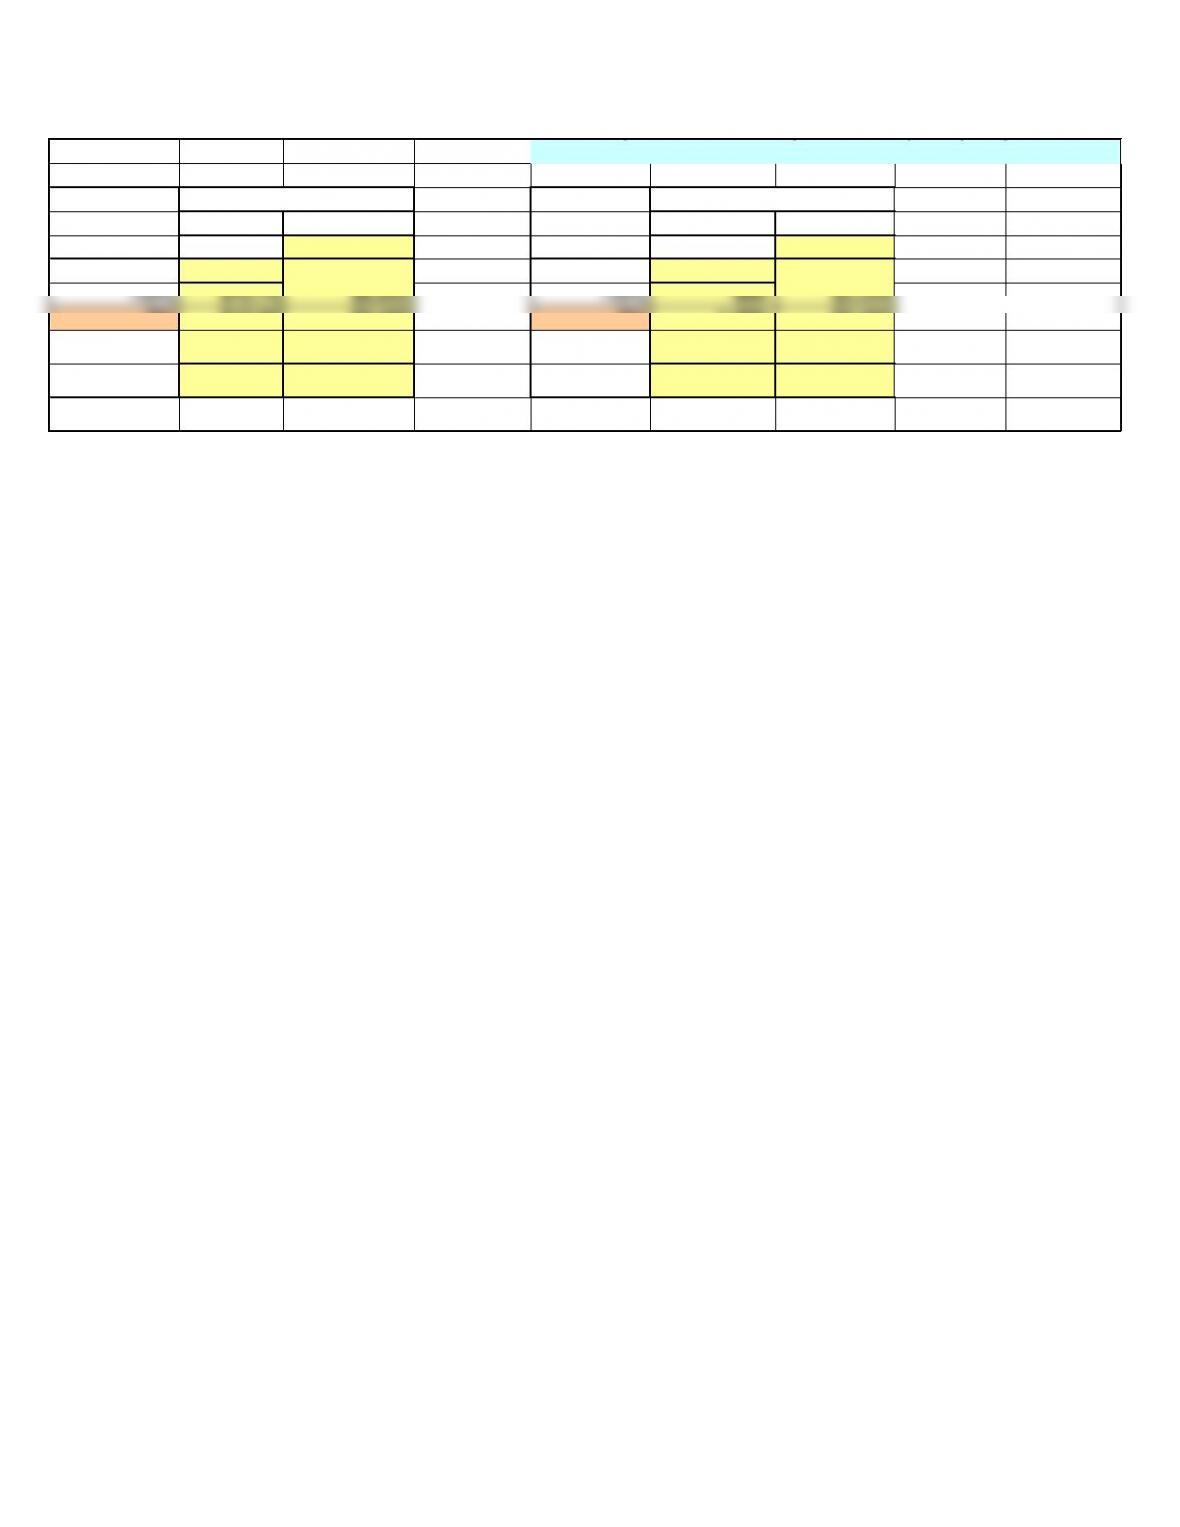
% Deviation % Deviation
from Base NPV from Base NPV
Base Case $17.50 $3,463 Base Case 1,000 $3,463
-20% $14.00 $10,401 -20% 800 $1,045
-10% $15.75 $6,932 -10% 900 $2,254
0% $17.50 $3,463 0% 1,000 $3,463
10% $19.25 -$6 10% 1,100 $4,673
20% $21.00 -$3,475 20% 1,200 $5,882
VARIABLE COST
1st YEAR UNIT SALES
won‘t tell you that there is a problem, so you‘ll just get the
wrong values for the data table!
Page 3
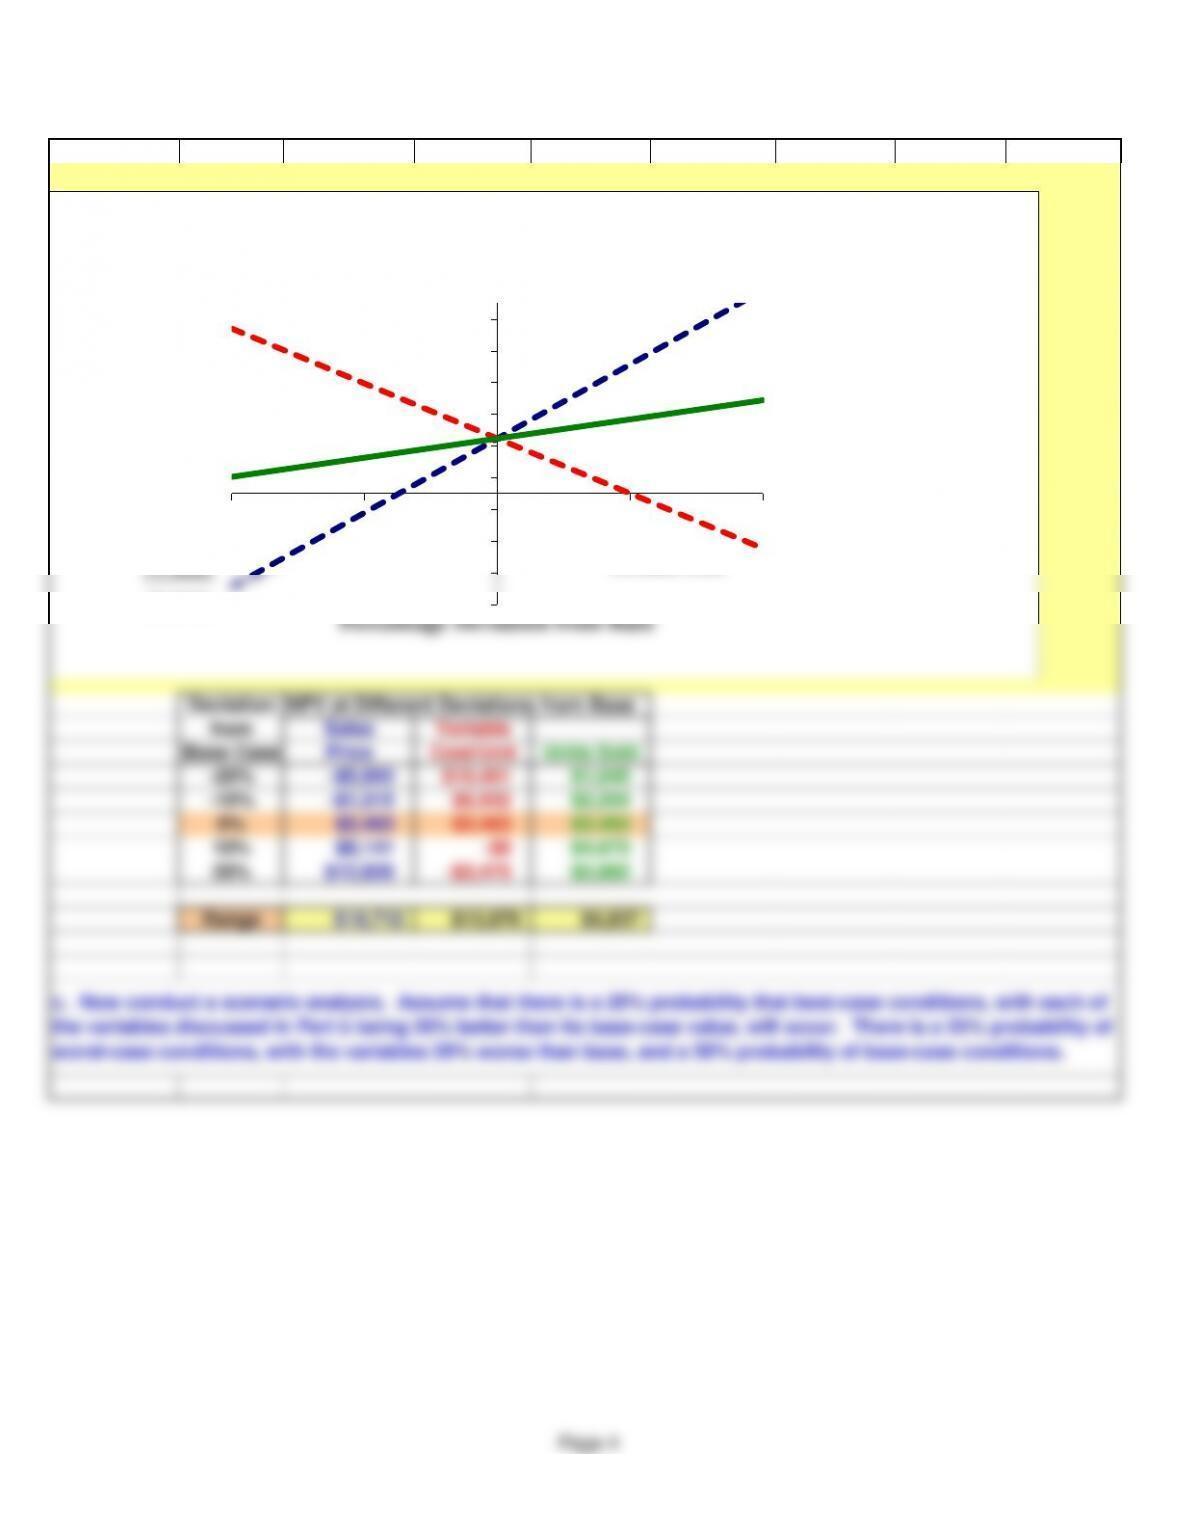
Deviation NPV at Different Deviations from Base
from Sales Variable
Base Case Price Cost/Unit Units Sold
-20% -$5,893 $10,401 $1,045
-10% -$1,215 $6,932 $2,254
0% $3,463 $3,463 $3,463
10% $8,141 -$6 $4,673
20% $12,820 -$3,475 $5,882
Range $18,712 $13,876 $4,837
c. Now conduct a scenario analysis. Assume that there is a 25% probability that best-case conditions, with each of
the variables discussed in Part b being 20% better than its base-case value, will occur. There is a 25% probability of
worst-case conditions, with the variables 20% worse than base, and a 50% probability of base-case conditions.
(7,000)
(5,000)
(3,000)
(1,000)
1,000
3,000
5,000
7,000
9,000
11,000
-20% -10% 0% 10% 20%
NPV ($)
Percentage Deviation from Base
Sensitivity Analysis
Sales Price
Units Sold
Variable Cost
Page 4
Sales Unit Variable
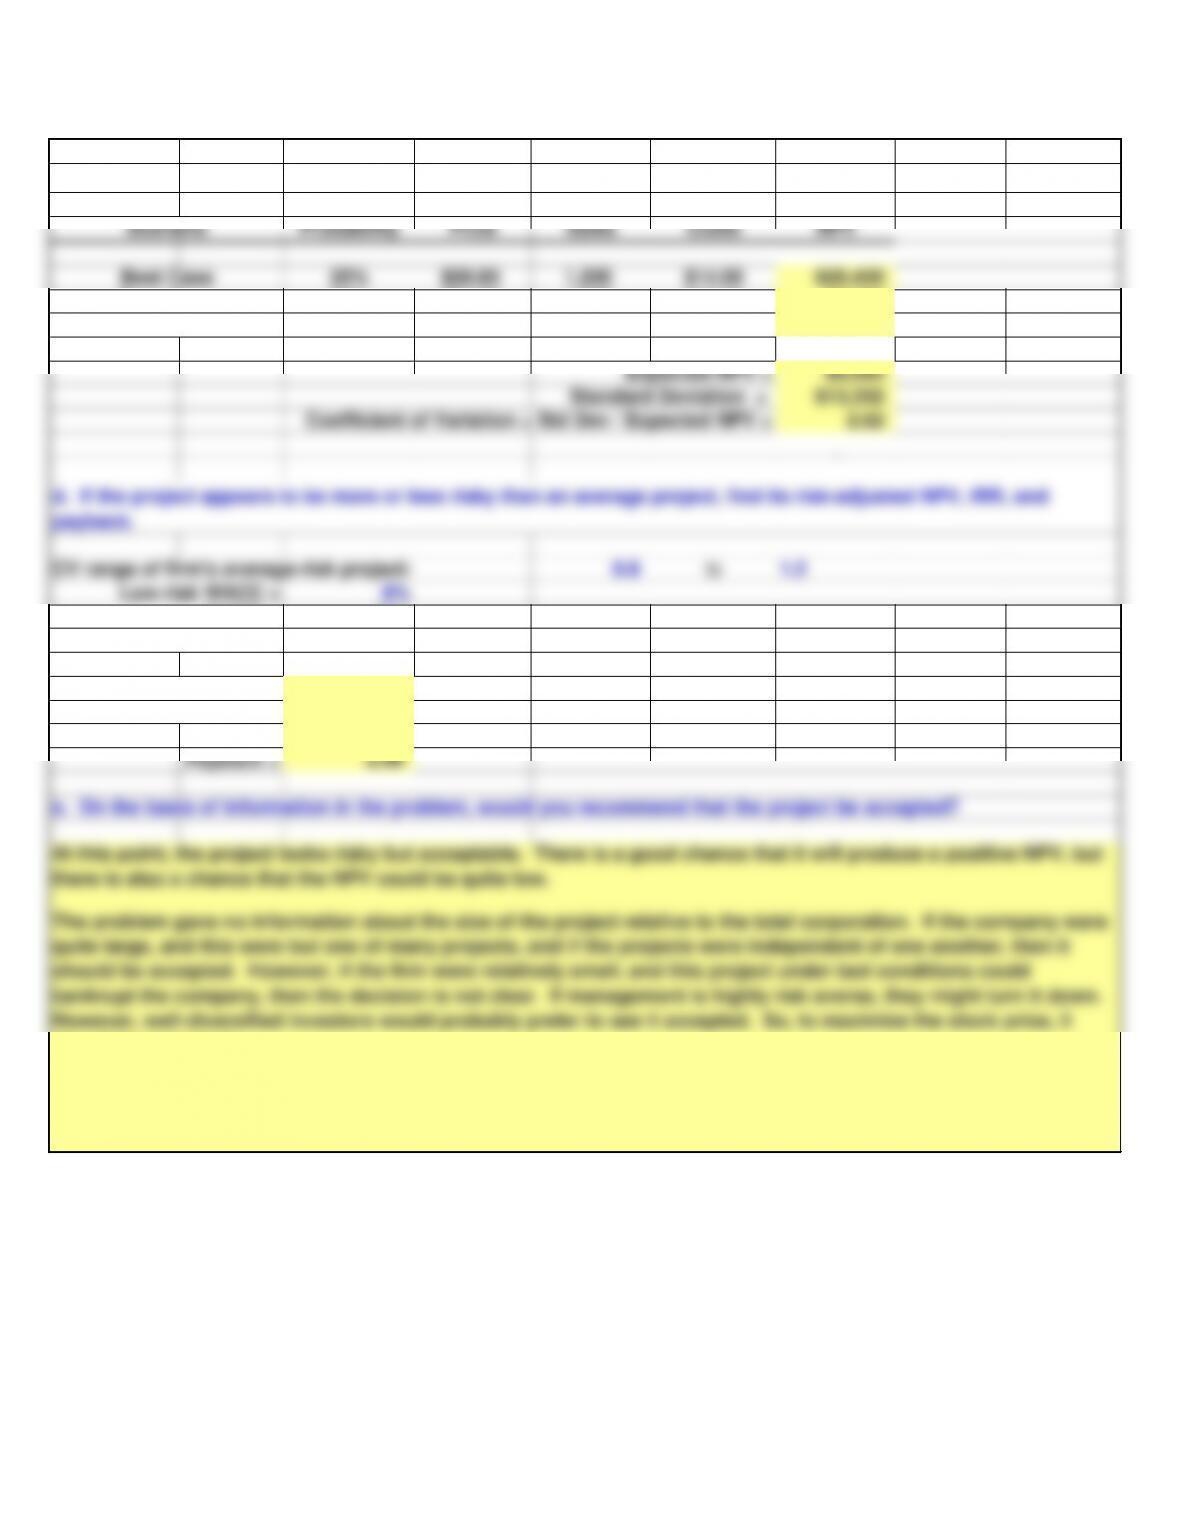
Probability Price Sales Costs NPV
25% $28.80 1,200 $14.00 $25,435
50% $24.00 1,000 $17.50 $3,463
25% $19.20 800 $21.00 ($11,990)
Expected NPV = $5,093
Standard Deviation = $13,332
Coefficient of Variation = Std Dev / Expected NPV = 2.62
CV range of firm’s average-risk project:
0.8 to 1.2
8%
10%
13%
Risk-adjusted WACC = 13%
Risk adjusted NPV = $2,387
IRR = 21.09%
Payback = 2.90
The problem gave no information about the size of the project relative to the total corporation. If the company were
quite large, and this were but one of many projects, and if the projects were independent of one another, then it
should be accepted. However, if the firm were relatively small, and this project under bad conditions could
bankrupt the company, then the decision is not clear. If management is highly risk averse, they might turn it down.
However, well-diversified investors would probably prefer to see it accepted. So, to maximize the stock price, it
should be accepted.
We indicate in the problem that this project’s returns will tend to be highly correlated with the firm’s other projects’
returns. Thus, its stand-alone risk (which is what we have been analyzing) also reflects its within-firm risk. If this
were not true, then we would need to make further risk adjustments.
e. On the basis of information in the problem, would you recommend that the project be accepted?
Scenario
Worst Case
d. If the project appears to be more or less risky than an average project, find its risk-adjusted NPV, IRR, and
payback.
Base Case
Best Case
Low-risk WACC =
WACC =
High-risk WACC =
At this point, the project looks risky but acceptable. There is a good chance that it will produce a positive NPV, but
there is also a chance that the NPV could be quite low.
Page 5

Note: when creating student version, be sure to delete Scenario Summary worksheet. Also delete the Best and Worse ca
Page 6