Solution 7/16/2015
Chapter: 3
Problem: 15
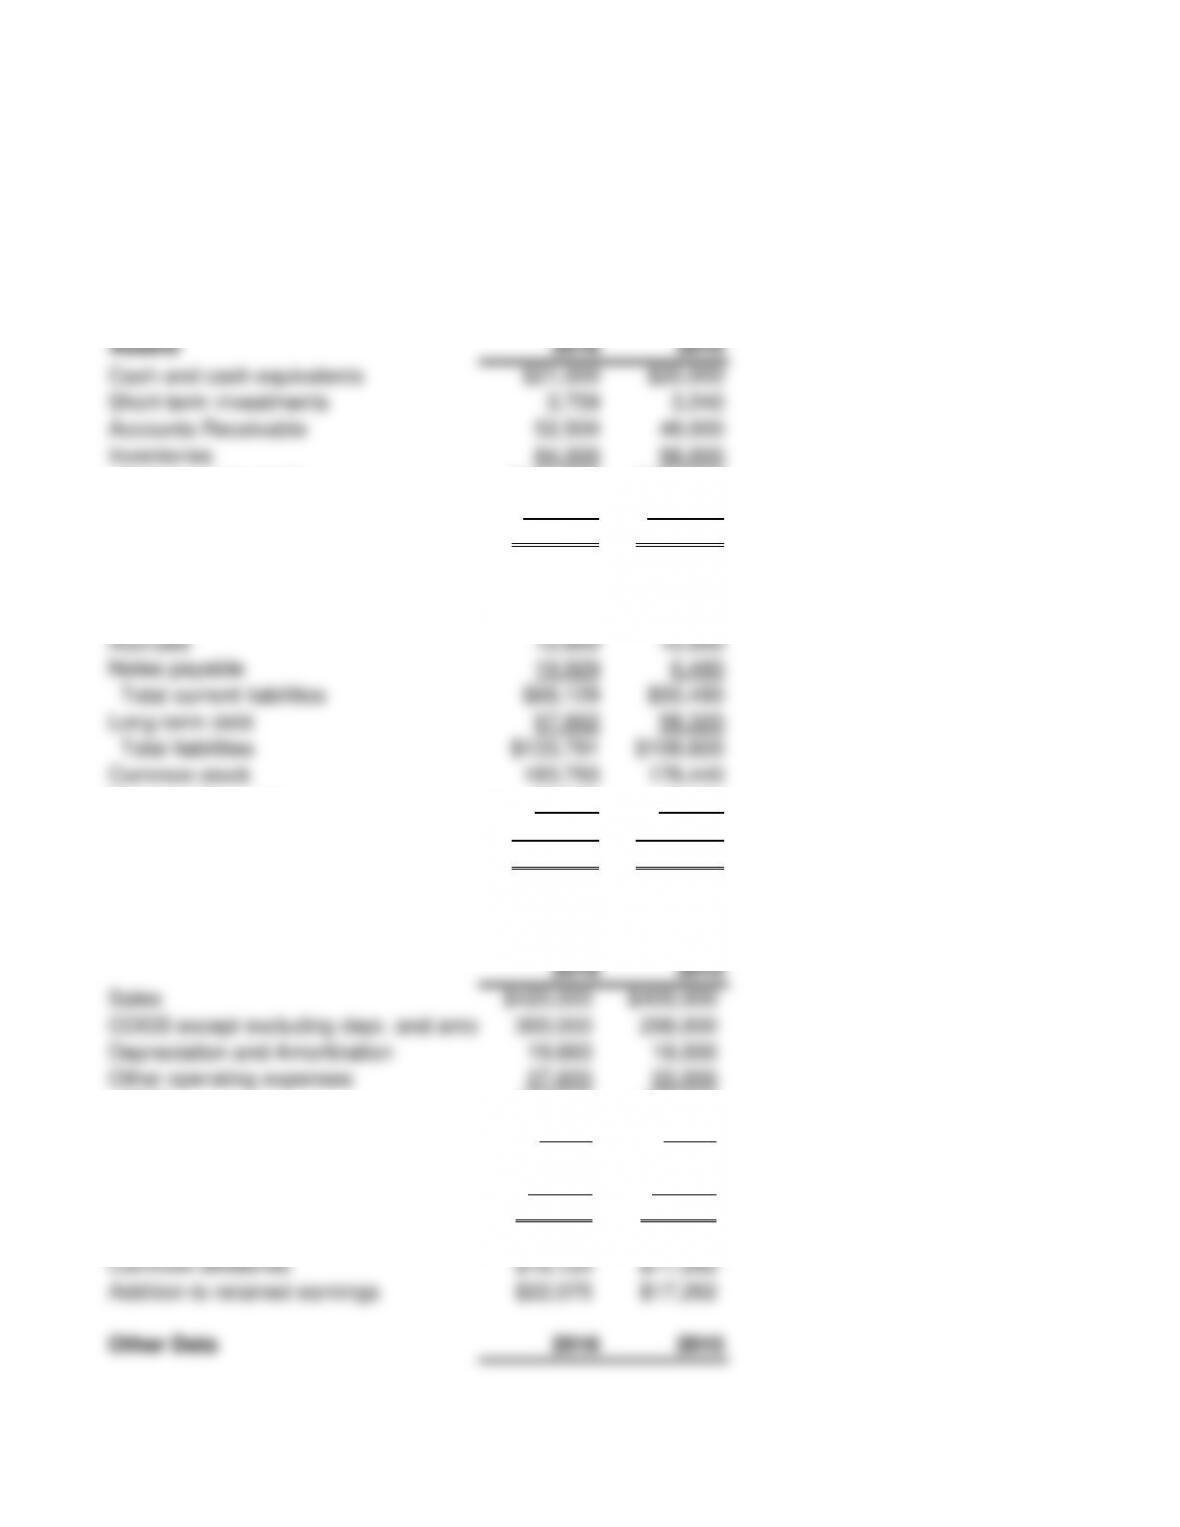
Joshua & White Technologies: December 31 Balance Sheets
(Thousands of Dollars)
Assets
2016 2015
Cash and cash equivalents $21,000 $20,000
Short-term investments 3,759 3,240
Accounts Receivable 52,500 48,000
Inventories 84,000 56,000
Total current assets $161,259 $127,240
Accruals 12,600 12,000
Notes payable 19,929 6,480
Total current liabilities $66,129 $50,480
Long-term debt 67,662 58,320
Total liabilities $133,791 $108,800
Common stock 183,793 178,440
2016 2015
Sales $420,000 $400,000
COGS except excluding depr. and amort.
300,000 298,000
Depreciation and Amortization 19,660 18,000
Other operating expenses 27,600 22,000
EBIT $72,740 $62,000
Interest Expense 5,740 4,460
EBT $67,000 $57,540
Taxes (40%) 26,800 23,016
Net Income $40,200 $34,524
Common dividends $18,125 $17,262
Addition to retained earnings $22,075 $17,262
Other Data 2016 2015
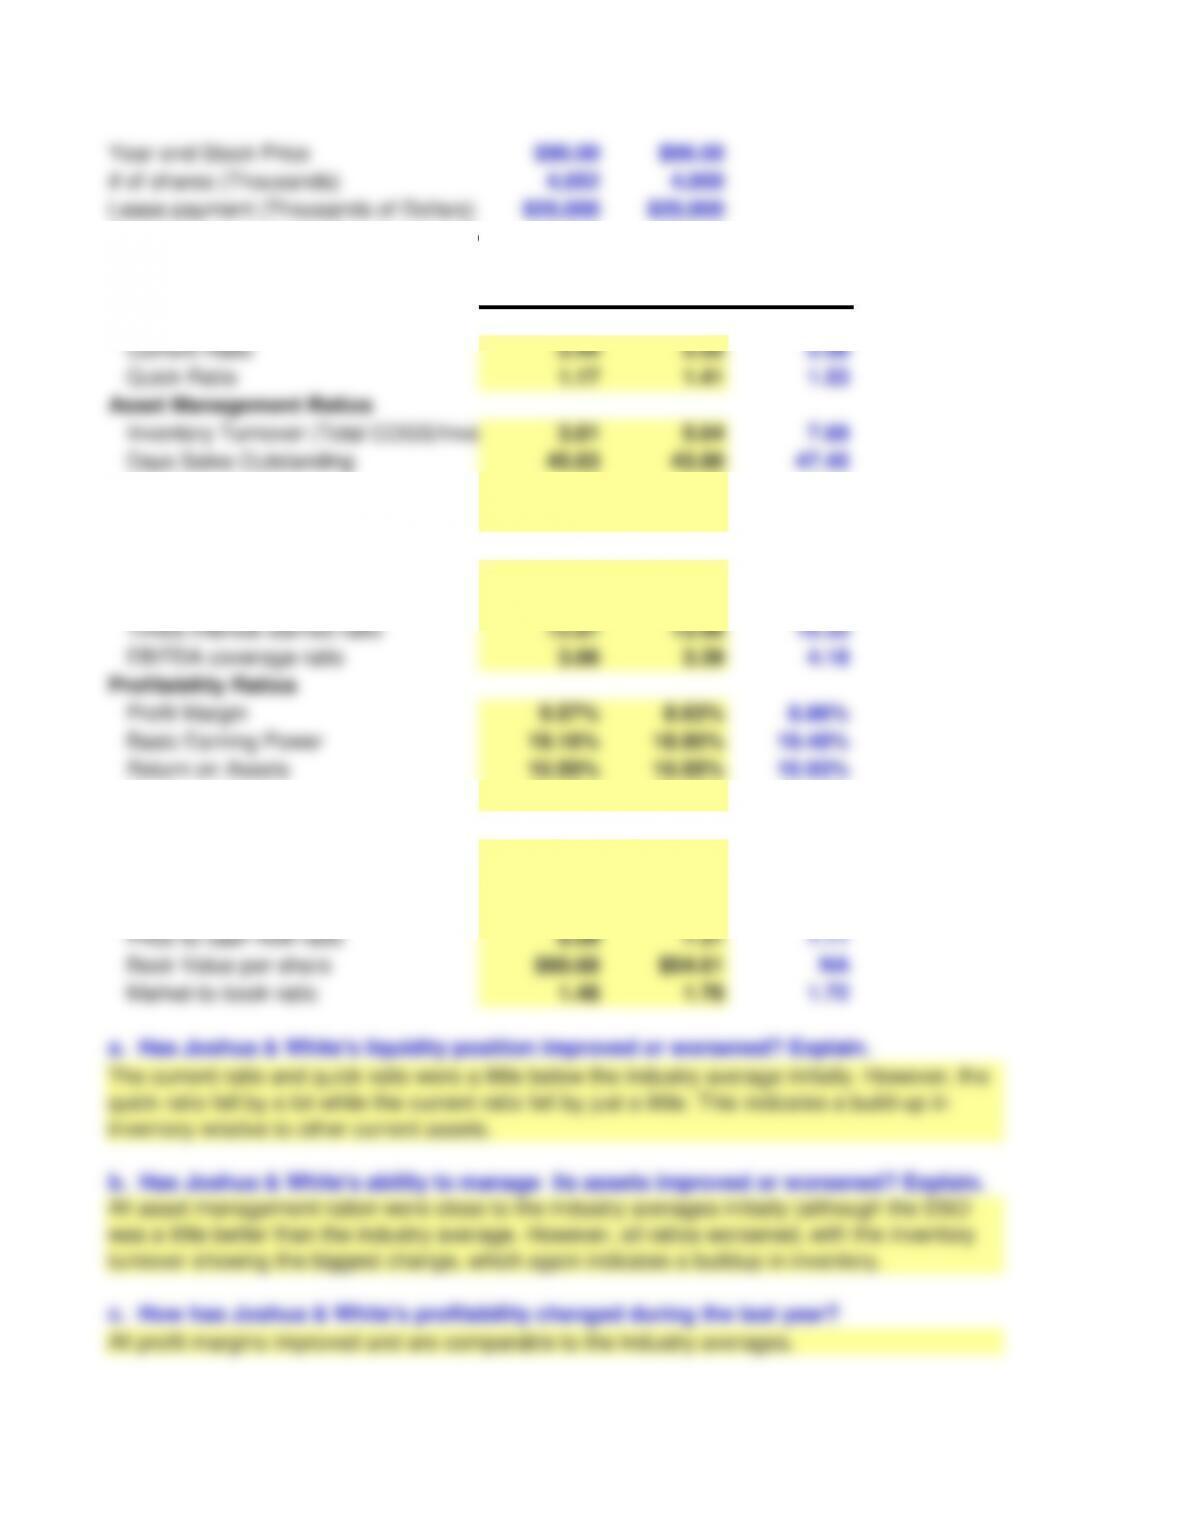
Year-end Stock Price $90.00 $96.00
# of shares (Thousands) 4,052 4,000
Lease payment (Thousands of Dollars)
$20,000 $20,000
Sinking fund payment (Thousands of Dollars)
$5,000 $5,000
Ratio Analysis 2016 2015 Industry Avg
Current Ratio 2.44 2.52 2.58
Quick Ratio 1.17 1.41 1.53
Asset Management Ratios
Inventory Turnover (Total COGS/Inventories)
3.81 5.64 7.69
Days Sales Outstanding 45.63 43.80 47.45
Times-interest-earned ratio 12.67 13.90 15.33
EBITDA coverage ratio 3.66 3.39 4.18
Profitability Ratios
Profit Margin 9.57% 8.63% 8.86%
Basic Earning Power 19.16% 18.95% 19.48%
Price-to-cash flow ratio 6.09 7.31 7.11
Book Value per share $60.68 $54.61 NA
Market-to-book ratio 1.48 1.76 1.72
a. Has Joshua & White’s liquidity position improved or worsened? Explain.
The current ratio and quick ratio were a little below the industry average initially. However, the
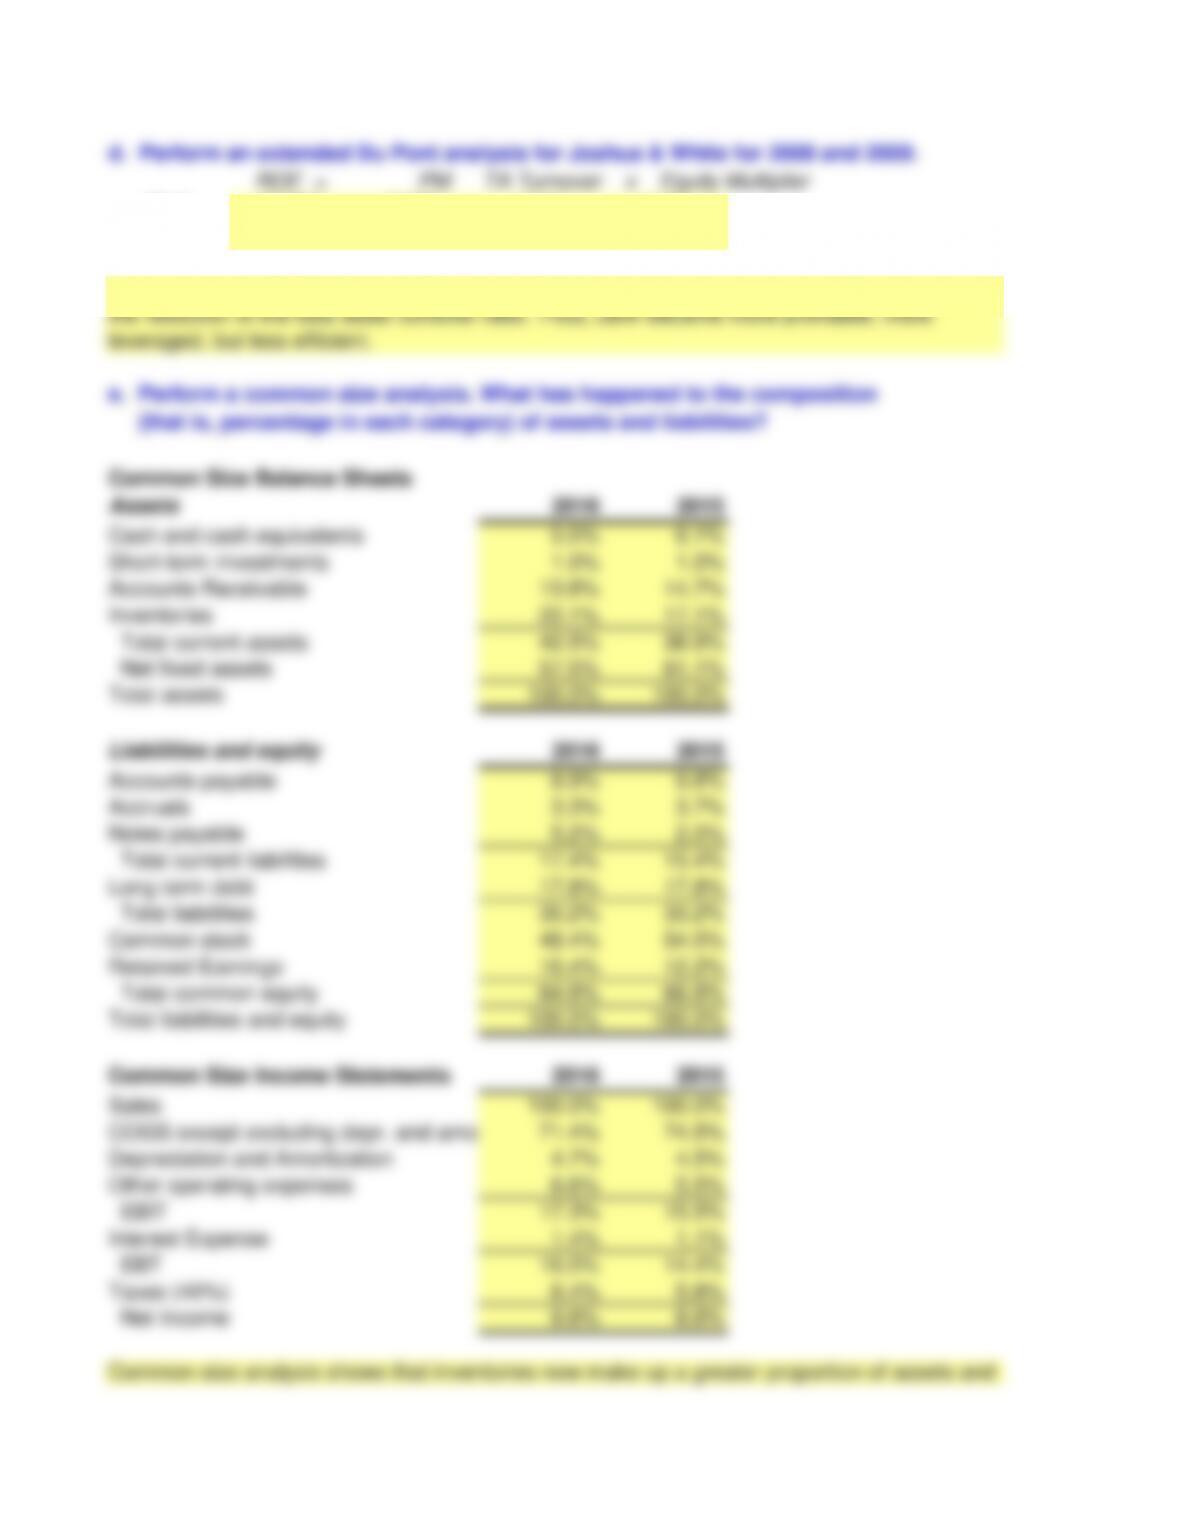
d. Perform an extended Du Pont analysis for Joshua & White for 2008 and 2009.
ROE =
PM x
TA Turnover x Equity Multiplier
2016 16.35% 9.57% 1.11 1.54
2015 15.80% 8.63% 1.22 1.50
e. Perform a common size analysis. What has happened to the composition
(that is, percentage in each category) of assets and liabilities?
Common Size Balance Sheets
Assets
2016 2015
Cash and cash equivalents 5.5% 6.1%
Short-term investments 1.0% 1.0%
Accounts Receivable 13.8% 14.7%
Inventories 22.1% 17.1%
Total current assets 42.5% 38.9%
Net fixed assets 57.5% 61.1%
2016 2015
Accounts payable 8.9% 9.8%
Accruals 3.3% 3.7%
Notes payable 5.2% 2.0%
Total current liabilities 17.4% 15.4%
Long-term debt 17.8% 17.8%
Total liabilities 35.2% 33.2%
Common Size Income Statements 2016 2015
Sales 100.0% 100.0%
COGS except excluding depr. and amort.
71.4% 74.5%
Depreciation and Amortization 4.7% 4.5%
Other operating expenses 6.6% 5.5%
EBIT 17.3% 15.5%
Interest Expense 1.4% 1.1%
ROE improved because the profit margin improved and the equity multiplier increases, despite
leveraged, but less efficient.
Common size analysis shows that inventories now make up a greater proportion of assets and
that the combined long–term debt and notes payable make up a greater proportion of liabilities
& equity. Profits margins have gone up (even though interest expense has also gone up).
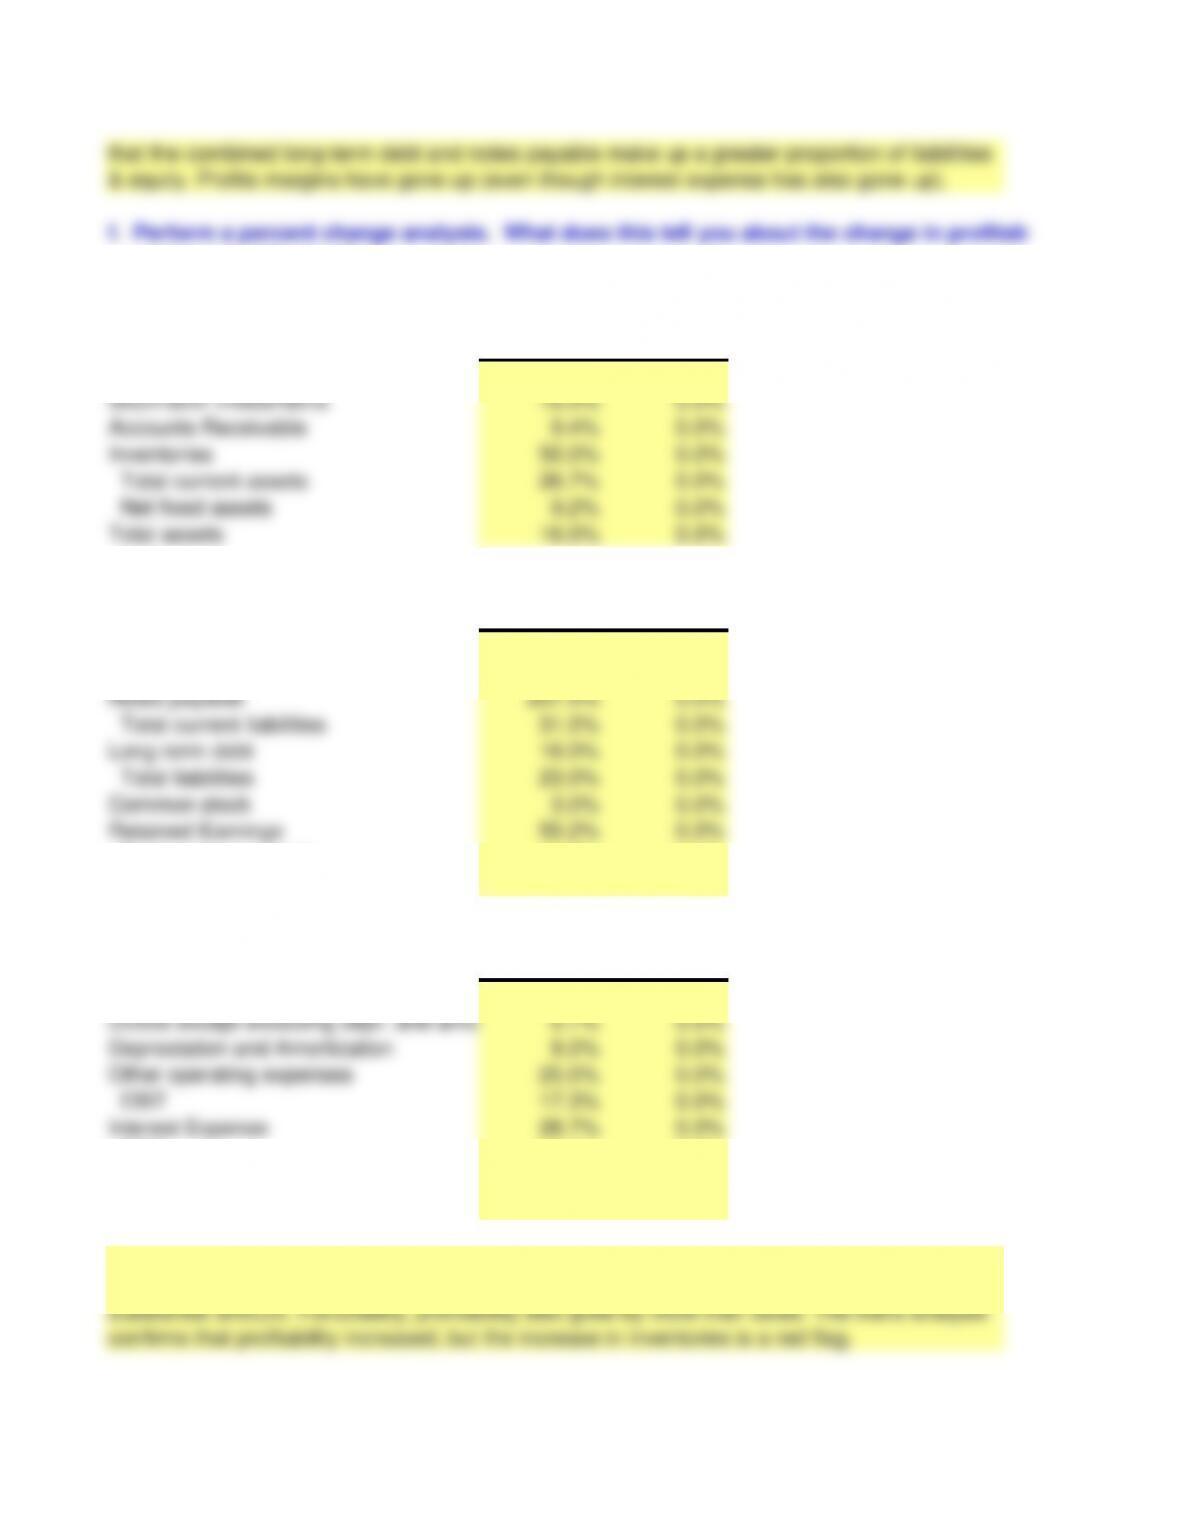
f. Perform a percent change analysis. What does this tell you about the change in profitability
and asset utilization?
Percent Change Balance Sheets Base
Assets
2016 2015
Cash and cash equivalents 5.0% 0.0%
Short-term investments 16.0% 0.0%
Accounts Receivable 9.4% 0.0%
Inventories 50.0% 0.0%
Total current assets 26.7% 0.0%
Net fixed assets 9.2% 0.0%
Total assets 16.0% 0.0%
2016 2015
Total current liabilities 31.0% 0.0%
Long-term debt 16.0% 0.0%
Total liabilities 23.0% 0.0%
Common stock 3.0% 0.0%
Retained Earnings 55.2% 0.0%
Total common equity 12.6% 0.0%
COGS except excluding depr. and amort.
0.7% 0.0%
Depreciation and Amortization 9.2% 0.0%
Other operating expenses 25.5% 0.0%
EBIT 17.3% 0.0%
Interest Expense 28.7% 0.0%
EBT 16.4% 0.0%
Taxes (40%) 16.4% 0.0%
Net Income 16.4% 0.0%
Percent change analysis shows that sales increased at a rate of 5%, but that several items
grew much faster. For example, inventories grew by 50%. Notes payable also grew by a
substantial amount. Fortunately, profitability also grew by more than sales. The trend analysis
confirms that profitability increased, but the increase in inventories is a red flag.
Common size analysis shows that inventories now make up a greater proportion of assets and
that the combined long-term debt and notes payable make up a greater proportion of liabilities
& equity. Profits margins have gone up (even though interest expense has also gone up).

f. Perform a percent change analysis. What does this tell you about the change in profitability