e. Your client has decided that the risk of the bond portfolio is acceptable and
wishes to leave it as it is. Now your client has asked you to use historical returns
to estimate the standard deviation of Blandy’s stock returns. (Note: Many
analysts use 4 to 5 years of monthly returns to estimate risk and many use 52
weeks of weekly returns; some even use a year or less of daily returns. For the
sake of simplicity, use Blandy’s 10 annual returns.)
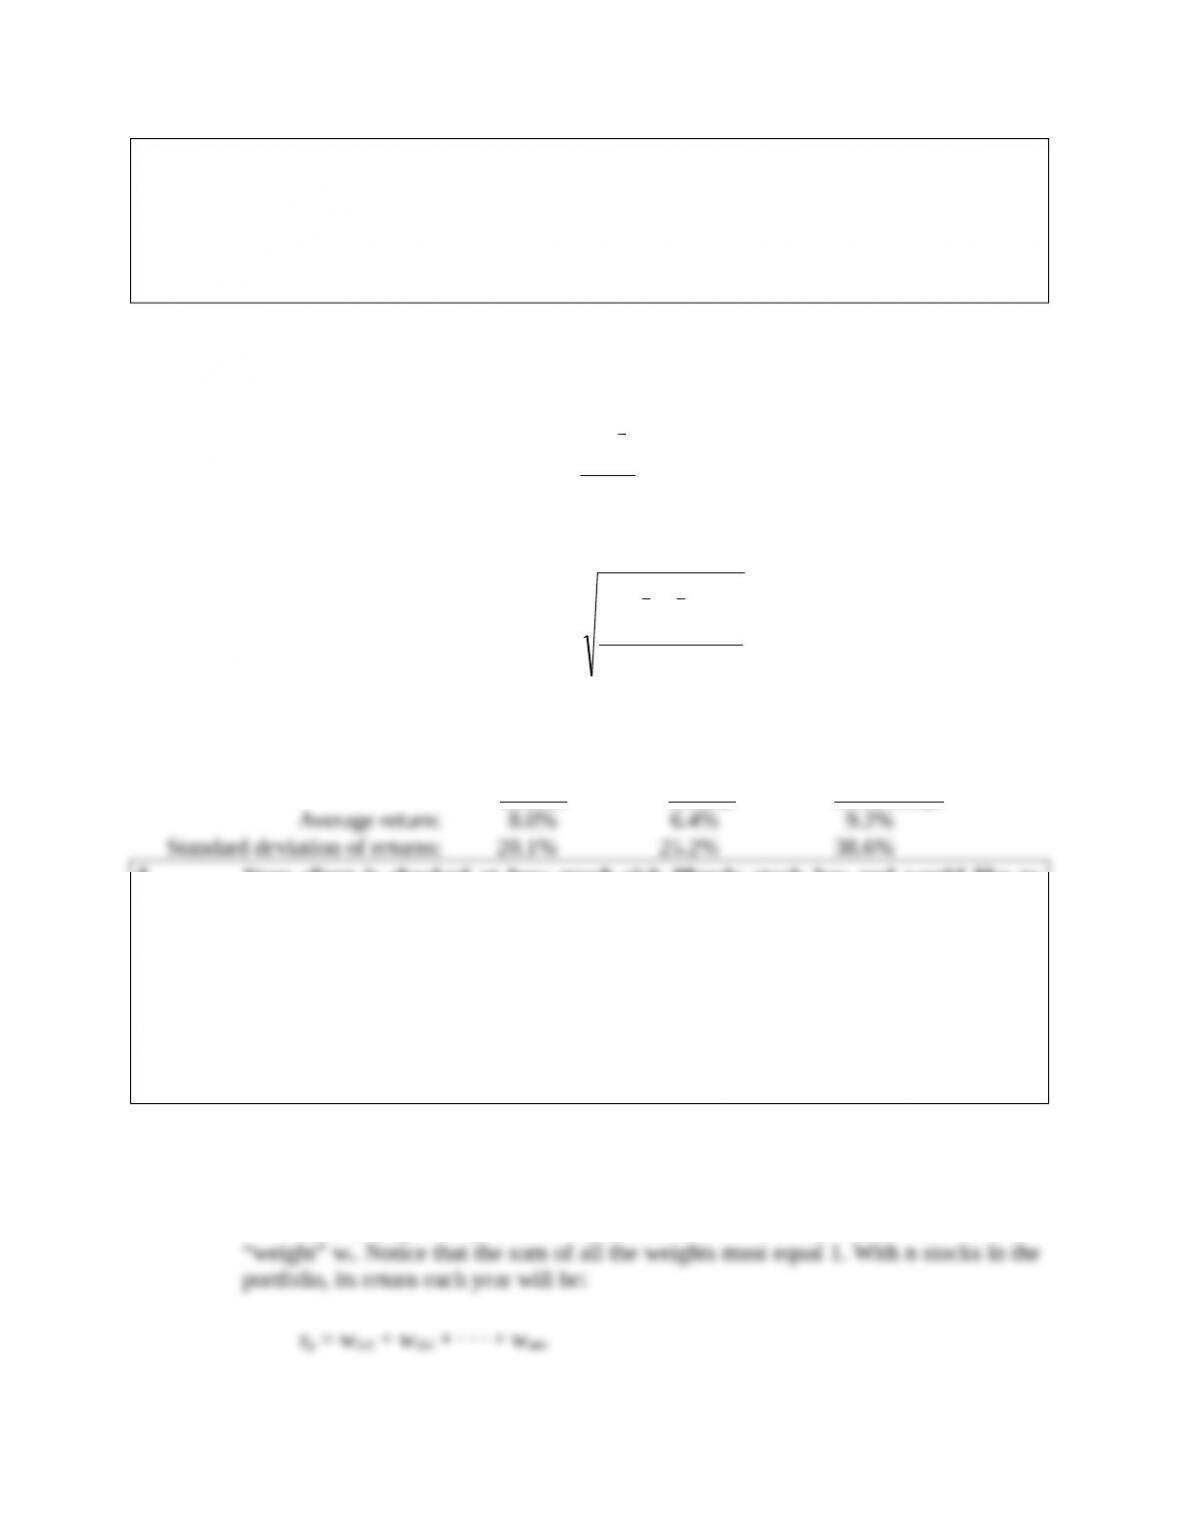
Answer: The formulas are shown below:
rAvg =
T
r
T
1t t
Estimated σ = S =
1T
)rr(
T
1t
2
Avg
t
Using Excel, the past average returns and standard deviations are:
Market Blandy Gourmange
Average return: 8.0% 6.4% 9.2%
Standard deviation of returns: 20.1% 25.2% 38.6%
f. Your client is shocked at how much risk Blandy stock has and would like to
reduce the level of risk. You suggest that the client sell 25% of the Blandy stock
and create a portfolio with 75% Blandy stock and 25% in the high-risk
Gourmange stock. How do you suppose the client will react to replacing some of
the Blandy stock with high-risk stock? Show the client what the proposed
portfolio return would have been in each of year of the sample. Then calculate
the average return and standard deviation using the portfolio’s annual returns.
How does the risk of this two-stock portfolio compare with the risk of the
individual stocks if they were held in isolation?
Answer: To find historical returns on the portfolio, we first find each annual return for the
portfolio using the portfolio weights and the annual stock returns:
The percentage of a portfolio’s value that is invested in Stock i is denoted by the
=
n
1i
iirw
The portfolio return each year will be:
´rP ,t =wBlandy
(
´rBlandy ,t
)
+wGour .
(
´rGour . ,t
)
´rP ,t =0.75
(
´rBlandy, t
)
+0.25
(
´rGour . ,t
)
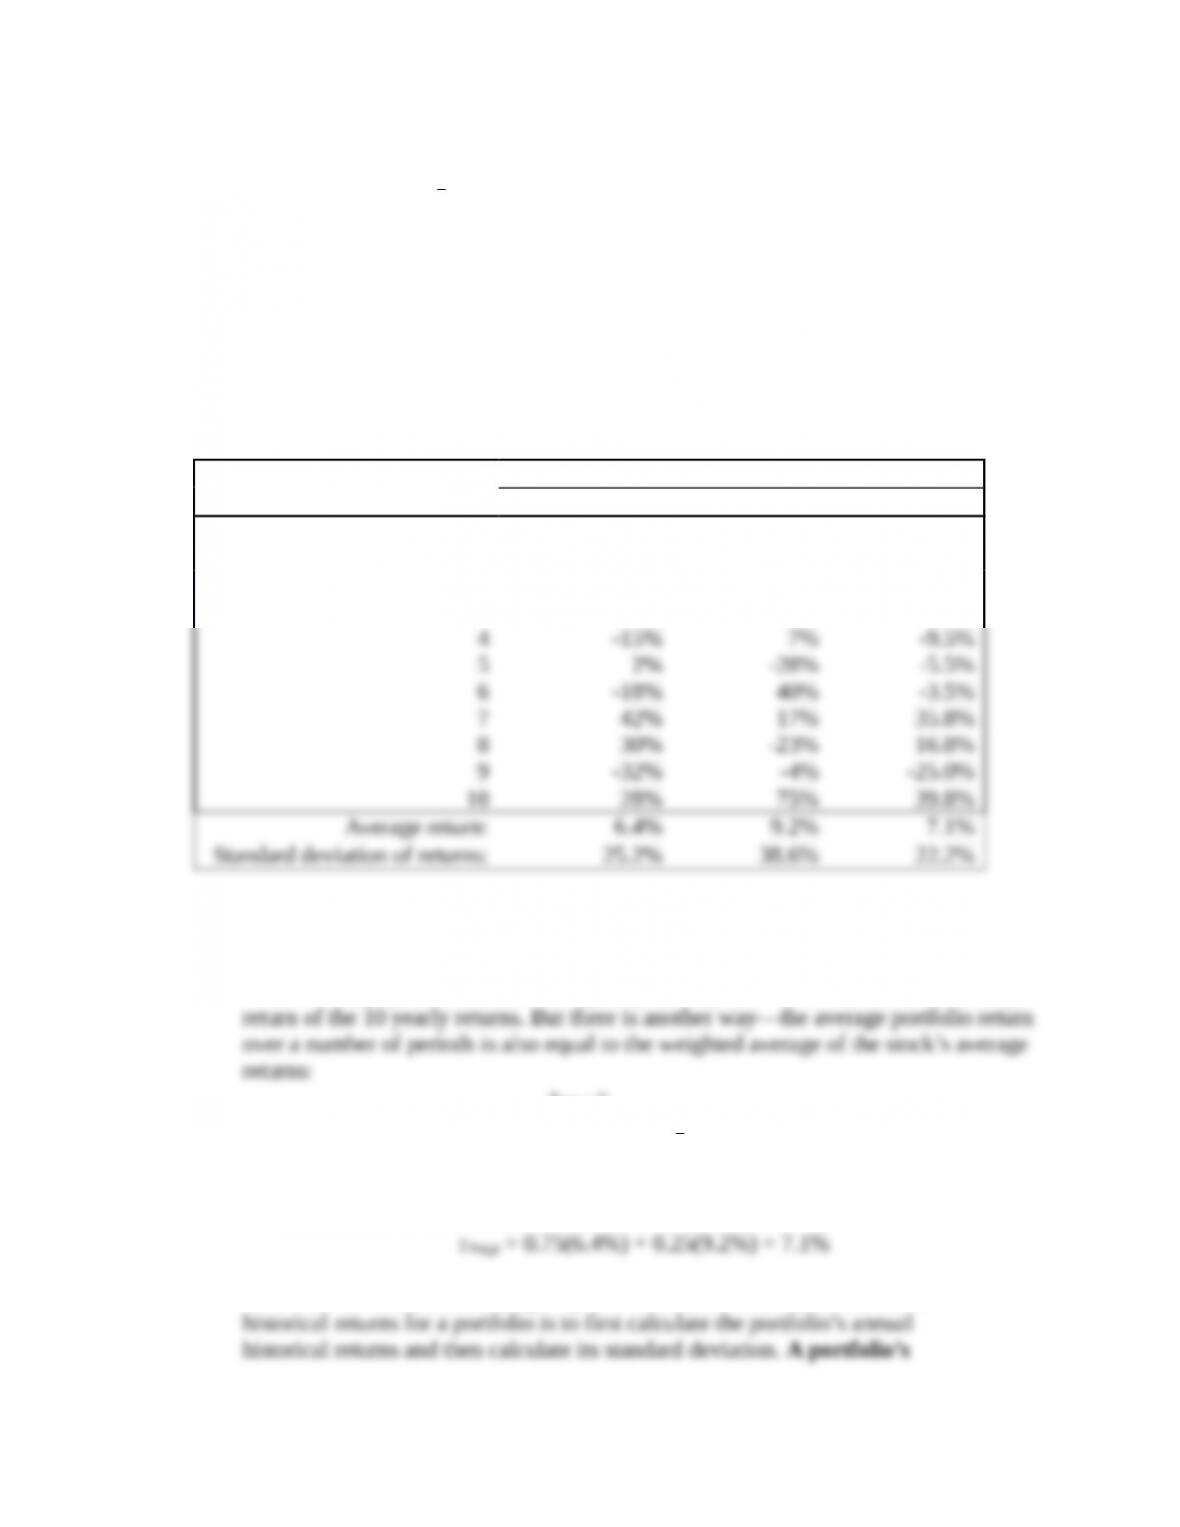
Following is a table showing the portfolio’s return in each year. It also shows the
average return and standard deviation during the past 10 years.
Stock Returns
Year Blandy Gourmange Portfolio
1 26% 47% 31.3%
2 15% -54% -2.3%
3 -14% 15% -6.8%
Notice that the portfolio risk is actually less than the standard deviations of the
stocks making up the portfolio.
The average portfolio return during the past 10 years can be calculated as average
rAvg,p =
n
1i
iAvg,i
rw
This method is used below:
Note, however, that the only way to calculate the standard deviation of
historical standard deviation is not the weighted average of the individual
stocks’ standard deviations! (The only exception occurs when there is zero
correlation among the portfolio’s stocks, which would be extremely rare.)
g. Explain correlation to your client. Calculate the estimated correlation between
Blandy and Gourmange. Does this explain why the portfolio standard deviation
was less than Blandy’s standard deviation?
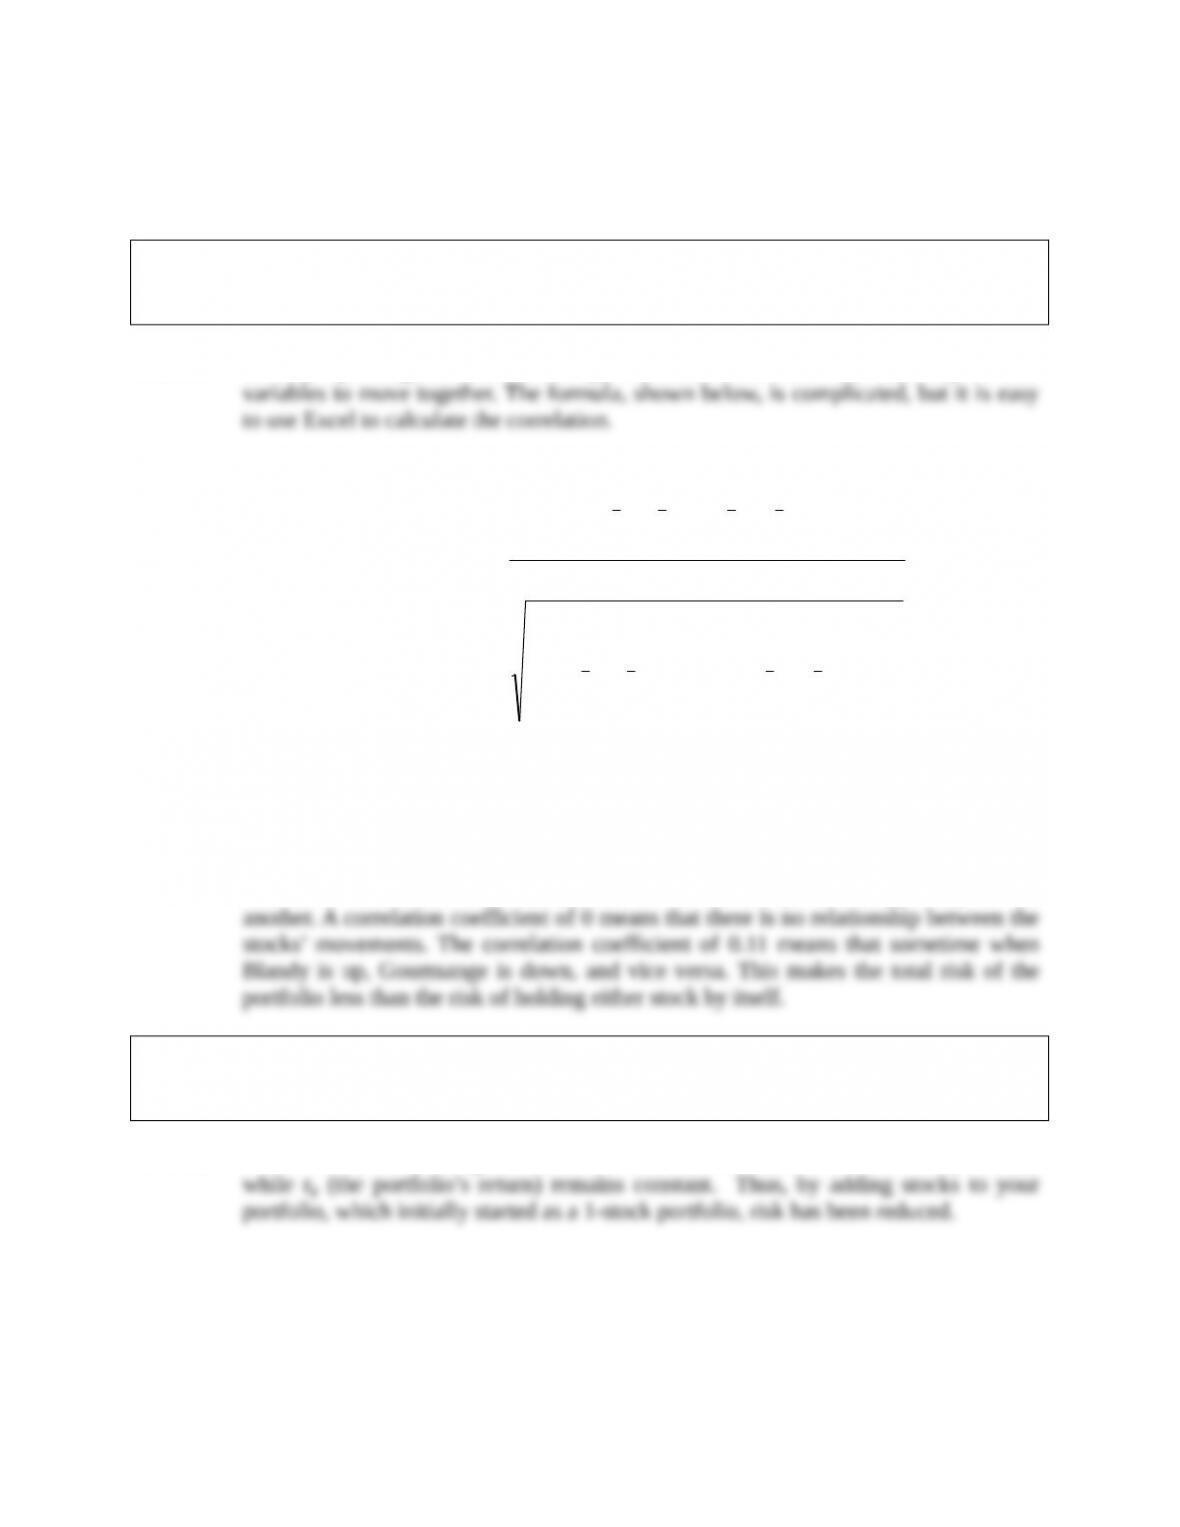
Answer: Loosely speaking, the correlation (ρ) coefficient measures the tendency of two
Estimated ρi,j = R =
T
1t
2
Avgj,tj,
T
1t
2
Avgi,ti,
T
1t
Avgj,tj,Avgi,ti,
)rr()rr(
)rr)(rr(
Using Excel, the correlation between Blandy (B) and Gourmange (G) is:
Est. ρB,G = 0.11
A correlation coefficient of +1 means that the stocks always move together; a
correlation coefficient of −1 means that the stocks always move oppositely to one
h. Suppose an investor starts with a portfolio consisting of one randomly selected
stock. As more and more randomly selected stocks are added to the portfolio,
what happens to the portfolio’s risk?
Answer: The standard deviation gets smaller as more stocks are combined in the portfolio,
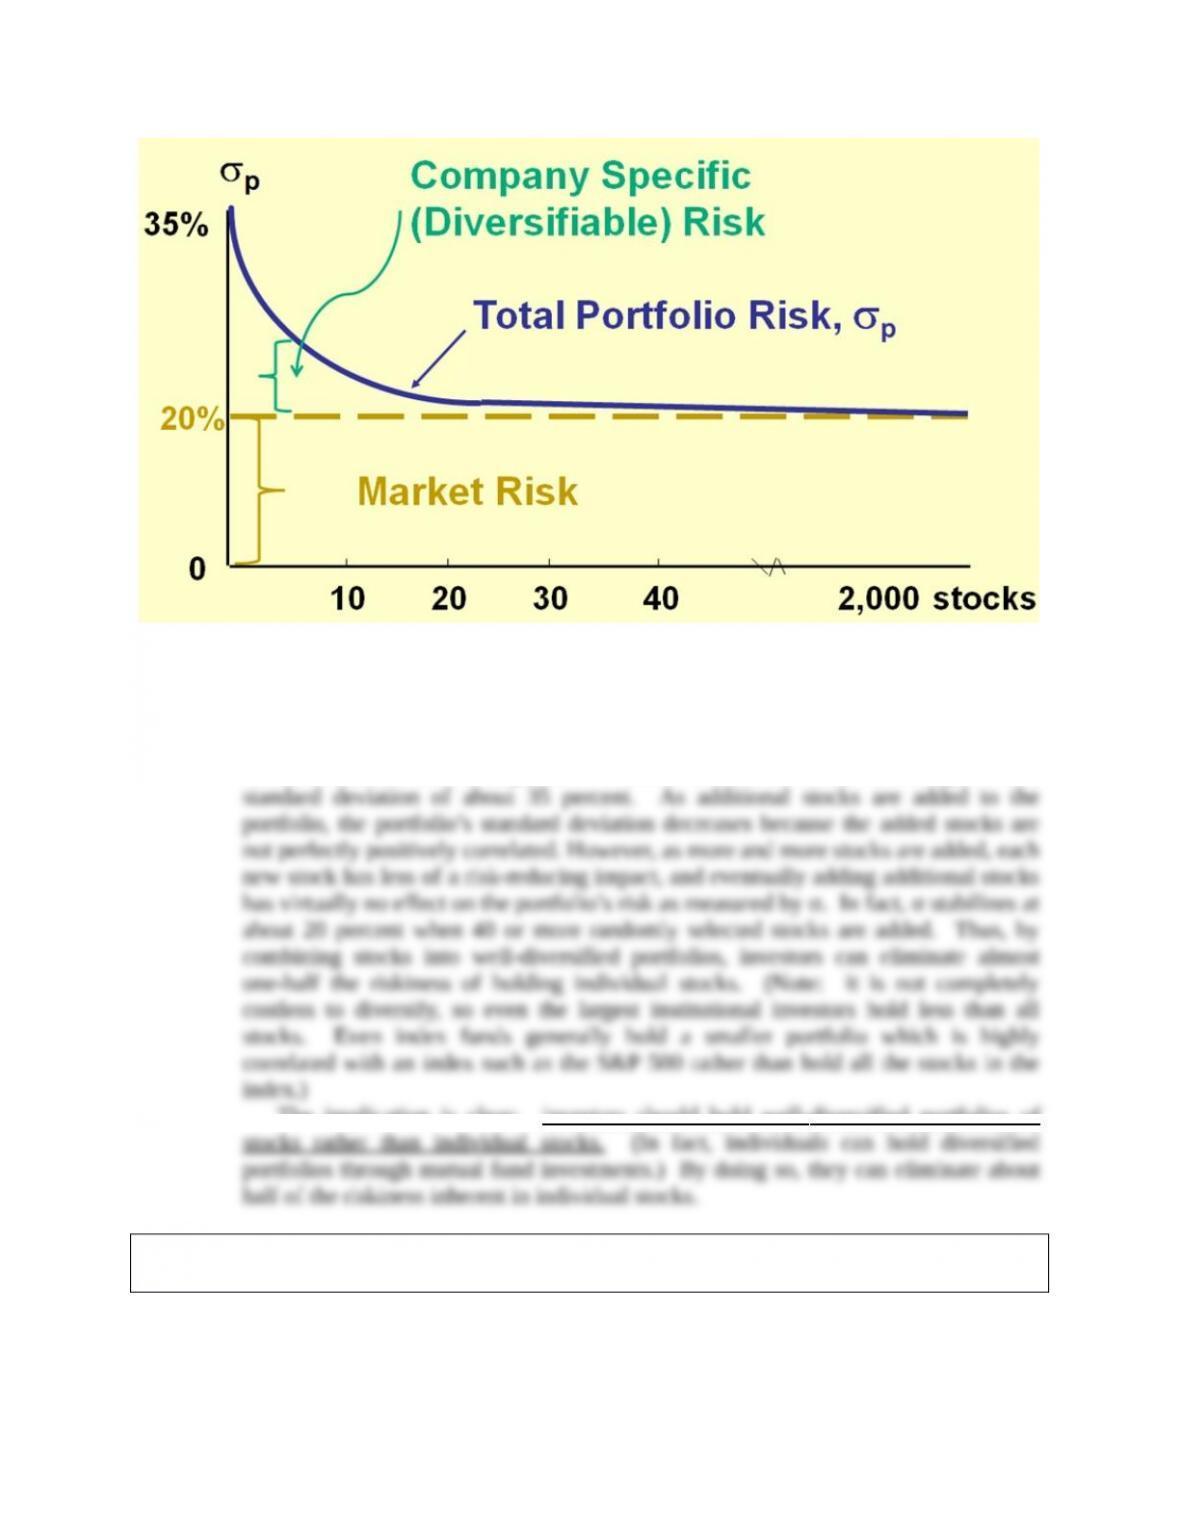
In the real world, stocks are positively correlated with one another–if the
economy does well, so do stocks in general, and vice versa. Correlation coefficients
between stocks generally range from +0.5 to +0.7. The average correlation between
stocks is about 0.35. A single stock selected at random would on average have a
The implication is clear: investors should hold well – diversified portfolios of
i. 1. Should portfolio effects influence how investors think about the risk of
individual stocks?
Answer: Portfolio diversification does affect investors’ views of risk. A stock’s stand-alone
risk as measured by its σ or CV, may be important to an undiversified investor, but it
i. 2. If you decided to hold a one-stock portfolio and consequently were exposed to
more risk than diversified investors, could you expect to be compensated for all
of your risk; that is, could you earn a risk premium on that part of your risk that
you could have eliminated by diversifying?
Answer: If you hold a one-stock portfolio, you will be exposed to a high degree of risk, but
you won’t be compensated for it. If the return were high enough to compensate you
j. According to the Capital Asset Pricing Model, what measures the amount of risk
that an individual stock contributes to a well-diversified portfolio? Define this
measurement.
Answer: Market risk, which is relevant for stocks held in well-diversified portfolios, is defined
bi =
iM
M
i
A stock’s beta can also be estimated by running a regression with the stock’s
k. What is the Security Market Line (SML)? How is beta related to a stock’s
required rate of return?
Answer: Here is the SML equation:
ri = rRf + RPM bi.
ri = rRf + (rM − rRf)bi.
The SML asserts that because investing in stocks is risky, an investor must expect
l. Calculate the correlation coefficient between Blandy and the market. Use this
and the previously calculated (or given) standard deviations of Blandy and the
market to estimate Blandy’s beta. Does Blandy contribute more or less risk to a
well-diversified portfolio than does the average stock? Use the SML to estimate
Blandy’s required return.
Answer: Using the formula for correlation or the Excel function, CORREL, Blandy’s
correlation with the market (ρB,M) is:
bi =
)481.0(
201.0
252.0
iM
M
i
= 0.6
Blandy’s beta is less than 1, so it contributes less risk than that of an average
stock.
Suppose the risk free rate is 4% and the market risk premium is 5%. The required
rate of return on Blandy is
m. Show how to estimate beta using regression analysis.
Answer: Betas are calculated as the slope of the “characteristic” line, which is the regression
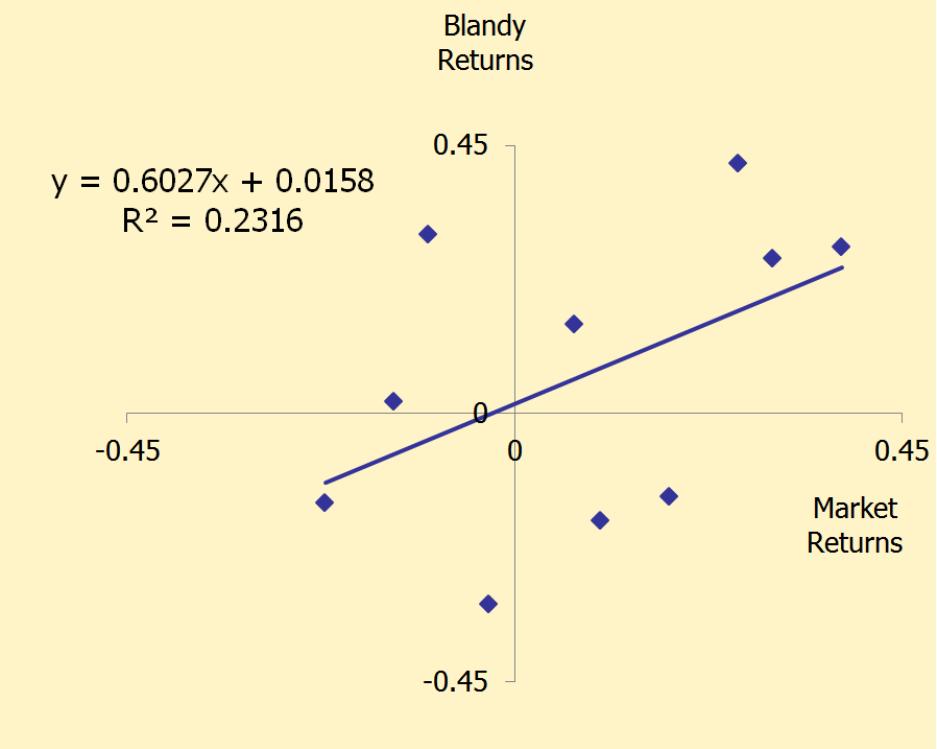
s