
SOLUTION TO SPREADSHEET PROBLEM
4-35 The detailed solution for the spreadsheet problem, Ch04 P35 Build a Model
Solution.xlsx, is available on the textbook’s Web site.
Answers and Solutions: 4 -1
© 2017 Cengage Learning. All Rights Reserved. May not be scanned, copied or duplicated, or posted to a publicly accessible website, in whole or
in part.
MINI CASE
Assume that you are nearing graduation and have applied for a job with a local bank. As
part of the bank’s evaluation process, you have been asked to take an examination that
covers several financial analysis techniques. The first section of the test addresses
discounted cash flow analysis. See how you would do by answering the following questions.
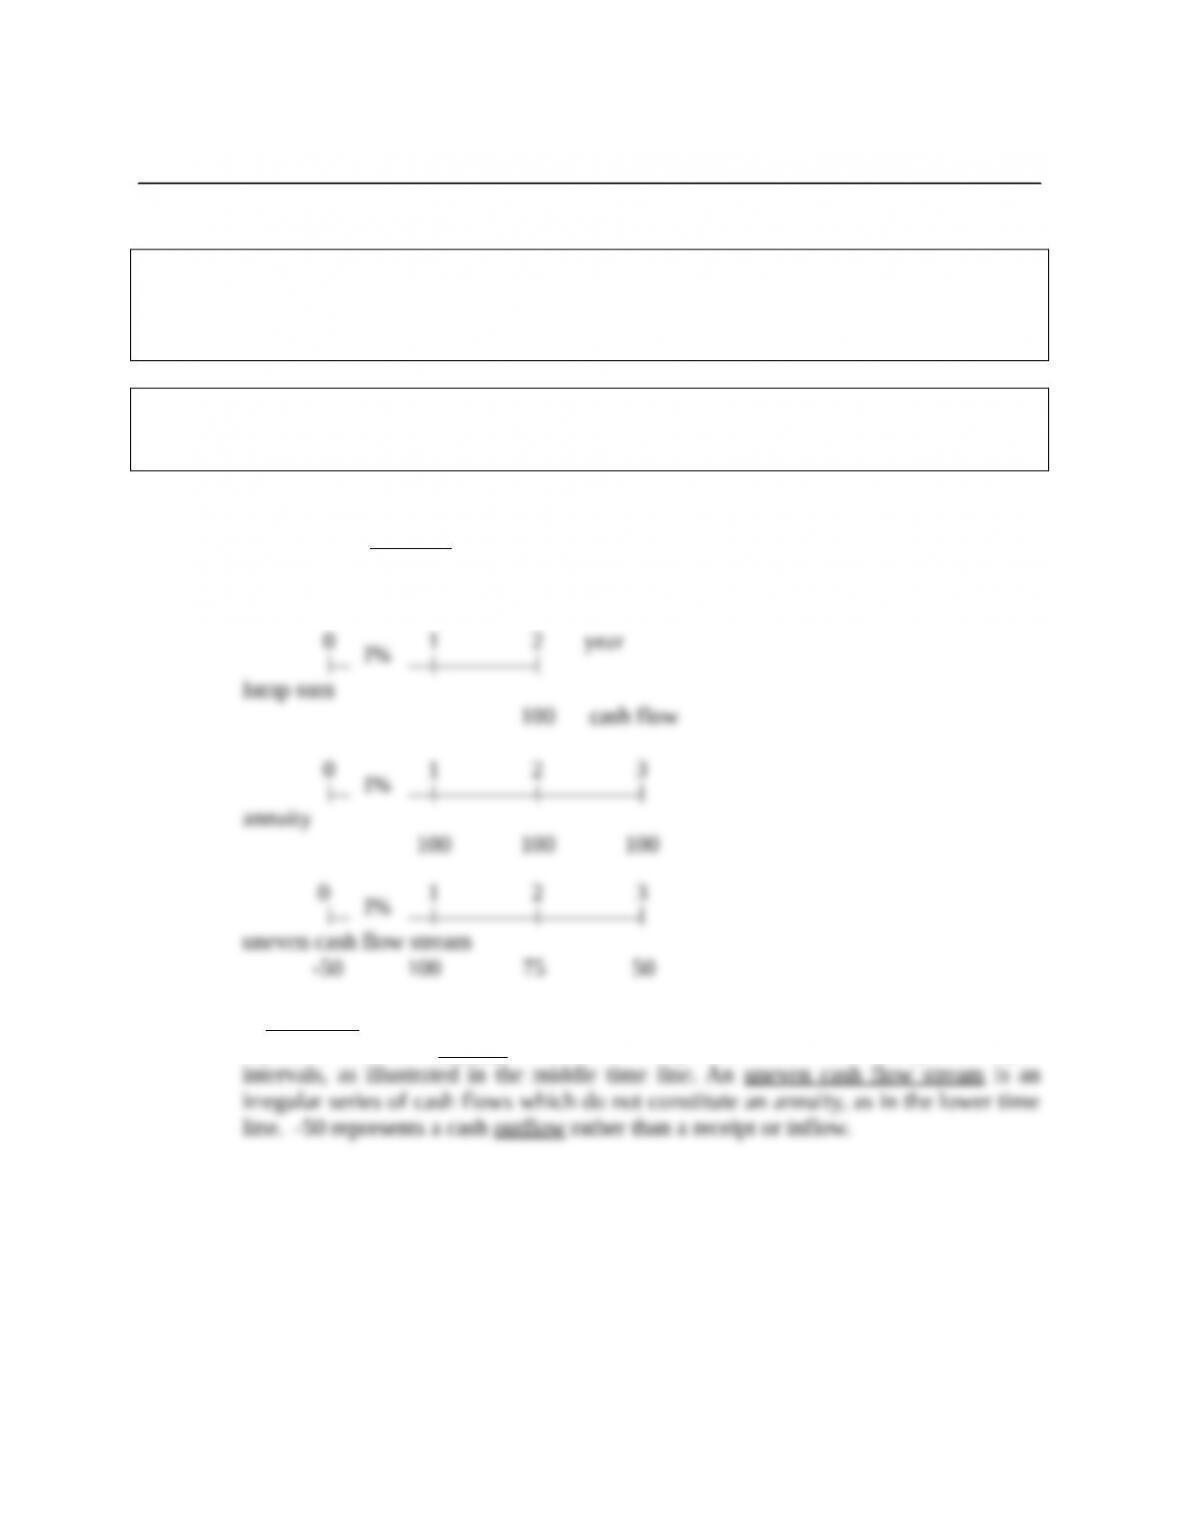
a. Draw time lines for (a) a $100 lump sum cash flow at the end of year 2, (b) an
ordinary annuity of $100 per year for 3 years, and (c) an uneven cash flow
stream of -$50, $100, $75, and $50 at the end of years 0 through 3.
Answer: (Begin by discussing basic discounted cash flow concepts, terminology, and solution
methods.) A time line is a graphical representation which is used to show the timing
of cash flows. The tick marks represent end of periods (often years), so time 0 is
today; time 1 is the end of the first year, or 1 year from today; and so on.
A lump sum is a single flow; for example, a $100 inflow in year 2, as shown in the
top time line. An annuity is a series of equal cash flows occurring over equal
Answers and Solutions: 4 -2
© 2017 Cengage Learning. All Rights Reserved. May not be scanned, copied or duplicated, or posted to a publicly accessible website, in whole or
in part.
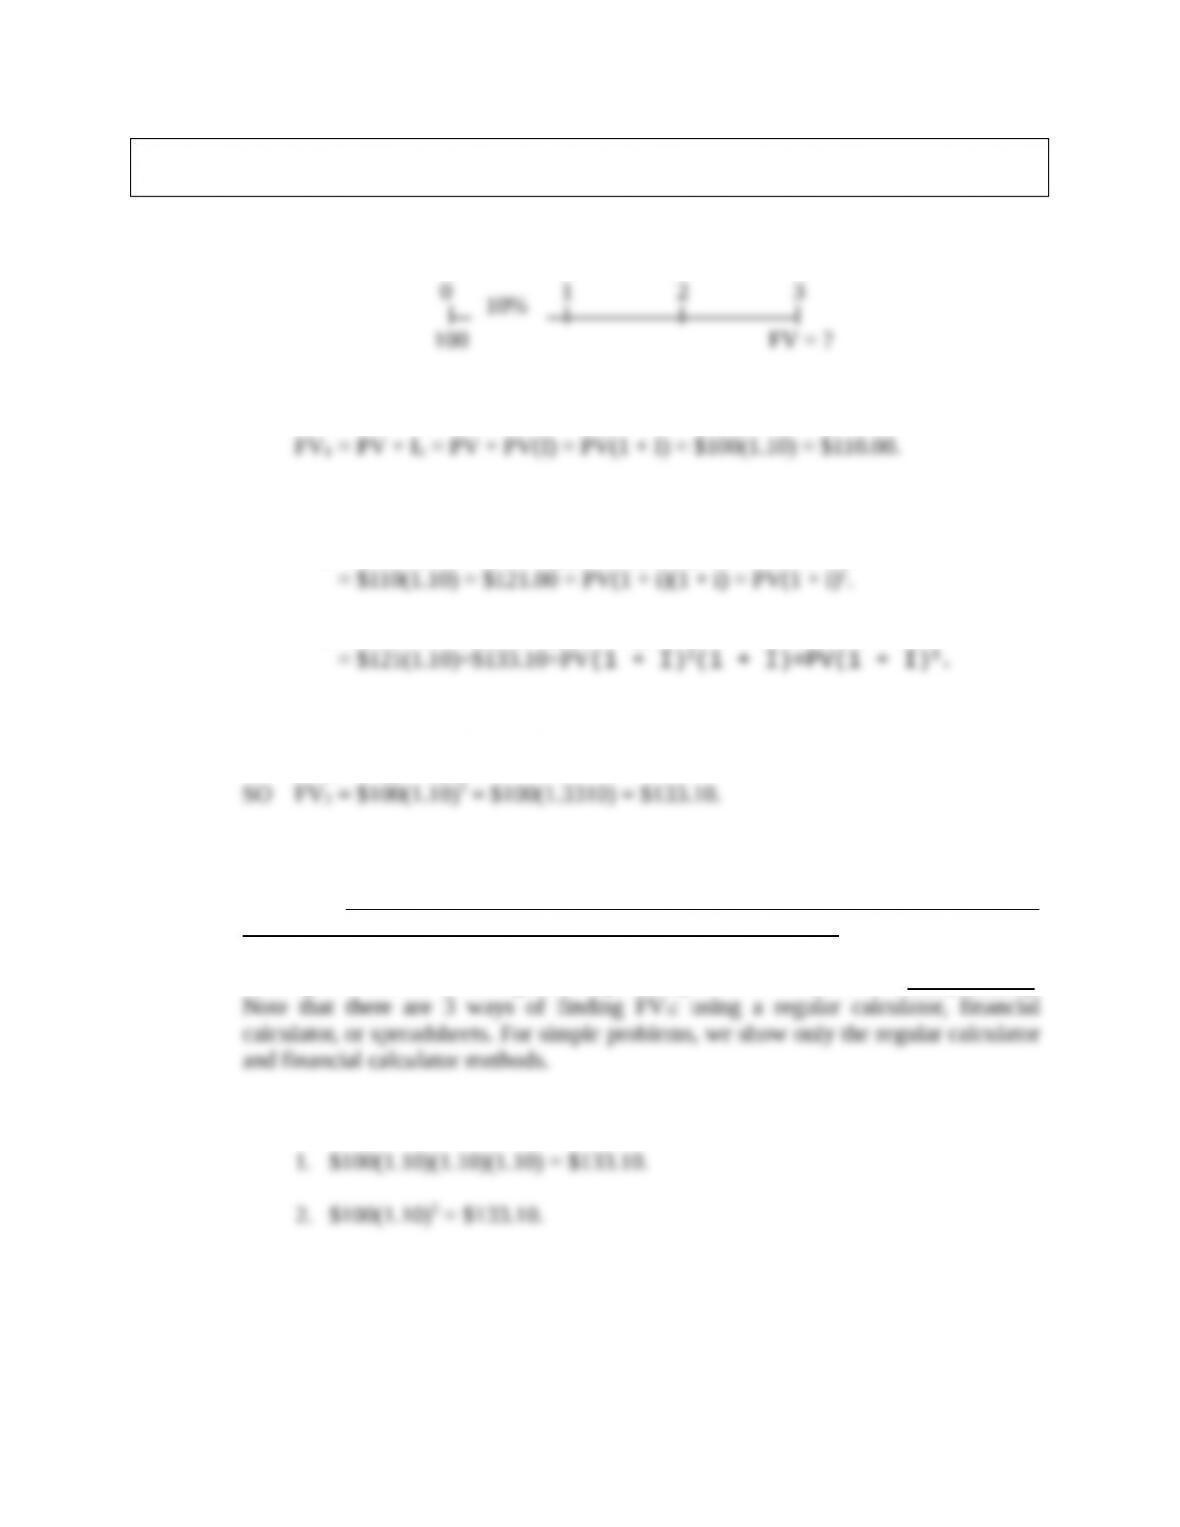
b. 1. What is the future value of an initial $100 after 3 years if it is invested in an
account paying 10% annual interest?
Answer: Show dollars corresponding to question mark, calculated as follows:
After 1 year:
Similarly:
FV2= FV1 + I2 = FV1 + FV1(I) = FV1(1 + I)
FV3= FV2 + I3 = FV2 + FV2(I) = FV2(1 + I)
In general, we see that:
FVn= PV(1 + I)N,
Note that this equation has 4 variables: FVN, PV, I, and N. Here we know all except
FVN, so we solve for FVN. We will, however, often solve for one of the other three
variables. By far, the easiest way to work all time value problems is with a financial
calculator. Just plug in any 3 of the four values and find the 4th.
Finding future values (moving to the right along the time line) is called compounding.
(1) regular calculator:
Answers and Solutions: 4 -3
© 2017 Cengage Learning. All Rights Reserved. May not be scanned, copied or duplicated, or posted to a publicly accessible website, in whole or
in part.
(2) financial calculator:
This is especially efficient for more complex problems, including exam
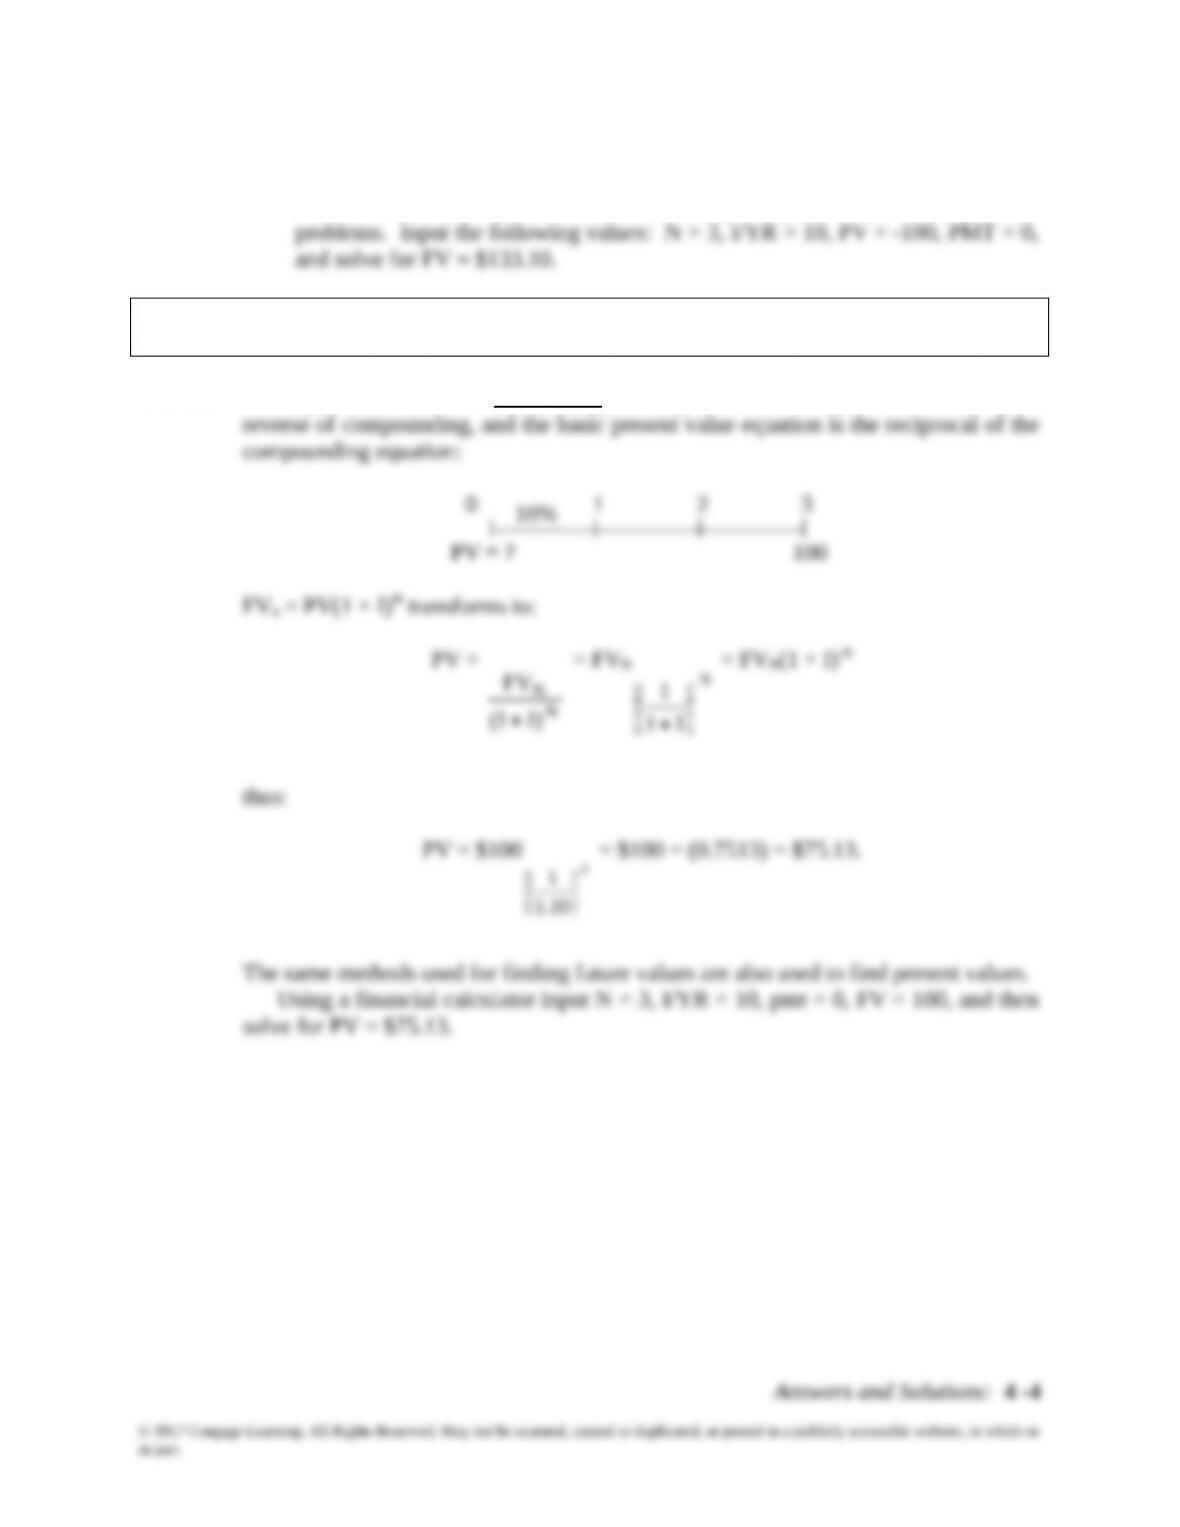
b. 2. What is the present value of $100 to be received in 3 years if the appropriate
interest rate is 10%?
Answer: Finding present values, or discounting (moving to the left along the time line), is the
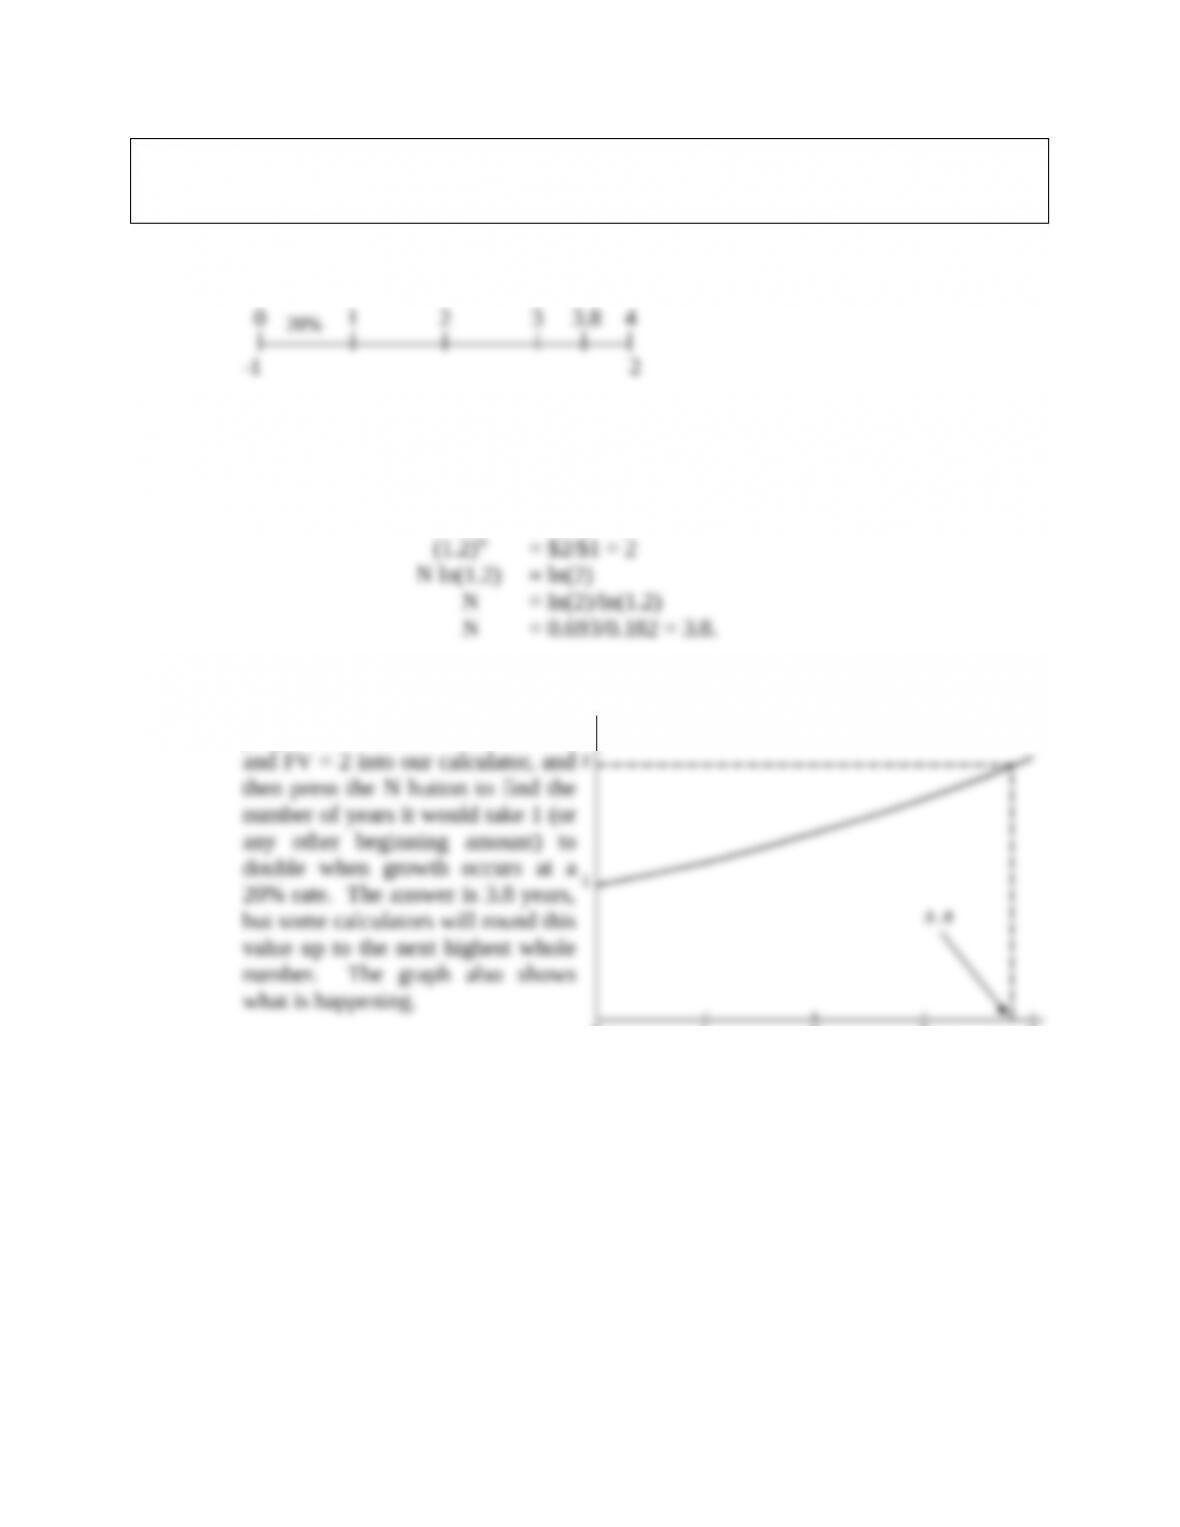
c. We sometimes need to find out how long it will take a sum of money (or anything
else) to grow to some specified amount. For example, if a company’s sales are
growing at a rate of 20% per year, how long will it take sales to double?
Answer: We have this situation in time line format:
Say we want to find out how long it will take us to double our money at an interest
rate of 20%. We can use any numbers, say $1 and $2, with this equation:
FVN = $2 = $1(1 + I)N = $1(1.20)N.
Alternatively, we could use a
financial calculator. We would
plug I/YR = 20, PV = -1, PMT = 0,
1
Answers and Solutions: 4 -5
© 2017 Cengage Learning. All Rights Reserved. May not be scanned, copied or duplicated, or posted to a publicly accessible website, in whole or
in part.
FV
Year
2
1
0
3
4
d. If you want an investment to double in 3 years, what interest rate must it earn?
Answer: 0 1 2 3
| | | |
-1 2
1(1 + I) 1(1 + I)2 1(1 + I)3
FV = $1(1 + I)3= $2.
Calculators can find interest rates quite easily, even when periods and/or interest
e. What is the difference between an ordinary annuity and an annuity due? What
type of annuity is shown below? How would you change it to the other type of
annuity?
0 1 2 3
| | | |
100 100 100
Answer: This is an ordinary annuity–it has its payments at the end of each period; that is, the
The annuity shown above is an ordinary annuity. To convert it to an annuity due,
Answers and Solutions: 4 -6
© 2017 Cengage Learning. All Rights Reserved. May not be scanned, copied or duplicated, or posted to a publicly accessible website, in whole or
in part.
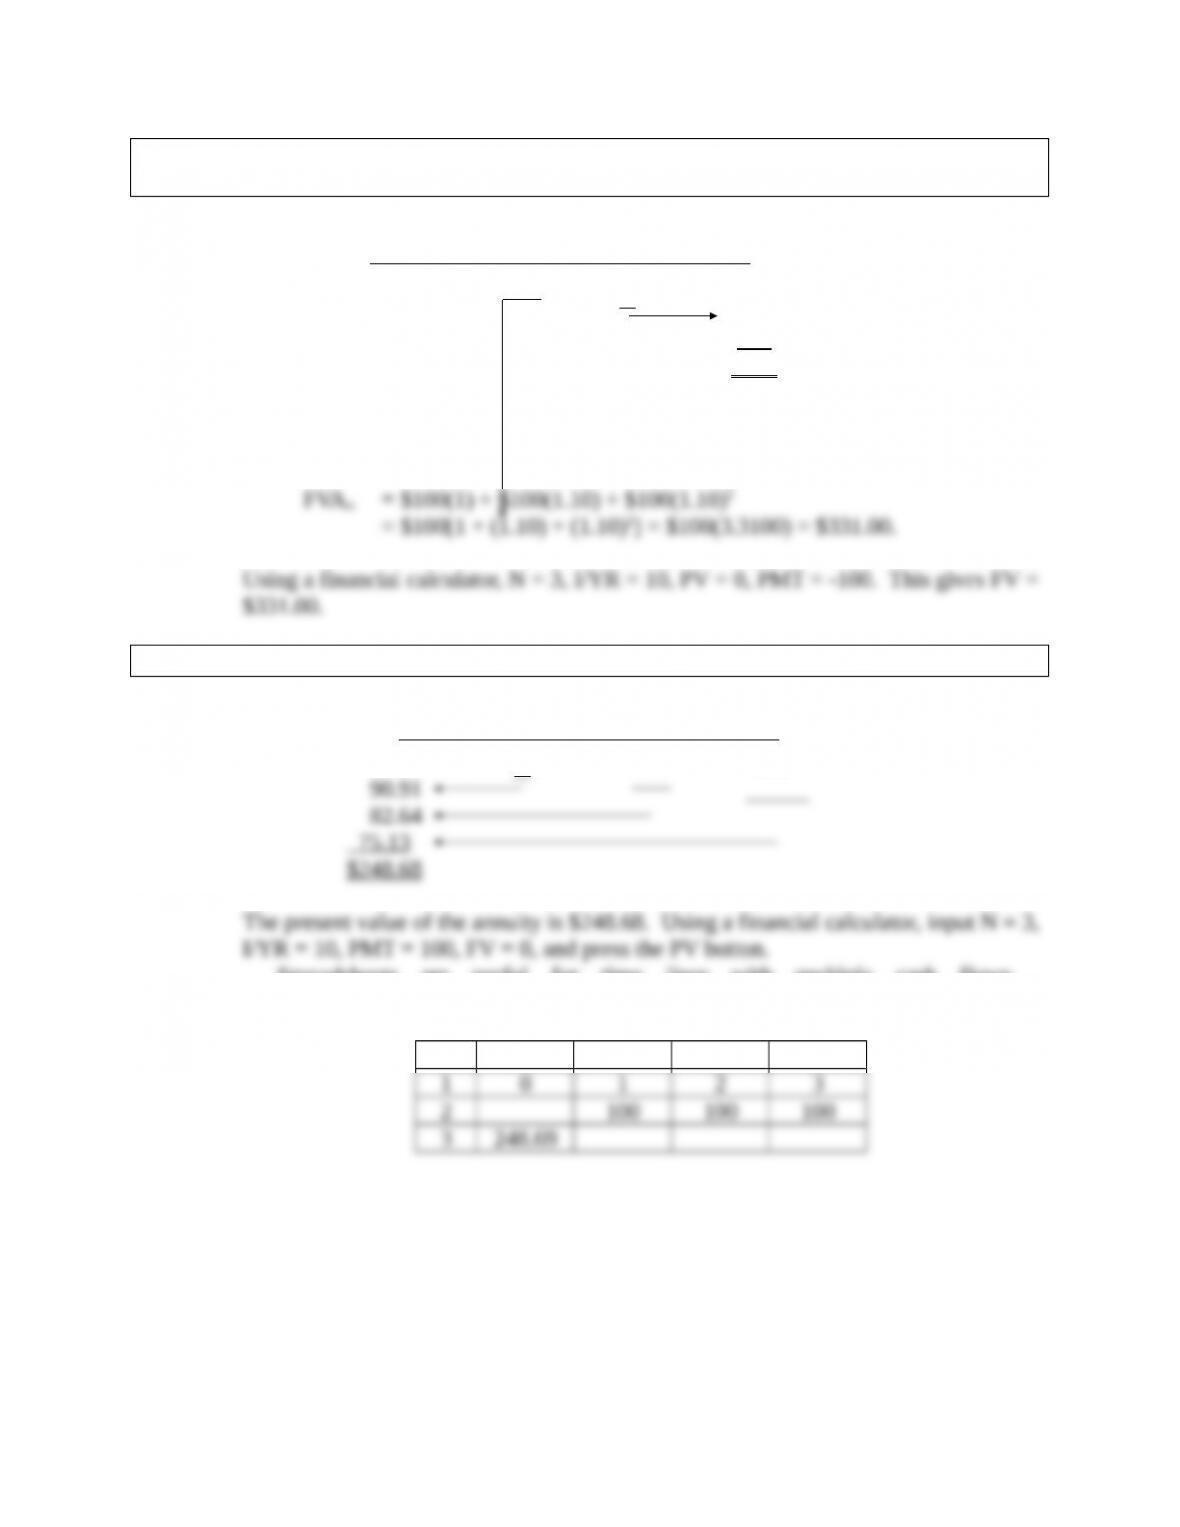
f. 1. What is the future value of a 3-year ordinary annuity of $100 if the appropriate
interest rate is 10%?
Answer: 0 1 2 3
| | | |
100 100 100
110
121
$331
Go through the following discussion. One approach would be to treat each annuity
flow as a lump sum. Here we have
f. 2. What is the present value of the annuity?
Answer: 0 1 2 3
| | | |
100 100 100
Spreadsheets are useful for time lines with multiple cash flows.
The following spreadsheet shows this problem:
A B C D
The excel formula in cell A3 is = NPV(10%,B2:D2). This gives a result of 248.69.
Note that the interest rate can be either 10% or 0.10, not just 10. Also, note that the
range does not include any cash flow at time zero.
Answers and Solutions: 4 -7
© 2017 Cengage Learning. All Rights Reserved. May not be scanned, copied or duplicated, or posted to a publicly accessible website, in whole or
in part.
10%
10%
Excel also has special functions for annuities. For ordinary annuities, the excel
f. 3. What would the future and present values be if the annuity were an annuity
due?
Answer: If the annuity were an annuity due, each payment would be shifted to the left, so each
payment is compounded over an additional period or discounted back over one less
period.
To find the future value of an annuity due use the following formula:
FVAn(Annuity Due) = FVAn(1 + I).
The best way to work annuity due problems is to switch your calculator to “beg”
This formula could be used to find the present value of an annuity due:
PVAn(Annuity Due) = PVAn(1 + I).
The Excel function is = PV(10%,3,-100,0,1). The fourth term, 0, tells Excel there are
Answers and Solutions: 4 -8
© 2017 Cengage Learning. All Rights Reserved. May not be scanned, copied or duplicated, or posted to a publicly accessible website, in whole or
in part.
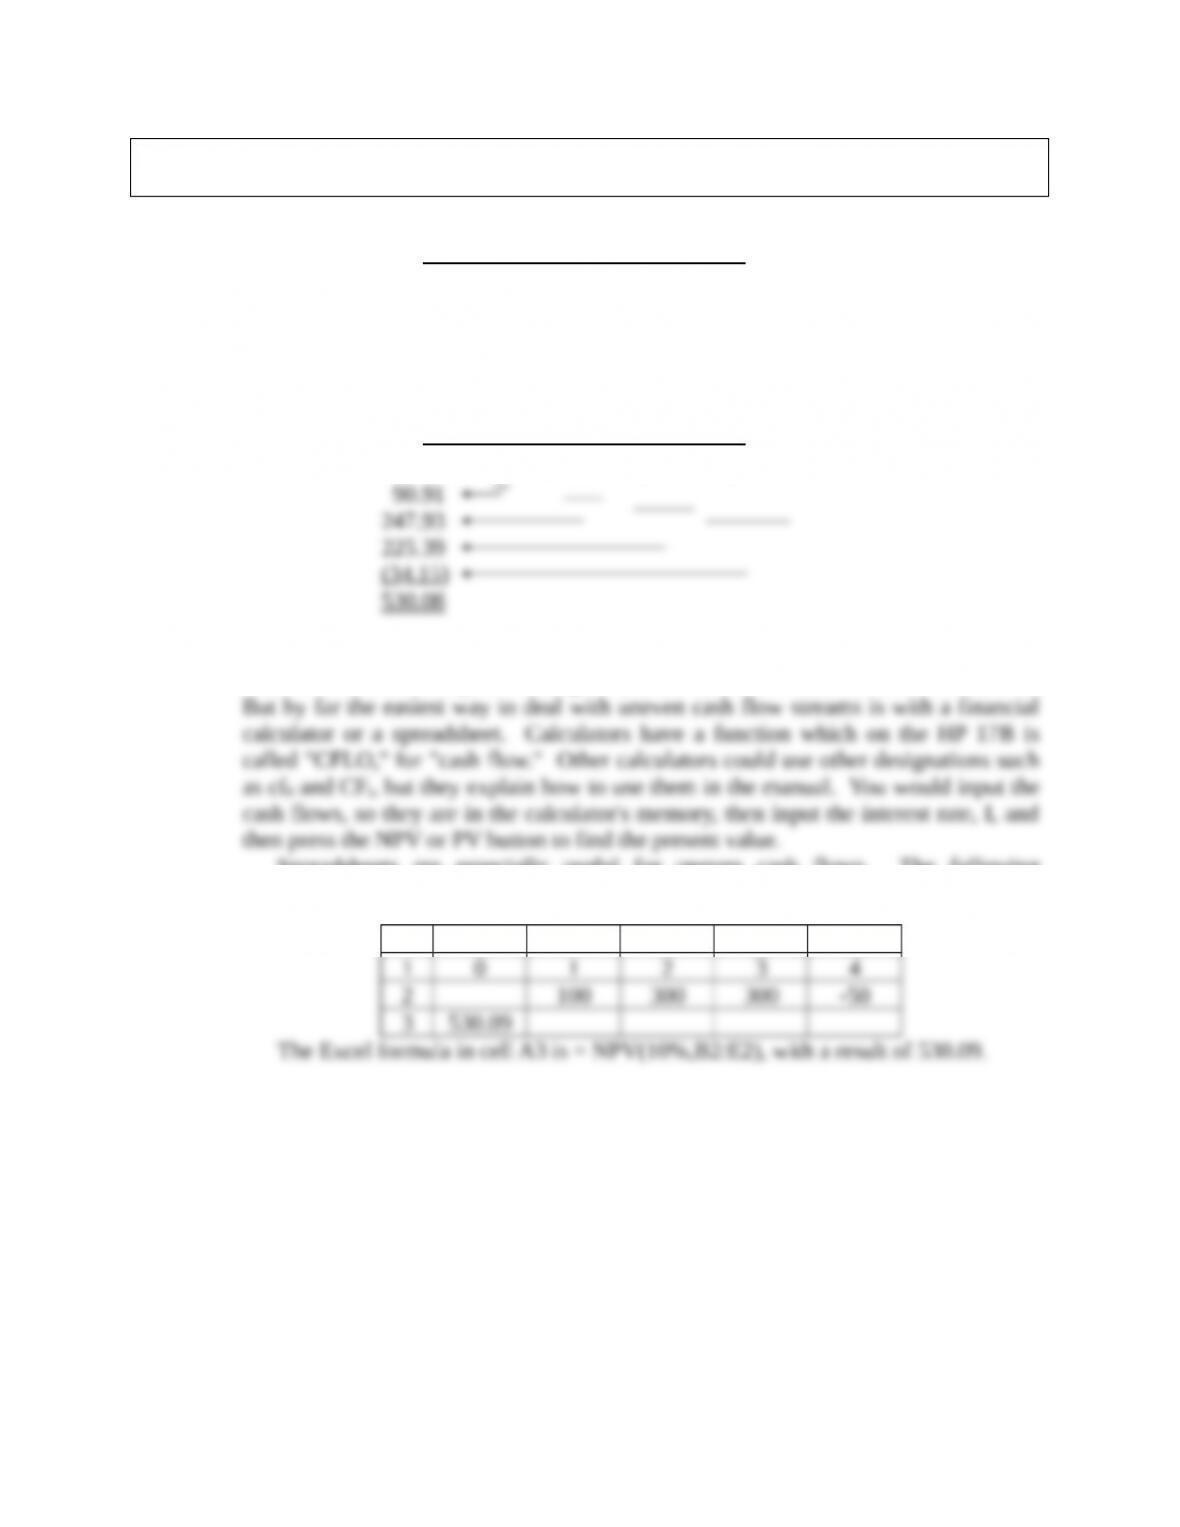
g. What is the present value of the following uneven cash flow stream? The
appropriate interest rate is 10%, compounded annually.
0 1 2 3 4 years
| | | | |
0 100 300 300 -50
Answer: Here we have an uneven cash flow stream. The most straightforward approach is to
find the PVs of each cash flow and then sum them as shown below:
0 1 2 3 4 years
| | | | |
100 300 300 -50
Note (1) that the $50 year 4 outflow remains an outflow even when discounted.
There are numerous ways of finding the present value of an uneven cash flow stream.
Spreadsheets are especially useful for uneven cash flows. The following
spreadsheet shows this problem:
A B C D E
Answers and Solutions: 4 -9
© 2017 Cengage Learning. All Rights Reserved. May not be scanned, copied or duplicated, or posted to a publicly accessible website, in whole or
in part.
10%