f. Calculate the 2017 price/earnings ratio, price/cash flow ratios, and market/book
ratio. Do these ratios indicate that investors are expected to have a high or low
opinion of the company?
Price/Earnings17 = Price Per Share/Earnings Per Share
Cash Flow/Share17 = (NI + DEP)/Shares
BVPS = Common Equity/Shares Outstanding
Market/Book = Market Price Per Share/Book Value Per Share
Both the P/E ratio and BVPS are above the 2015 and 2016 levels but below the
industry average.
g. Perform a common size analysis and percent change analysis. What do these
analyses tell you about Computron?
Answer: For the common size balance sheets, divide all items in a year by the total assets for
Mini Case: 3 – 1
© 2017 Cengage Learning. All Rights Reserved. May not be scanned, copied or duplicated, or posted to a publicly accessible
website, in whole or in part.
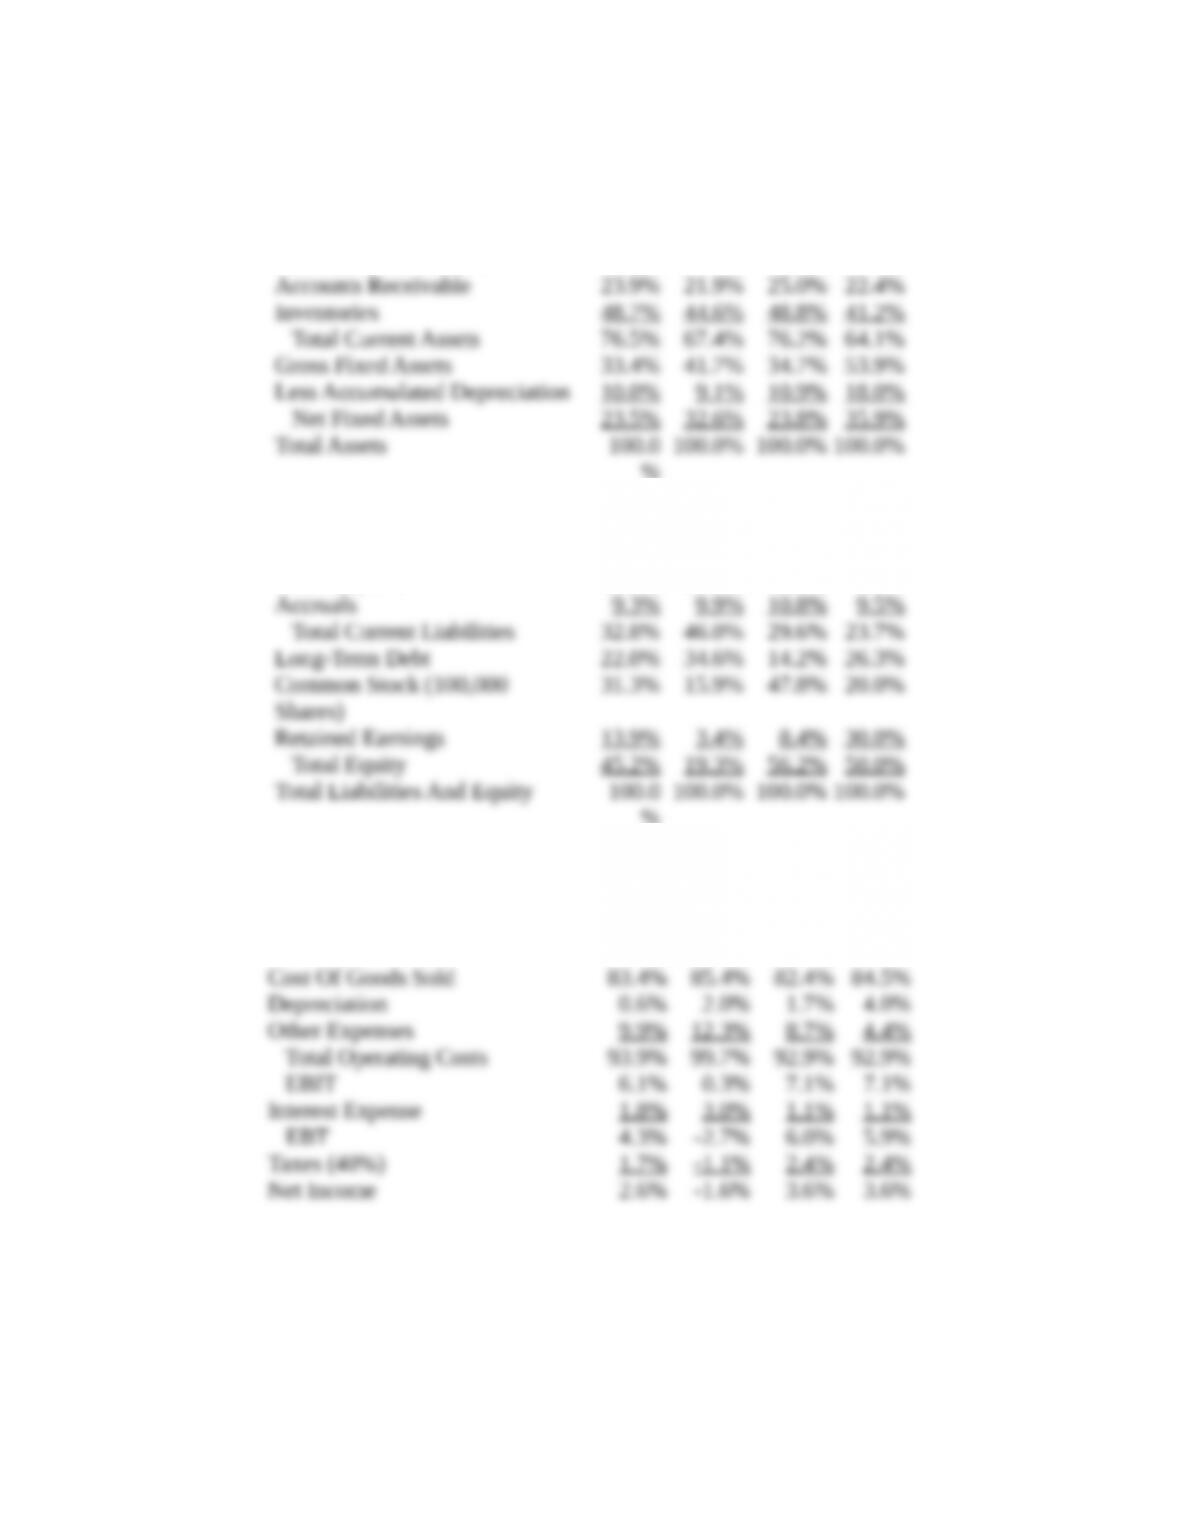
Common Size Balance Sheets
Assets
2015 2016 2017E Ind.
Cash 0.6% 0.3% 0.4% 0.3%
Short Term Investments 3.3% 0.7% 2.0% 0.3%
%
Liabilities And Equity 2015 2016 2017E Ind.
Accounts Payable 9.9% 11.2% 10.2% 11.9%
Notes Payable 13.6% 24.9% 8.5% 2.4%
%
Common Size Income
Statement
2015 2016 2017E Ind.
Sales 100.0
%
100.0
%
100.0
%
100.0%
Mini Case: 3 – 2
© 2017 Cengage Learning. All Rights Reserved. May not be scanned, copied or duplicated, or posted to a publicly accessible
website, in whole or in part.
Computron has higher proportion of inventory and current assets than
industry. Computron has slightly more equity (which means less debt) than industry.
Computron has more short-term debt than industry, but less long-term debt than
industry. Computron has lower COGS than industry, but higher other expenses.
Result is that Computron has similar EBIT as industry.
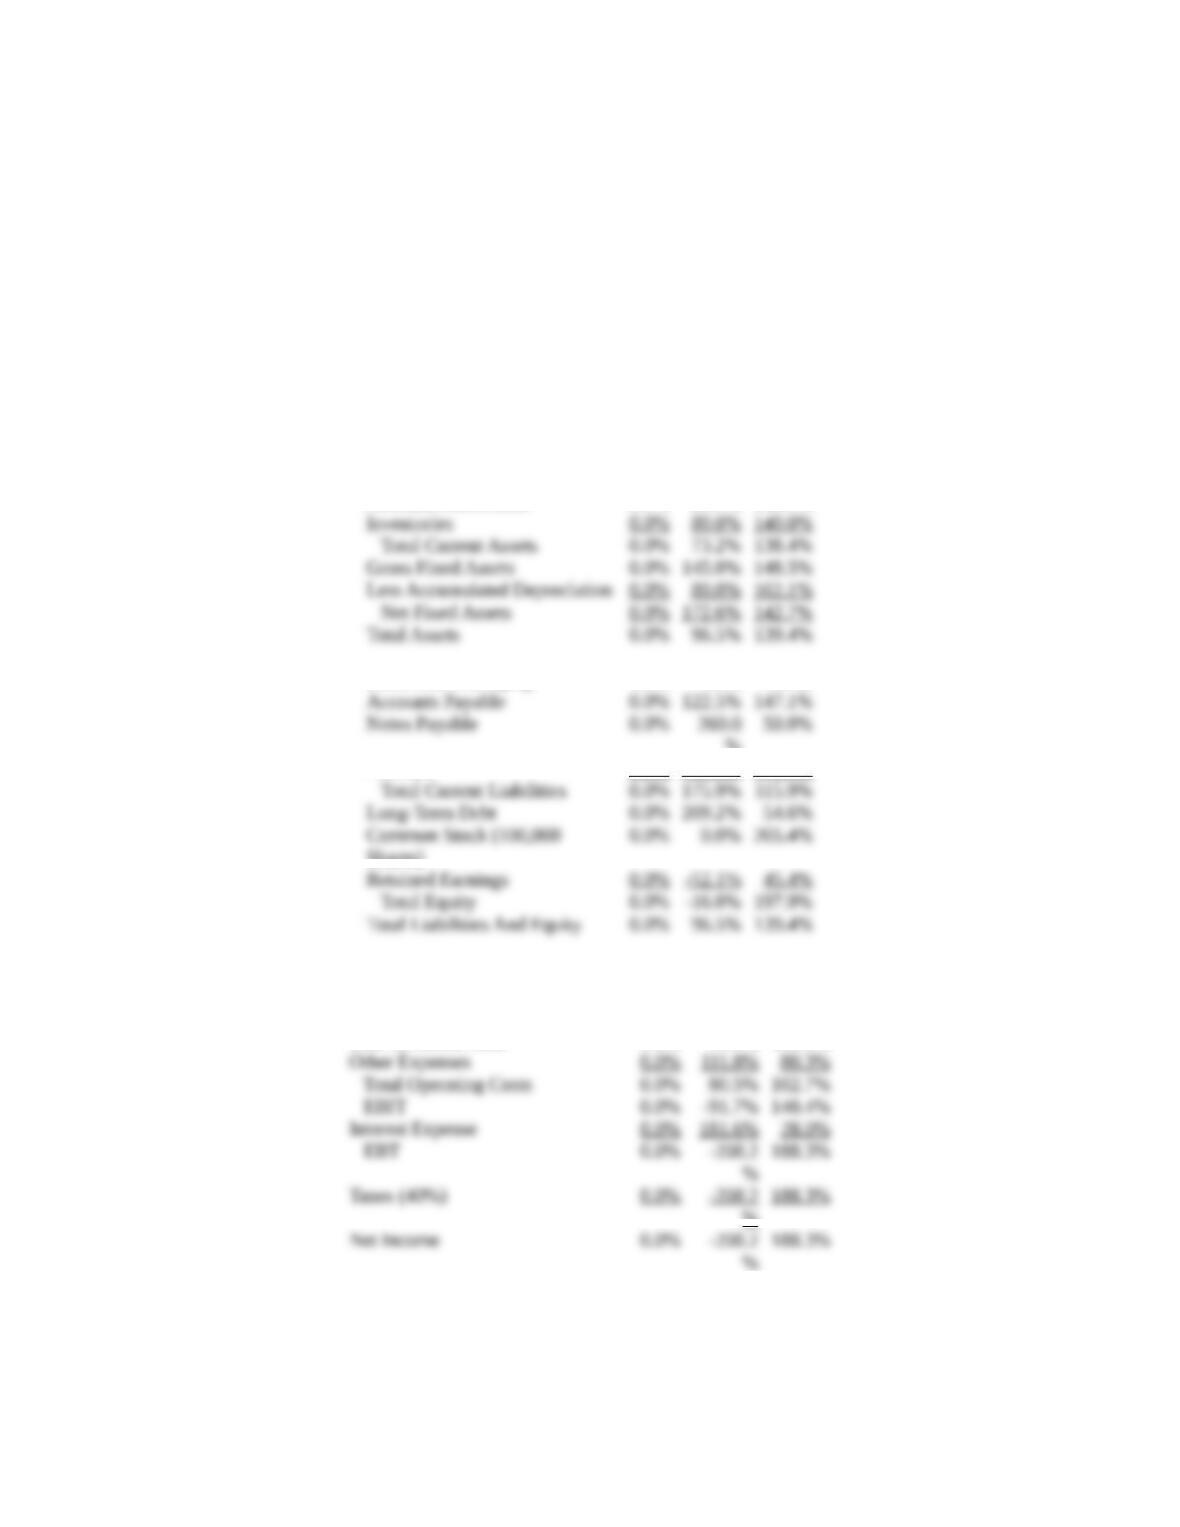
For the percent change analysis, divide all items in a row by the value in the first
year of the analysis.
Percent Change Balance Sheets
Assets
2015 2016 2017E
Cash 0.0% -19.1% 55.6%
Short Term Investments 0.0% -58.8% 47.4%
Accounts Receivable 0.0% 80.0% 150.0%
Liabilities And Equity 2014 2015 2016e
%
Accruals 0.0% 109.5% 179.4%
Percent Change Income Statement 2015 2016 2017E
Sales 0.0% 70.0% 105.0%
Depreciation 0.0% 518.8% 534.9%
Cost Of Goods Sold 0.0% 73.9% 102.5%
%
%
Mini Case: 3 – 3
© 2017 Cengage Learning. All Rights Reserved. May not be scanned, copied or duplicated, or posted to a publicly accessible
website, in whole or in part.
We see that 2017 sales are projected to grow 105% from 2015, and that NI is
h. Use the extended DuPont equation to provide a summary and overview of
Computron’s financial condition as projected for 2017. What are the firm’s
major strengths and weaknesses?
Answer: DuPont Equation =
Margin
Profit
Turnover
Assets Total
Multiplier
Equity
Strengths: The firm’s fixed assets turnover was above the industry average. However,
if the firm’s assets were older than other firms in its industry this could possibly
Weaknesses: The firm’s liquidity ratios are low; most of its asset management ratios
i. What are some potential problems and limitations of financial ratio analysis?
Answer: Some potential problems are listed below:
1. Comparison with industry averages is difficult if the firm operates many different
divisions.
Mini Case: 3 – 4
© 2017 Cengage Learning. All Rights Reserved. May not be scanned, copied or duplicated, or posted to a publicly accessible
website, in whole or in part.
j. What are some qualitative factors analysts should consider when evaluating a
company’s likely future financial performance?
Answer: Top analysts recognize that certain qualitative factors must be considered when
evaluating a company. These factors, as summarized by the American Association Of
Individual Investors (AAII), are as follows:
1. Are the company’s revenues tied to one key customer?
2. To what extent are the company’s revenues tied to one key product?
Mini Case: 3 – 5
© 2017 Cengage Learning. All Rights Reserved. May not be scanned, copied or duplicated, or posted to a publicly accessible
website, in whole or in part.