
SOLUTION TO SPREADSHEET PROBLEM
3-15 The detailed solution for the problem is available is in the file Ch03 P15 Build a Model
Solution.xlsx and is available at the textbook’s web site.
Answers and Solutions: 3 – 1
© 2017 Cengage Learning. All Rights Reserved. May not be scanned, copied or duplicated, or posted to a publicly accessible
website, in whole or in part.
MINI CASE
The first part of the case, presented in Chapter 2, discussed the situation of Computron
Industries after an expansion program. A large loss occurred in 2016, rather than the
expected profit. As a result, its managers, directors, and investors are concerned about the
firm’s survival.
Jenny Cochran was brought in as assistant to Computron’s chairman, who had the task of
getting the company back into a sound financial position. Cochran must prepare an
analysis of where the company is now, what it must do to regain its financial health, and
what actions to take. Your assignment is to help her answer the following questions, using
the recent and projected financial information shown next. Provide clear explanations, not
yes or no answers.
Answers and Solutions: 3 – 2
© 2017 Cengage Learning. All Rights Reserved. May not be scanned, copied or duplicated, or posted to a publicly accessible
website, in whole or in part.
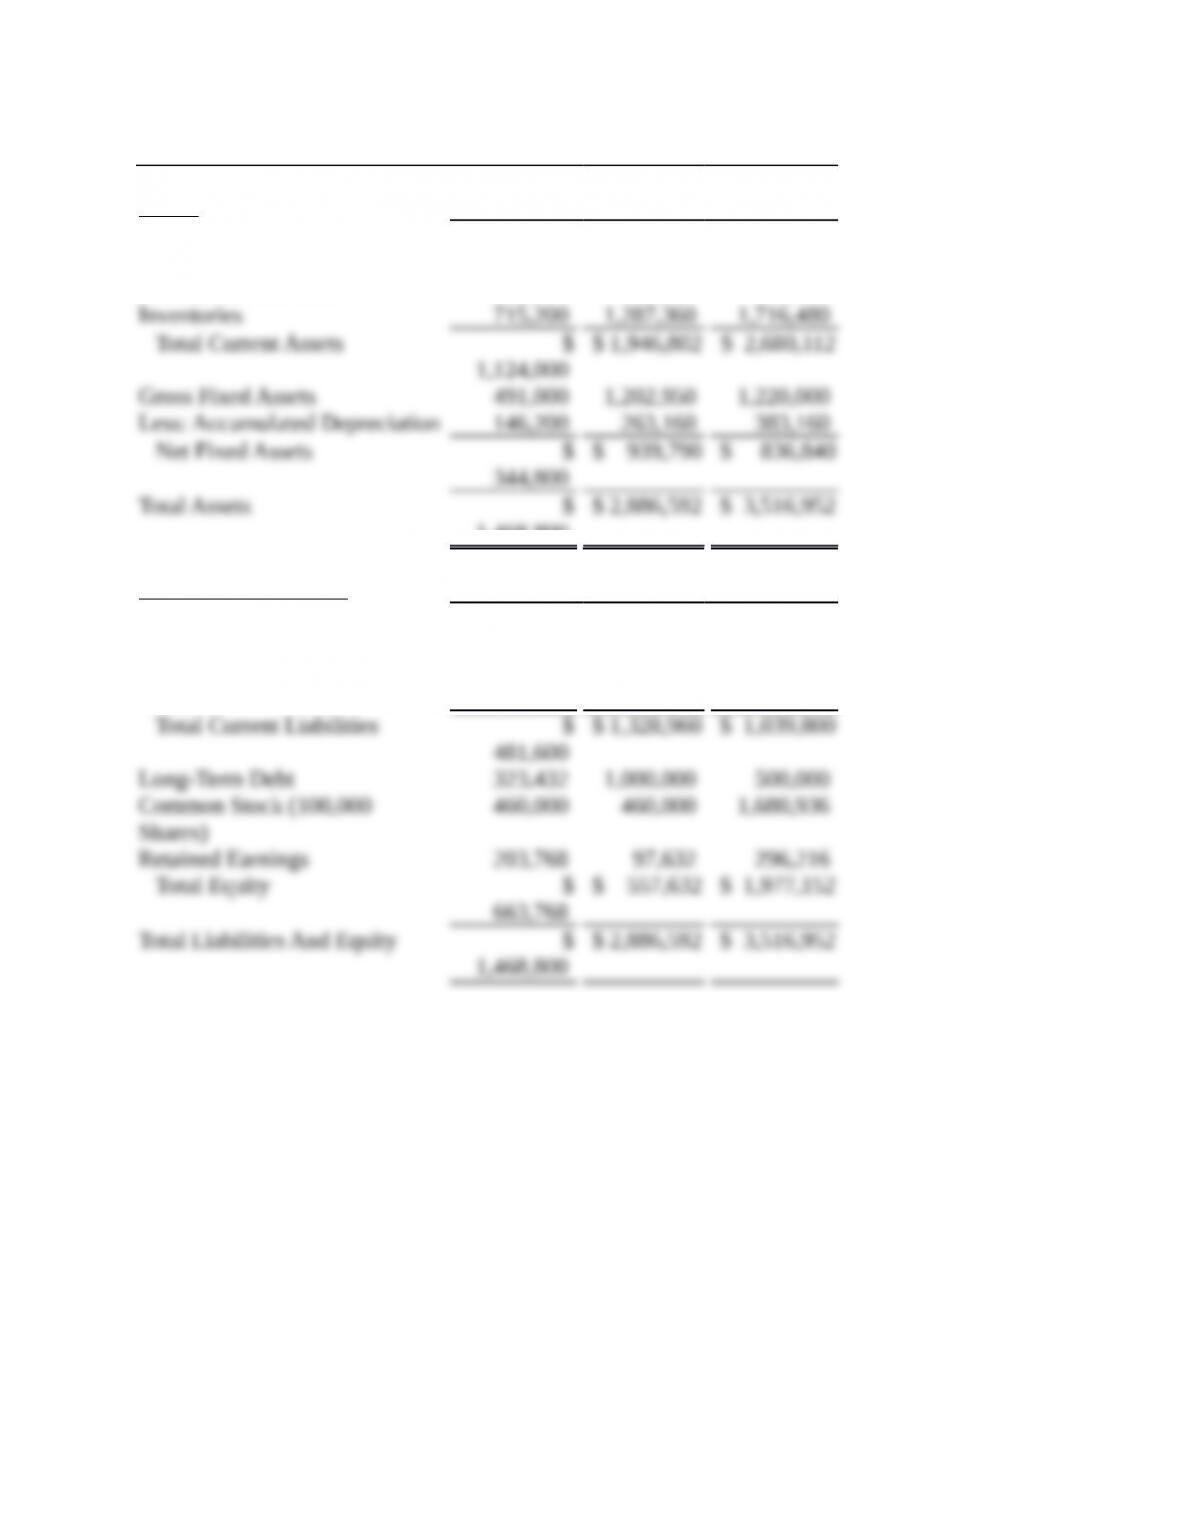
Balance Sheets
Assets 2015 2016 2017E
Cash $ 9,000 $ 7,282 $ 14,000
Short-Term Investments. 48,600 20,000 71,632
Accounts Receivable 351,200 632,160 878,000
1,468,800
Liabilities And Equity 2013 2014 2015e
Accounts Payable $
145,600
$ 324,000 $ 359,800
Notes Payable 200,000 720,000 300,000
Accruals 136,000 284,960 380,000
Answers and Solutions: 3 – 3
© 2017 Cengage Learning. All Rights Reserved. May not be scanned, copied or duplicated, or posted to a publicly accessible
website, in whole or in part.
Income Statements
2015 2016 2017E
Sales $ 3,432,000 $ 5,834,400 $ 7,035,600
COGS except depr. 2,864,000 4,980,000 5,800,000
Depreciation 18,900 116,960 120,000
Other Data 2015 2016 2017E
Stock Price $ 8.50 $ 6.00 $ 12.17
Shares Outstanding 100,000 100,000 250,000
Ratio Analysis 2015 2016 2017E Industry Average
Current 2.3 1.5 2.58 2.7
Quick 0.8 0.5 0.93 1.0
3
0
Debt Ratio 35.6% 59.6% 22.7% 32.0%
Liabilities/Assets Ratio 54.8% 80.7% 43.8% 50.0%
TIE 3.3 0.1 6.3 6.2
Answers and Solutions: 3 – 4
© 2017 Cengage Learning. All Rights Reserved. May not be scanned, copied or duplicated, or posted to a publicly accessible
website, in whole or in part.
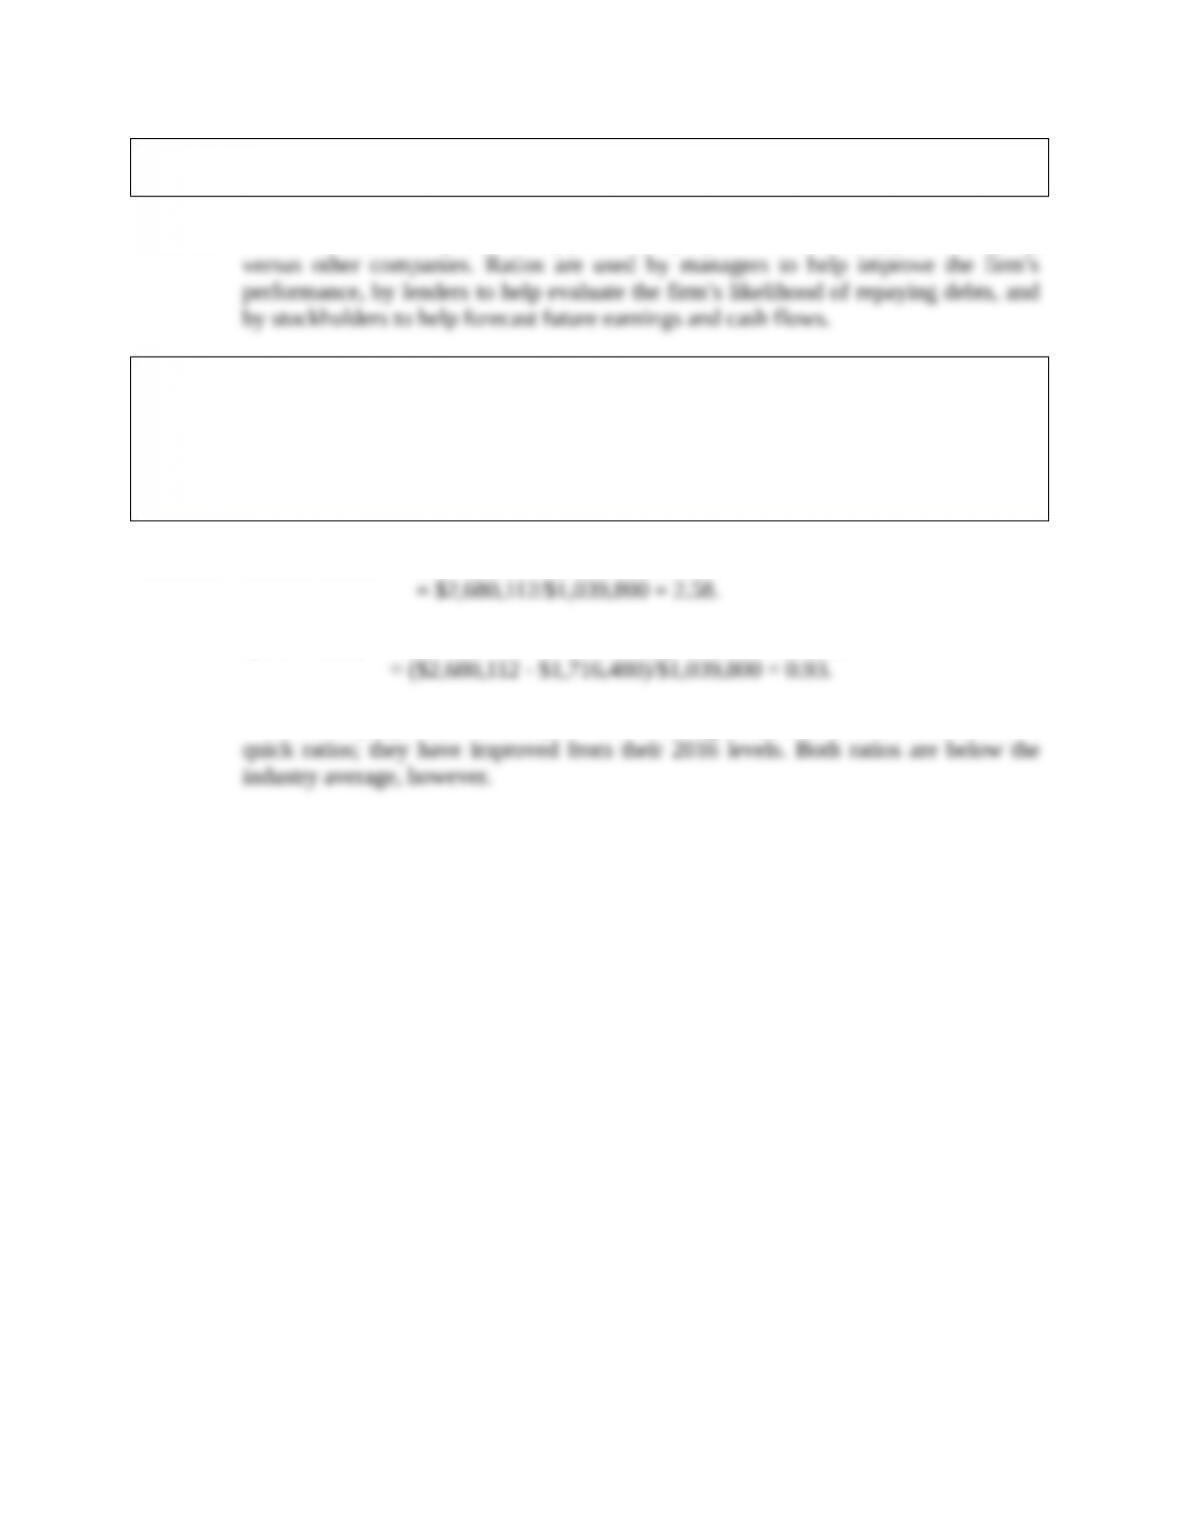
a. Why are ratios useful? What three groups use ratio analysis and for what
reasons?
Answer: Ratios facilitate comparison of (1) one company over time and (2) one company
b. Calculate the 2017 current and quick ratios based on the projected balance sheet
and income statement data. What can you say about the company’s liquidity
position in 2015, 2016, and as projected for 2017? We often think of ratios as
being useful (1) to managers to help run the business, (2) to bankers for credit
analysis, and (3) to stockholders for stock valuation. Would these different types
of analysts have an equal interest in the liquidity ratios?
Answer: Current Ratio17 = Current Assets/Current Liabilities
Quick Ratio17 = (Current Assets – Inventory)/Current Liabilities
The company’s current and quick ratios are higher relative to its 2015 current and
Answers and Solutions: 3 – 5
© 2017 Cengage Learning. All Rights Reserved. May not be scanned, copied or duplicated, or posted to a publicly accessible
website, in whole or in part.
c. Calculate the 2017 inventory turnover, days sales outstanding (DSO), fixed assets
turnover, and total assets turnover. How does Computron’s utilization of assets
stack up against other firms in its industry?
Answer: Inventory Turnover16 = COGS/Inventory
DSO17= Receivables/(Sales/365)
Fixed Assets Turnover17 = Sales/Net Fixed Assets
Total Assets Turnover17 = Sales/Total Assets
The firm’s inventory turnover ratio has declined, while its days sales outstanding
The firm’s inventory turnover and total assets turnover are below the industry
average. The firm’s days sales outstanding is above the industry average (which is
Answers and Solutions: 3 – 6
© 2017 Cengage Learning. All Rights Reserved. May not be scanned, copied or duplicated, or posted to a publicly accessible
website, in whole or in part.
d. Calculate the 2017 debt ratio, liabilities-to-assets ratio, times-interest-earned,
and EBITDA coverage ratios. How does Computron compare with the industry
with respect to financial leverage? What can you conclude from these ratios?
Answer: Debt Ratio17 = Total Debt/Total Assets
Liabilities-to-Assets Ratio16 = Total Liabilities/Total Assets
EBITDA Coverage17 =
Payments
Lease
EBITDA
/
Payments
Lease
Repayments
Loan
Interest
The firm’s debt ratio is much improved from 2016, and is still lower than its 2015
e. Calculate the 2017 profit margin, basic earning power (BEP), return on assets
(ROA), and return on equity (ROE). What can you say about these ratios?
Basic Earning Power17 = EBIT/Total Assets = $502,640/$3,516,952
The firm’s profit margin is above 2015 and 2016 levels and is at the industry
Answers and Solutions: 3 – 7
© 2017 Cengage Learning. All Rights Reserved. May not be scanned, copied or duplicated, or posted to a publicly accessible
website, in whole or in part.