Chapter 3
Analysis of Financial Statements
ANSWERS TO END-OF-CHAPTER QUESTIONS
3-1 a. A liquidity ratio is a ratio that shows the relationship of a firm’s cash and other
current assets to its current liabilities. The current ratio is found by dividing current
b. Asset management ratios are a set of ratios that measure how effectively a firm is
managing its assets. The inventory turnover ratio is COGS divided by inventories.
Days sales outstanding is used to appraise accounts receivable and indicates the
c. Financial leverage ratios measure the use of debt financing. The debt ratio is the ratio
of total debt, which usually is the sum of notes payable and long-term bonds, to total
assets, it measures the percentage of assets financed by debtholders. The
debt-to-equity ratio is the total debt divided by the total common equity. The
d. Profitability ratios are a group of ratios, which show the combined effects of liquidity,
asset management, and debt on operations. The profit margin on sales, calculated by
dividing net income by sales, gives the profit per dollar of sales. Basic earning power
e. Market value ratios relate the firm’s stock price to its earnings and book value per
share. The price/earnings ratio is calculated by dividing price per share by earnings
per share–this shows how much investors are willing to pay per dollar of reported
f. Trend analysis is an analysis of a firm’s financial ratios over time. It is used to
g. The DuPont equation is a formula, which shows that the rate of return on assets can
be found as the product of the profit margin times the total assets turnover. Window
3-2 The emphasis of the various types of analysts is by no means uniform nor should it be.
Management is interested in all types of ratios for two reasons. First, the ratios point out
weaknesses that should be strengthened; second, management recognizes that the other
3-3 Given that sales have not changed, a decrease in the total assets turnover means that the
company’s assets have increased. Also, the fact that the fixed assets turnover ratio
3-4 Differences in the amounts of assets necessary to generate a dollar of sales cause asset
turnover ratios to vary among industries. For example, a steel company needs a greater
3-5 a. Cash, receivables, and inventories, as well as current liabilities, vary over the year for
b. Common equity is determined at a point in time, say December 31, 2014. Profits are
earned over time, say during 2014. If a firm is growing rapidly, year-end equity will
3-6 Firms within the same industry may employ different accounting techniques, which make
it difficult to compare financial ratios. More fundamentally, comparisons may be
SOLUTIONS TO END-OF-CHAPTER PROBLEMS
.
000,400AR = $
000,20$
AR
= 20
365
S
AR
DSO =
3-2 TA = $200 million, notes payable =$5 million, and LT debt = $25 million.
Debt ratio = Debt-to-assets ratio =
assetsTotal
debtTotal
=
$200
$25$5
= 15%.
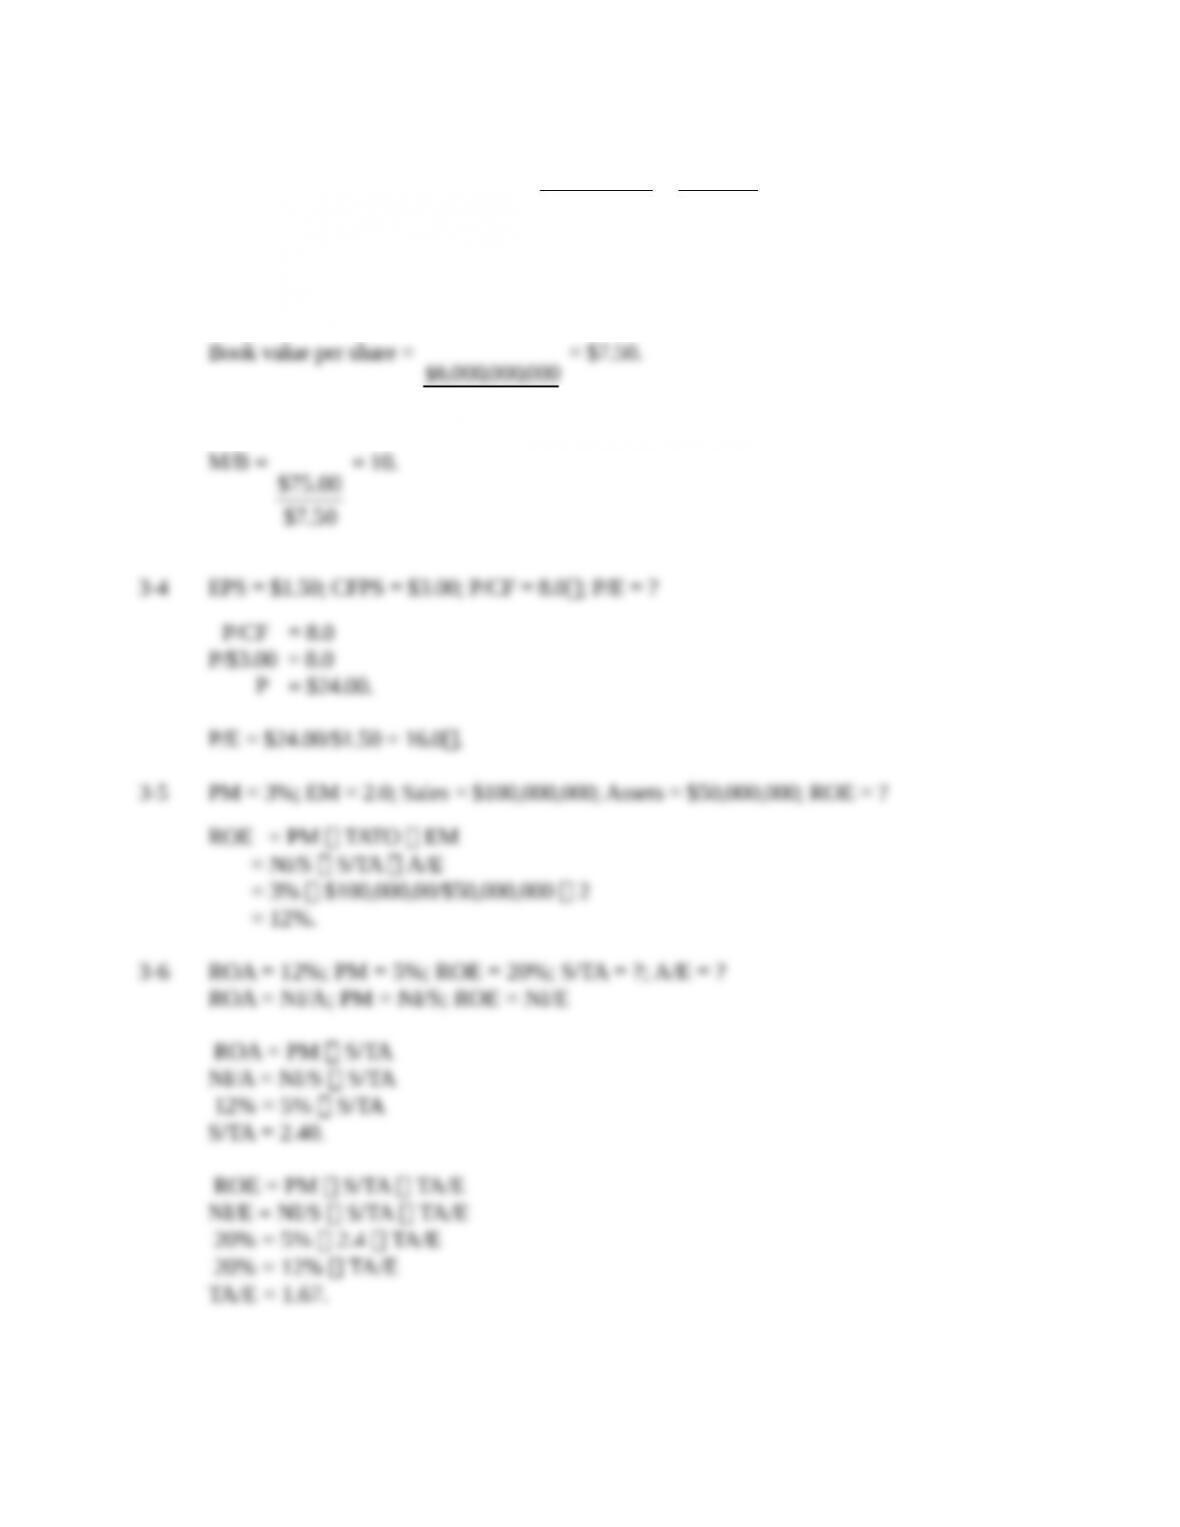
3-3 TA = $10,000,000,000; CL = $1,000,000,000; LT debt = $3,000,000,000; CE =
$6,000,000,000; Shares outstanding = 800,000,000; P0 = $75; M/B = ?
Book value per share =
000,000,800
000,000,000,6$
= $7.50.
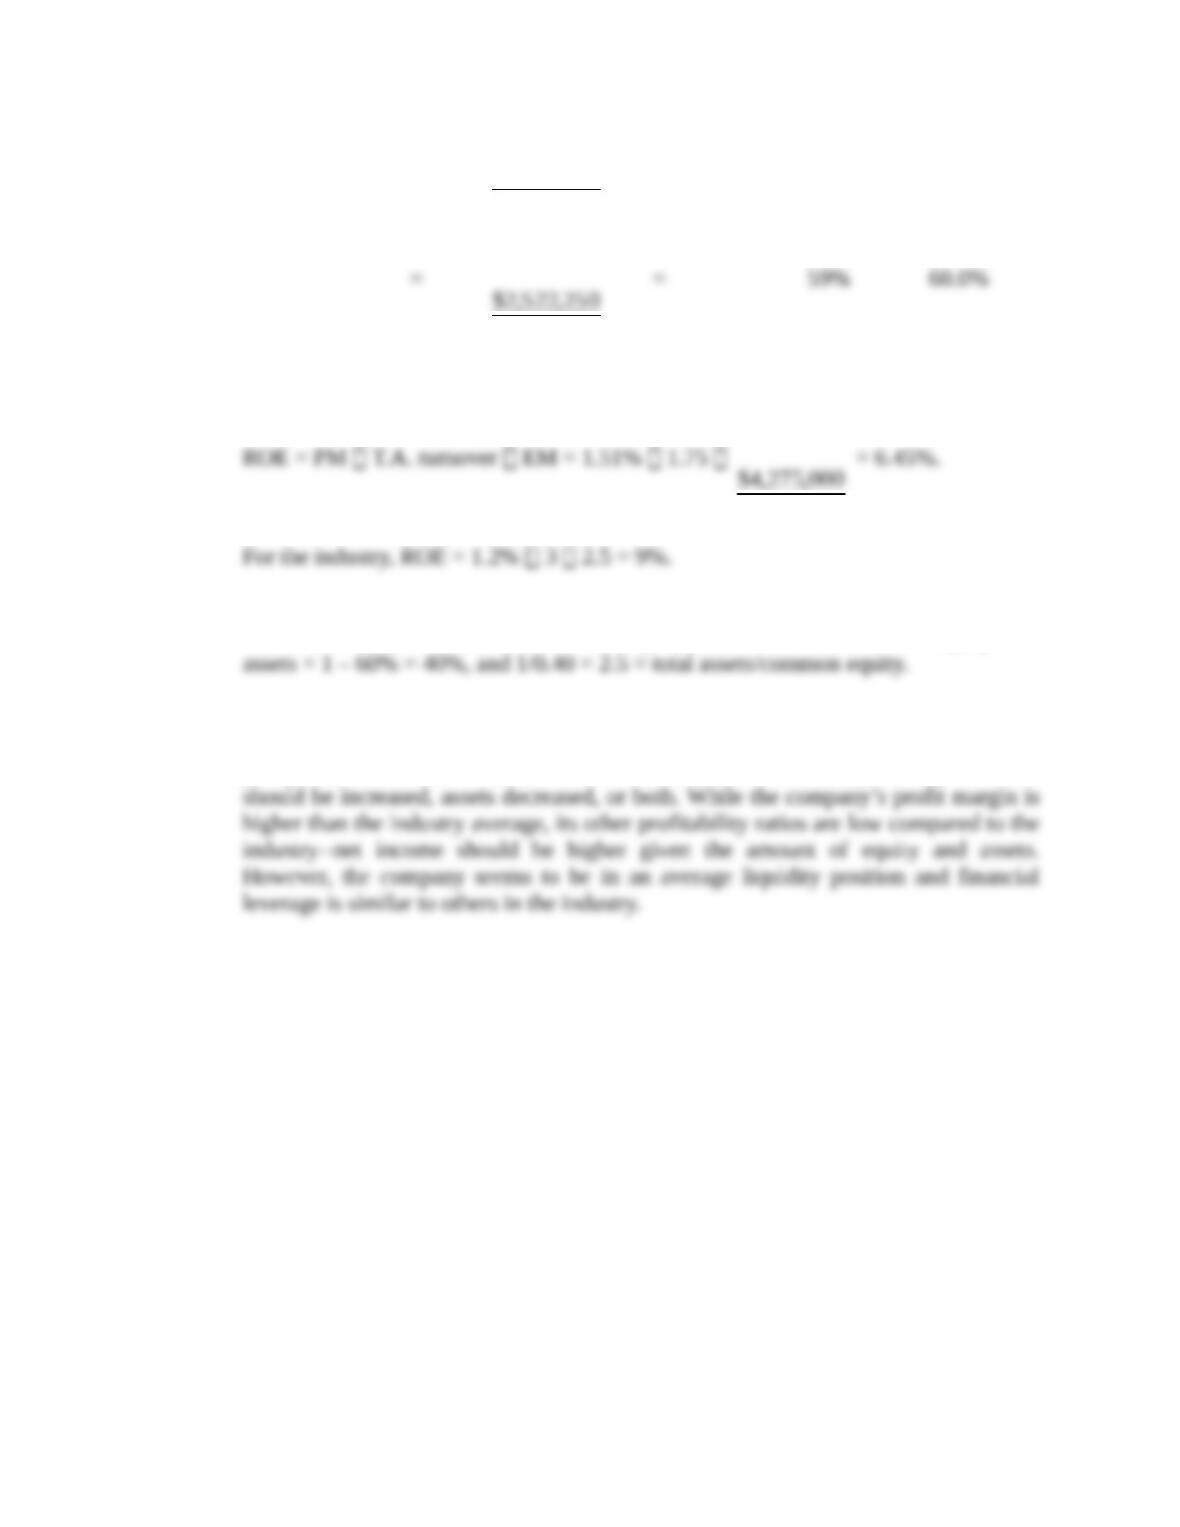
3-5 PM = 3%; EM = 2.0; Sales = $100,000,000; Assets = $50,000,000; ROE = ?
3-6 ROA = 12%; PM = 5%; ROE = 20%; S/TA = ?; A/E = ?
ROA = NI/A; PM = NI/S; ROE = NI/E
ROE = PM S/TA TA/E
NI/E = NI/S S/TA TA/E
CL
CA
CL
I – CA
CL = ?; I = ?
.$2,000,000 = CL
$3,000,000 = CL1.5
1.5 =
CL
$3,000,000
1.5 =
CL
CA
1.0 =
CL
nvI -CA
1.0 =
$2,000,000
nvI – $3,000,000
$2,000,000 = nvI – $3,000,000
.$1,000,000 = nvI
3-8 We are given ROA = 4%, ROE = 7%, and TAT = Sales/Total assets = 1.2.
From DuPont equation: ROA = Profit margin Total assets turnover
We can also calculate the company’s liabilities-to-assets (L/TA) ratio in a similar manner,
ROA/ROE
ROE
1
ROA
NI
E
TA
NI
=
TA
E
3-9 Present current ratio =
$525,000
$1,312,500
= 2.5.
Minimum current ratio =
NP + $525,000
NP + $1,312,500
= 2.0.
Short-term debt can increase by a maximum of $262,500 without violating a 2 to 1
3-10 TIE = EBIT/INT, so find EBIT and INT.
The loan will not be renewed and they will go bankrupt!
3-11 1. Sales = (1.5)(Total assets) = (1.5)($400,000) = $600,000.
4. Inventory = COGS/3.75 = $450,000/3.75 = $120,000.
3-12 1. = 3.0
sliabilitieCurrent
$810,000
= 3.0
2. = 1.4
$270,000
sInventorie – $810,000
= 1.4
3.
sInventorie +
receivable
Accounts
+
Securities
Marketable
+ Cash =
assets
Current
Sales = ($258,000 365)/36.5 = $2,580,000.
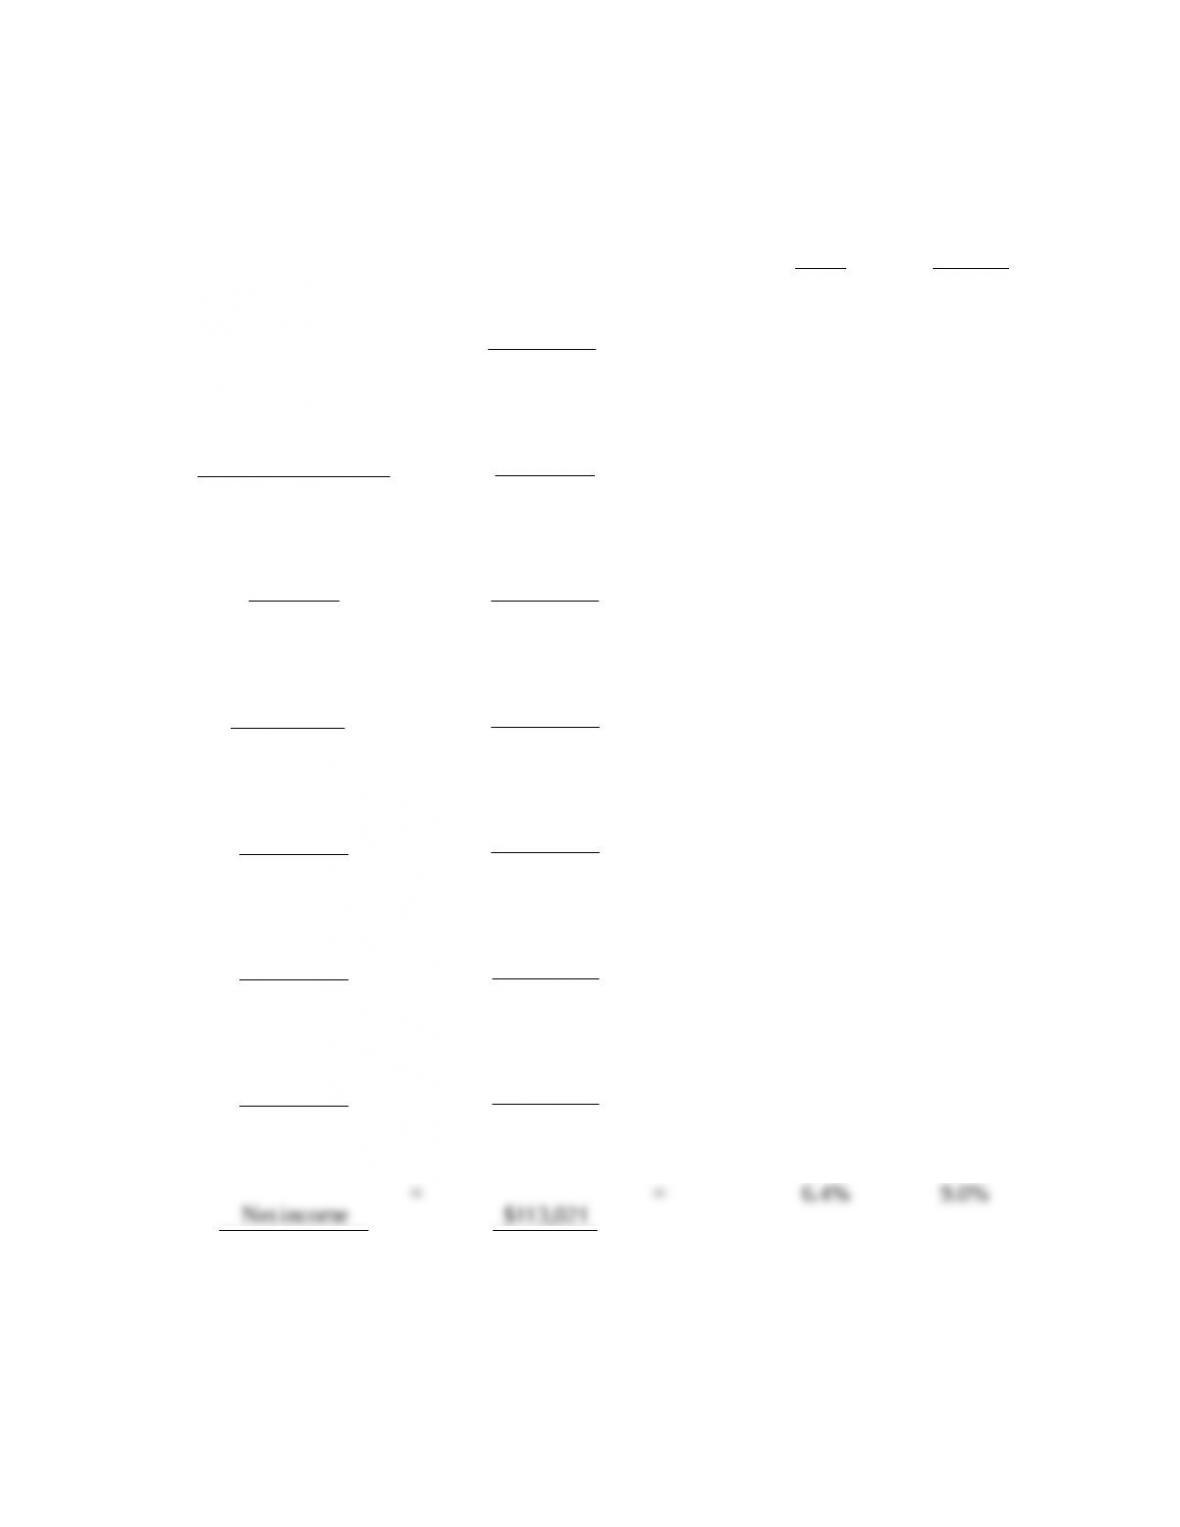
3-13 a. (Dollar amounts in thousands.)
Industry
Firm Average
=
005,453,1$
,000925,2$
= 2.012.0
536Sales/
receivable Accounts
=
548,20$
000,575,1$
= 77 days 35 days
Inventory
COGS
=
000,125,1$
000,375,6$
= 5.67 6.7
assets Fixed
Sales
=
000,350,1$
000,500,7$
= 5.5612.1
assets Total
Sales
=
000,275,4$
000,500,7$
= 1.753.0
Sales
incomeNet
=
000,500,7$
021,113$
= 1.5% 1.2%
assets Total
incomeNet
=
000,275,4$
021,113$
= 2.6% 3.6%
equity Common
incomeNet
750,752,1$
021,113$
=
000,275,4$
384,395,1$
= 33% 30%
000,275,4$
250,522,2$
b. For the firm,
Note: To find the industry ratio of assets to common equity, recognize that 1 minus
the Liabilities-to-assets ratio = common equity/total assets. So, common equity/total
c. The firm’s days sales outstanding is more than twice as long as the industry average,
indicating that the firm should tighten credit or enforce a more stringent collection
policy. The total assets turnover ratio is well below the industry average so sales
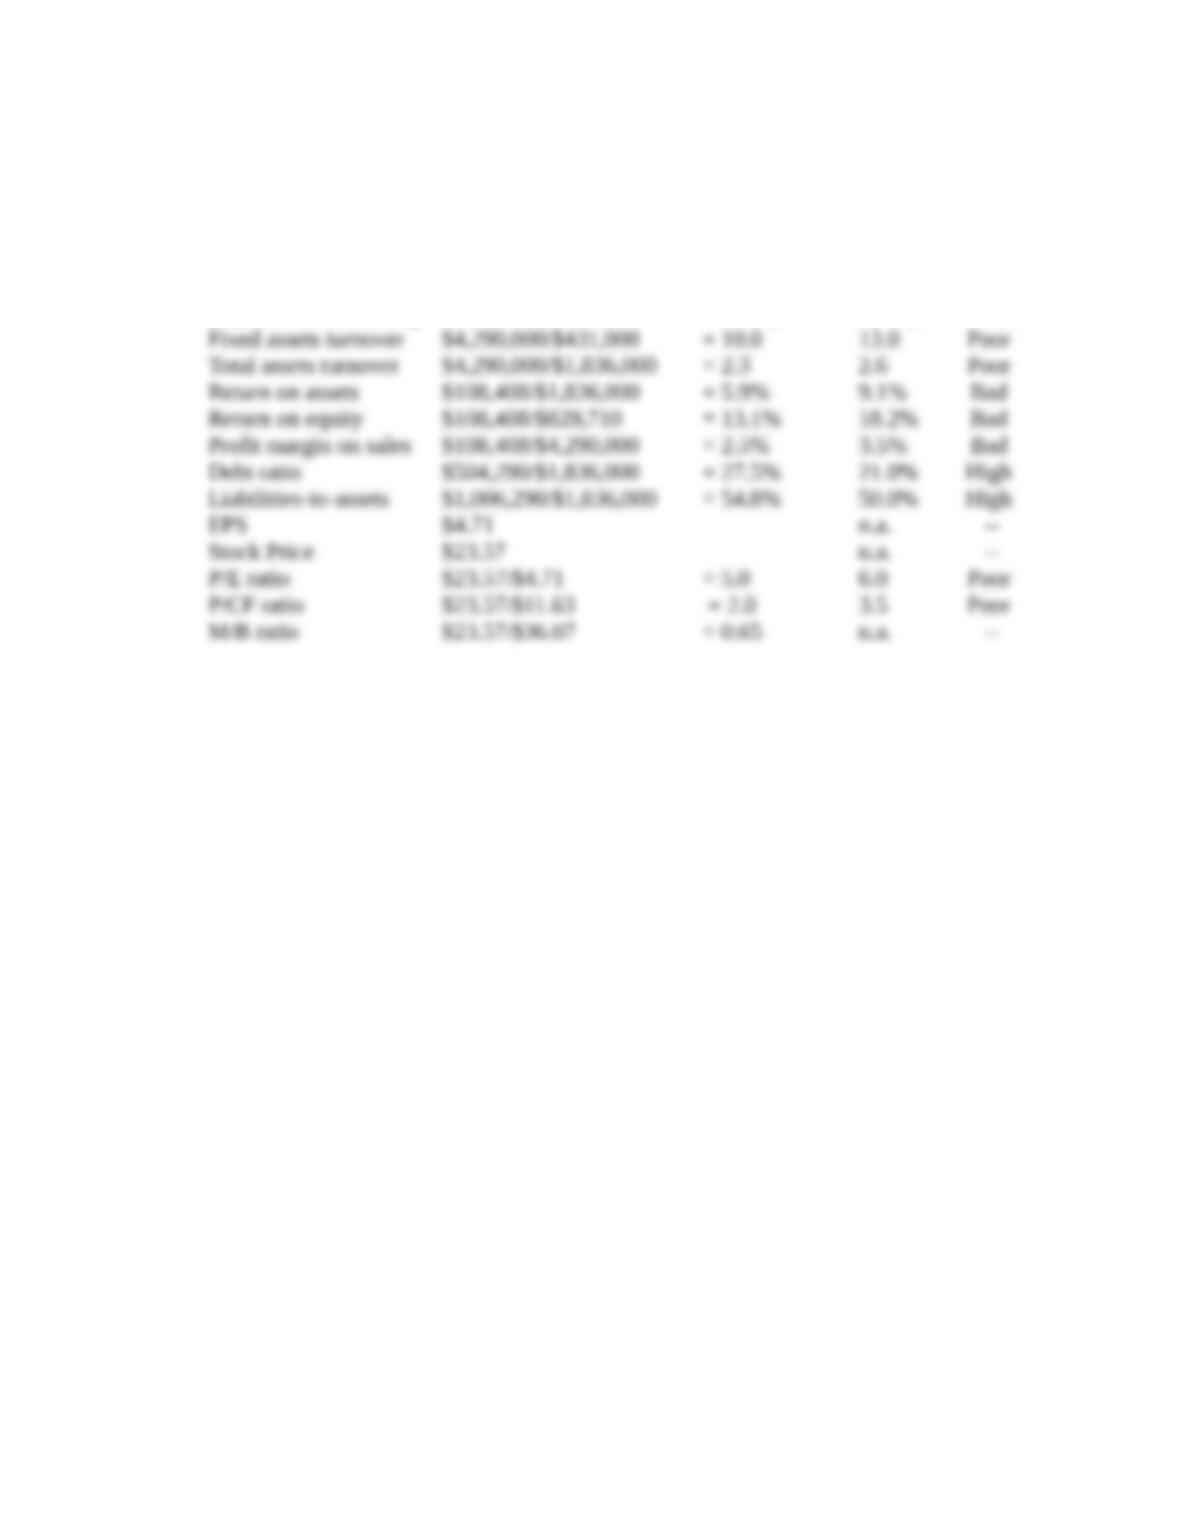
3-14 Here are the firm’s base case ratios and other data as compared to the industry:
Firm Industry Comment
Quick $511,000/$602,000 = 0.8 1.0 Weak
Current $1,405,000/$602,000 = 2.3 2.7 Weak
Inventory turnover $3,580,000/$894,000 = 4.0 7.0 Poor
Days sales outstanding $439,000/$11,753 = 37 days 32 days Poor
The firm appears to be badly managed–all of its ratios are worse than the industry
averages, and the result is low earnings, a low P/E, P/CF ratio, a low stock price, and a
low M/B ratio. The company needs to do something to improve.