b. 5. If bank loans have a cost of 12 percent, what is the annual dollar cost of carrying
the receivables?
c. What are some factors that influence (1) a firm’s receivables level
and (2) the dollar cost of carrying receivables?
Answer: 1. As shown in question B.3. Above, receivables are a function of the average daily
sales and the days sales outstanding. Exogenous economic factors such as the
2. For a given level of receivables, the lower the profit margin, the higher the cost of
Mini Case: 27 – 1
© 2017 Cengage Learning. All Rights Reserved. May not be scanned, copied or duplicated, or posted to a publicly accessible
website, in whole or in part.
d. Assuming that the monthly sales forecasts given previously are accurate, and
that customers pay exactly as was predicted, what would the receivables level be
at the end of each month? To reduce calculations, assume that 30 percent of the
firm’s customers pay in the month of sale, 50 percent pay in the month following
the sale, and the remaining 20 percent pay in the second month following the sale.
Note that this is a different assumption than was made earlier. Use the following
format to answer parts c and d:
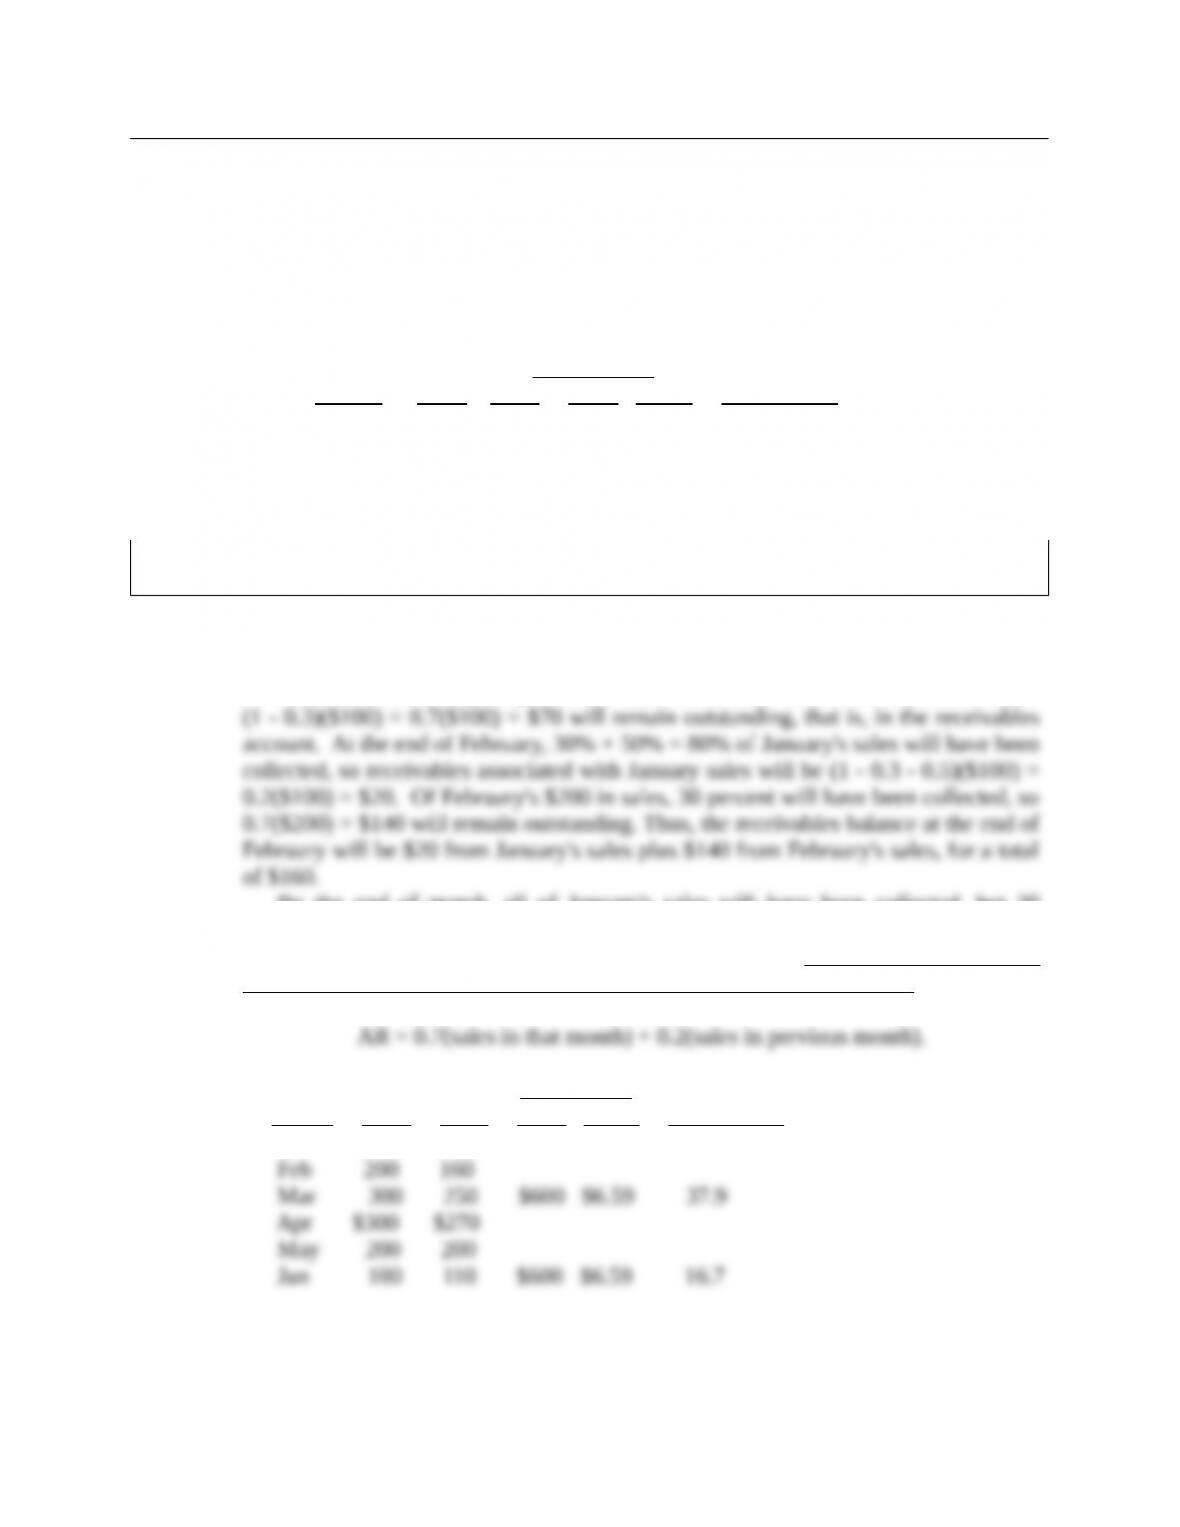
E.O.M. Quarterly DSO =
Month Sales AR Sales ADS (AR)/(ADS)
Jan $100 $ 70
Feb 200 160
Mar 300 250 $600 $6.59 37.9
Apr 300
May 200
Jun 100
Answer: (Note: from this point on, the solutions are expressed in thousands of dollars. Also,
the table given below is developed in the solutions to parts D and E.)
At the end of January, 30 percent of the $100 in sales will have been collected, so
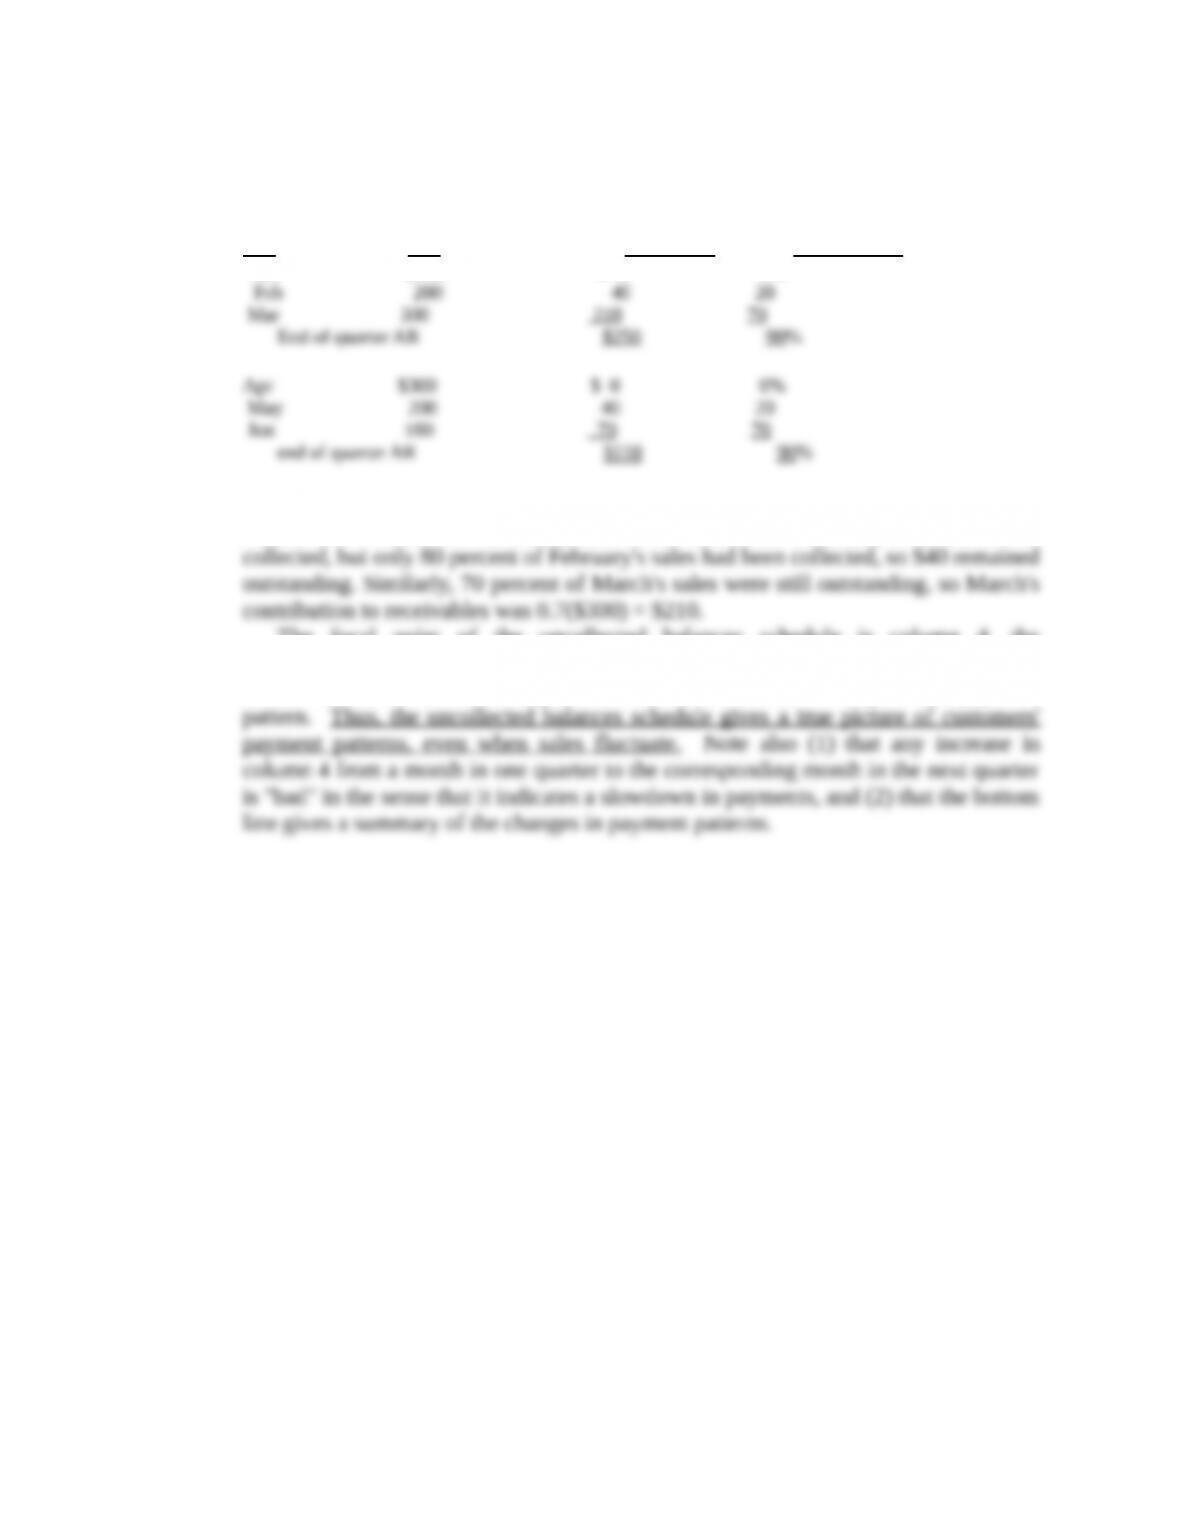
By the end of march, all of January’s sales will have been collected, but 20
percent of February’s sales and 70 percent of March’s sales will still be outstanding,
so receivables will equal 0.2($200) + 0.7($300) = $250. Following this logic, the
receivables balance at the end of any month can be estimated as follows:
E.O.M. Quarterly DSO =
Month Sales AR Sales ADS (AR)/(ADS)
Jan $100 $ 70
Mini Case: 27 – 2
© 2017 Cengage Learning. All Rights Reserved. May not be scanned, copied or duplicated, or posted to a publicly accessible
website, in whole or in part.
e. What is the firm’s forecasted average daily sales for the first 3 months? For the
entire half-year? The days sales outstanding is commonly used to measure
receivables performance. What DSO is expected at the end of March? At the
end of June? What does the DSO indicate about customers’ payments? Is DSO
a good management tool in this situation? If not, why not?
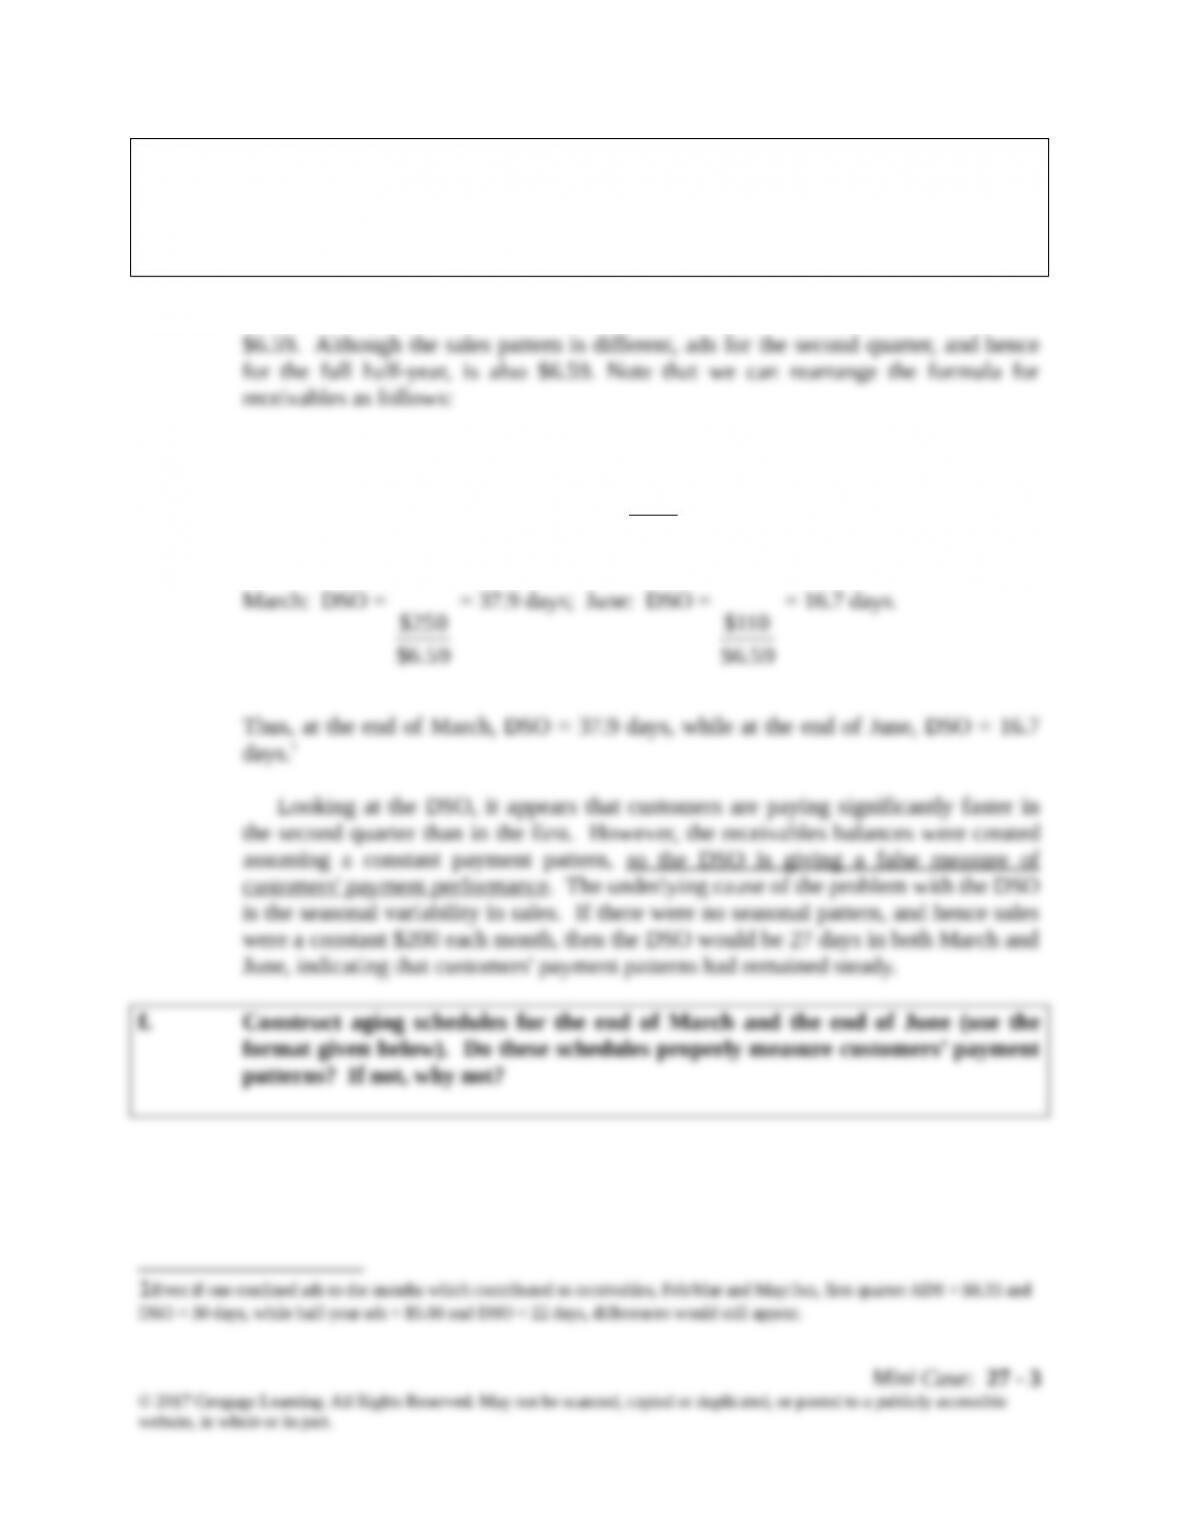
Answer: For the first quarter, sales totaled $100 + $200 + $300 = $600, so ads = $600/91 =
AR = (DSO)(ADS)
DSO =
ADS
A/R
.
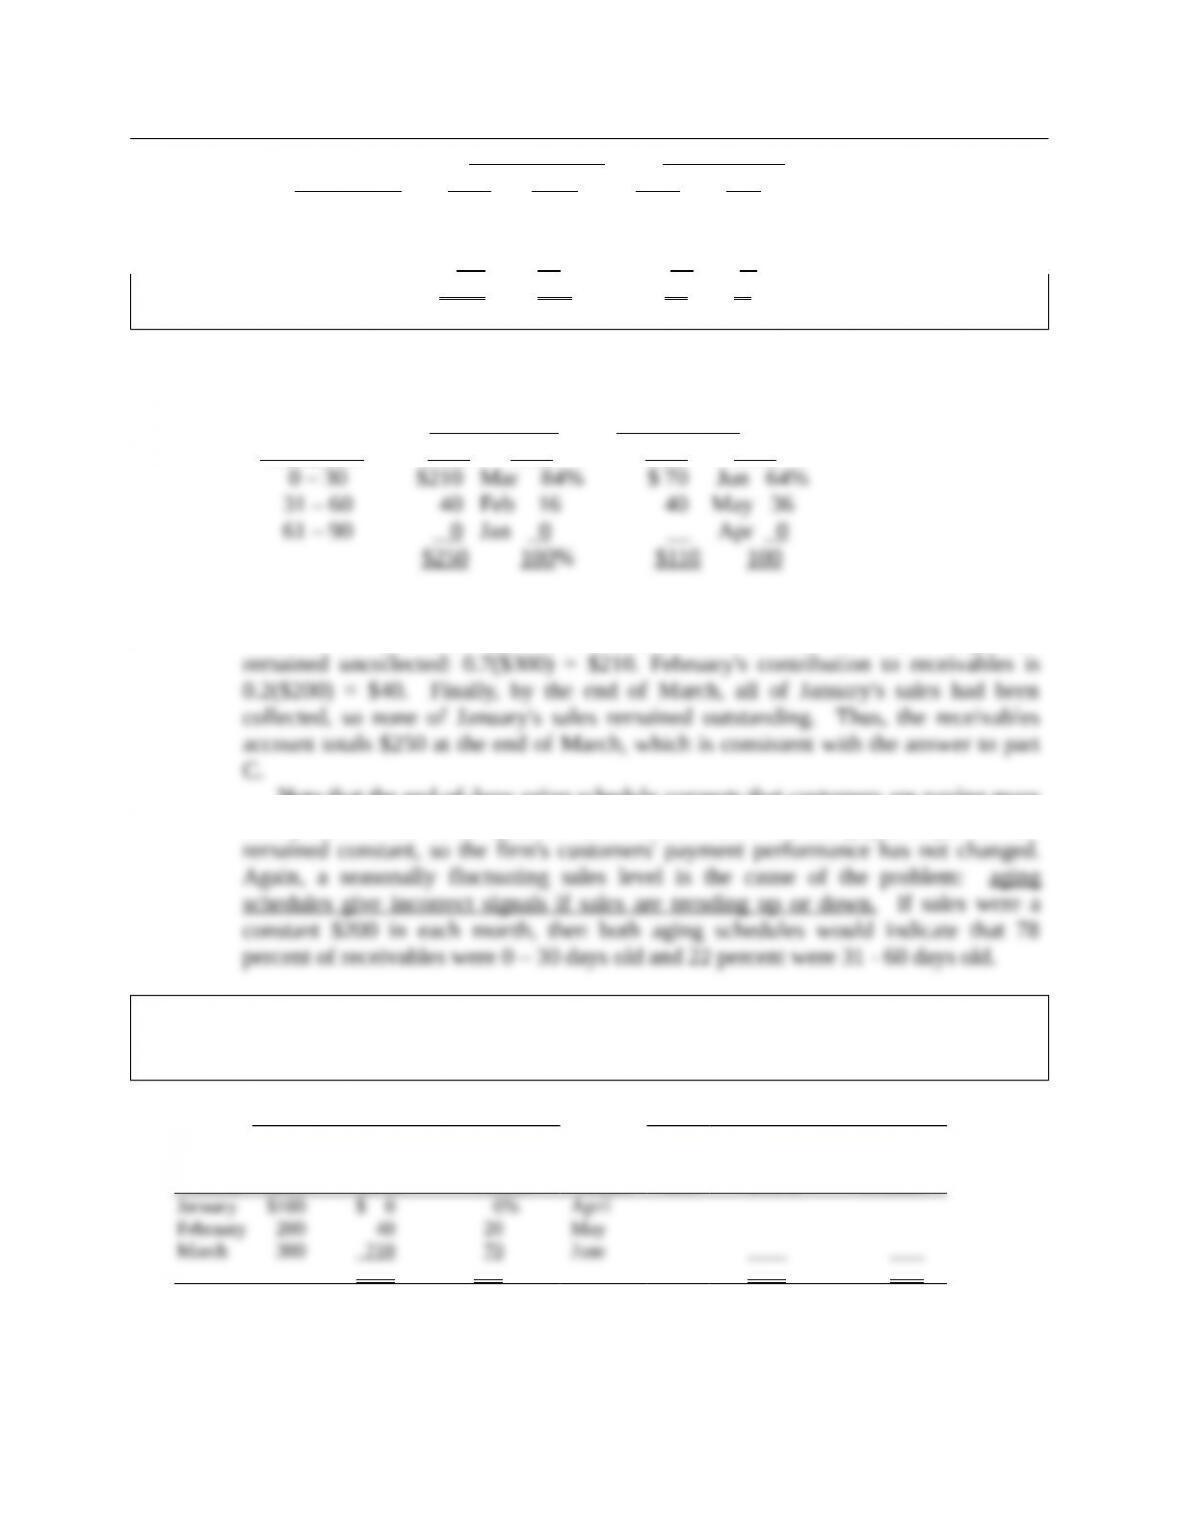
Age of account March June
(days) AR % AR %
0 – 30 $210 84%
31 – 60 40 16
61 – 90 0 0
$250 100%
Answer: Aging schedule:
Age of account March June
(days) AR % AR %
To see how these aging schedules were constructed, consider first the end-of-March
schedule. At that time, 30 percent of March’s sales had been collected, so 70 percent
Note that the end-of-June aging schedule suggests that customers are paying more
slowly than in the earlier quarter. However, we know that the payment pattern has
g. Construct the uncollected balances schedules for the end of March and the end
of June. Use the format given below. Do these schedules properly measure
customers’ payment patterns?
March June
Month Sales
Contribution
to AR
AR-to-Sale
s Ratio Month Sales
Contribution
to A/R
AR-to-Sal
es Ratio
Mini Case: 27 – 4
© 2017 Cengage Learning. All Rights Reserved. May not be scanned, copied or duplicated, or posted to a publicly accessible
website, in whole or in part.
Answer: Uncollected balances schedules:
Contribution to Ratio of month’s
Month Sales end-of-period AR AR to month’s sales
(1) (2) (3) (4)
Jan $100 $ 0 0%
In column 3 above, the contribution of each month’s sales to the firm’s receivables
balance is identified. To illustrate, at the end of March, all of January’s sales had been
The focal point of the uncollected balances schedule is column 4, the
receivables-to-sales ratio. When we compare March and June, we see no difference,
which is what we should see, given that there has been no change in the payment
Mini Case: 27 – 5
© 2017 Cengage Learning. All Rights Reserved. May not be scanned, copied or duplicated, or posted to a publicly accessible
website, in whole or in part.
h. Assume that it is now July of year 1, and the brothers are developing pro forma
financial statements for the following year. Further, assume that sales and
collections in the first half-year matched the predicted levels. Using the year 2
sales forecasts as shown next, what are next year’s pro forma receivables levels
for the end of March and for the end of June?
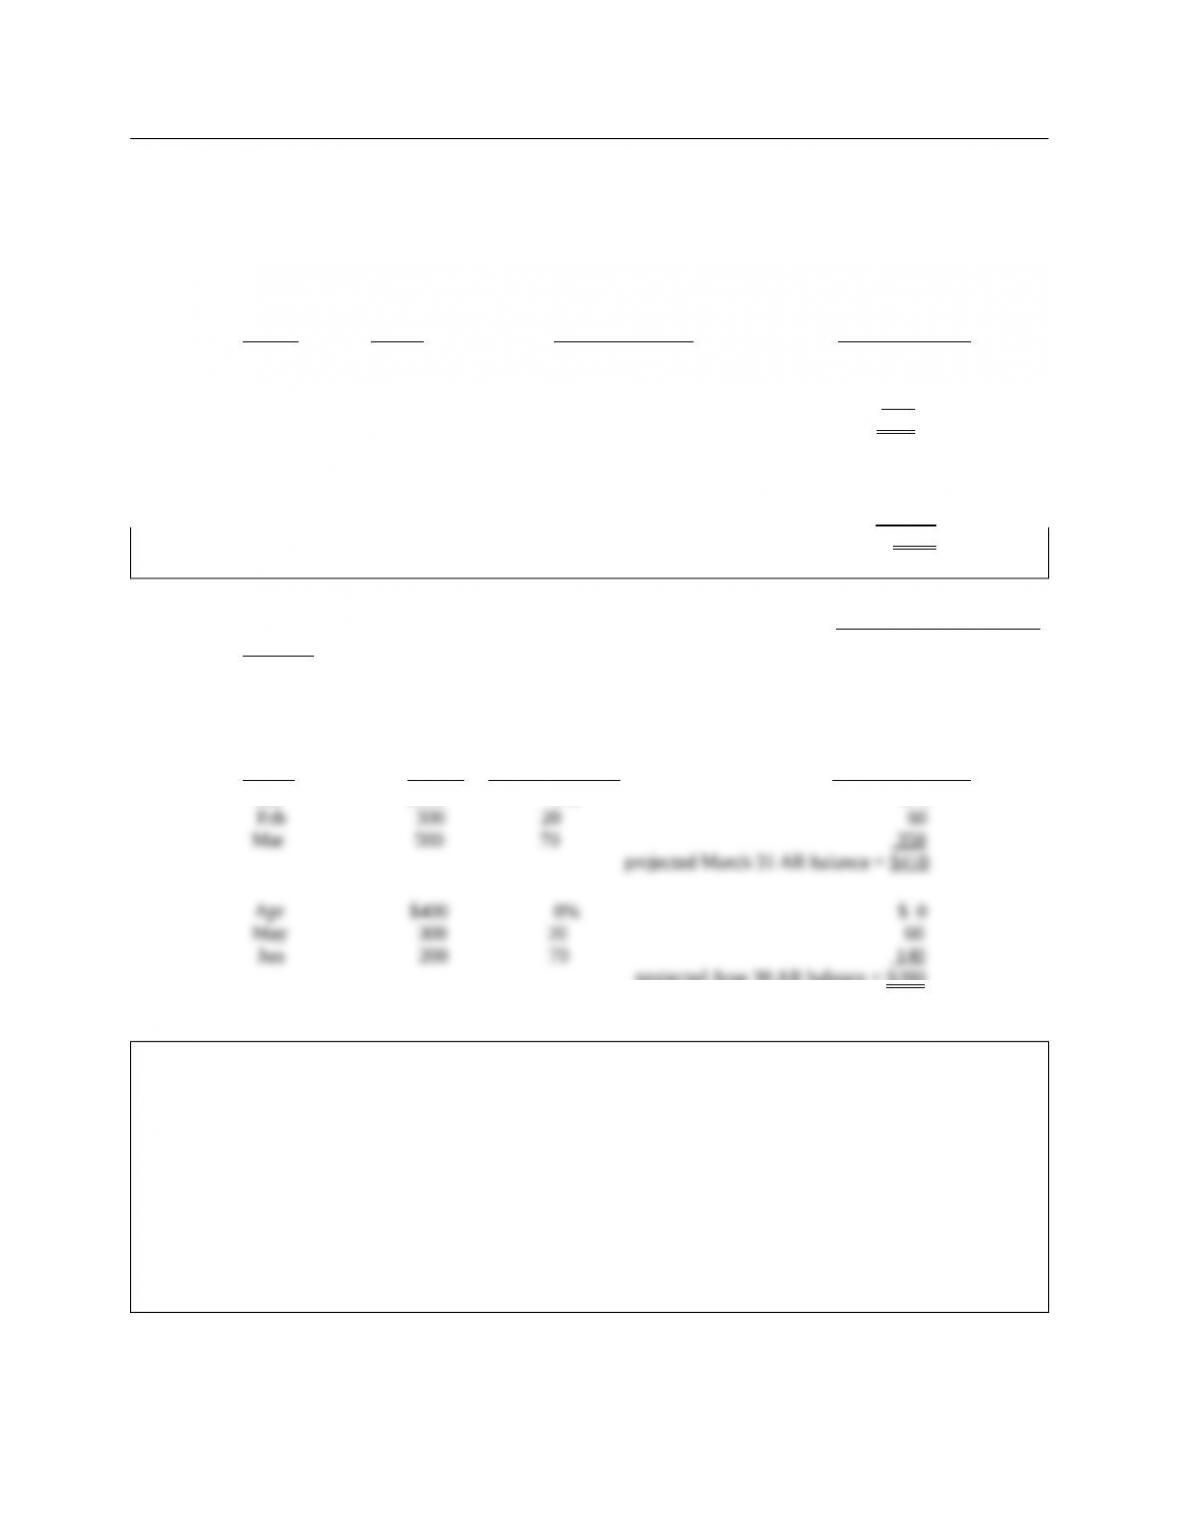
Predicted Predicted Predicted contribution
Month sales AR-to-sales ratio to receivables
Jan $150 0% $ 0
Feb 300 20 60
Mar 500 70 350
projected March 31 AR balance = $410
Apr $400
May 300
Jun 200
Projected June 30 AR balance =
Answer: The uncollected balances schedule can be used to forecast the pro forma receivables
balance. For forecasting, the historical receivables-to-sales ratios are generally
assumed to be good predictors of future payment patterns, and hence are applied to
the sales forecasts to develop the expected receivables:
Predicted Predicted Predicted contribution
Month sales AR-to-sales ratio to receivables
Jan $150 0% $ 0
projected June 30 AR balance = $200
i. Assume now that it is several years later. The brothers are concerned about the
firm’s current credit terms, which are now net 30, which means that contractors buying
building products from the firm are not offered a discount, and they are supposed to pay
the full amount in 30 days. Gross sales are now running $1,000,000 a year, and 80 percent
(by dollar volume) of the firm’s paying customers generally pay the full amount on day 30,
while the other 20 percent pay, on average, on day 40. Two percent of the firm’s gross sales
end up as bad debt losses.
The brothers are now considering a change in the firm’s credit policy. The
change would entail (1) changing the credit terms to 2/10, net 20, (2) employing
stricter credit standards before granting credit, and (3) enforcing collections
Mini Case: 27 – 6
© 2017 Cengage Learning. All Rights Reserved. May not be scanned, copied or duplicated, or posted to a publicly accessible
website, in whole or in part.
with greater vigor than in the past. Thus, cash customers and those paying
within 10 days would receive a 2 percent discount, but all others would have to
pay the full amount after only 20 days. The brothers believe that the discount
would both attract additional customers and encourage some existing customers
to purchase more from the firm–after all, the discount amounts to a price
reduction. Of course, these customers would take the discount and, hence,
would pay in only 10 days.
The net expected result is for sales to increase to $1,100,000; for 60 percent of
the paying customers to take the discount and pay on the 10th day; for 30
percent to pay the full amount on day 20; for 10 percent to pay late on day 30;
and for bad debt losses to fall from 2 percent to 1 percent of gross sales. The
firm’s operating cost ratio will remain unchanged at 75 percent, and its cost of
carrying receivables will remain unchanged at 12 percent.
To begin the analysis, describe the four variables that make up a firm’s credit
policy, and explain how each of them affects sales and collections. Then use the
information given in part H to answer parts I through N.
Answer: The four variables which make up a firm’s credit policy are (1) the discount offered,
Cash discounts generally produce two benefits: (1) they attract both new
customers and expanded sales from current customers, because people view discounts
The credit period is the length of time allowed to all “qualified” customers to pay
Finally, collection policy refers to the procedures that the firm follows to collect
past-due accounts. These can range from a simple letter or phone call to turning the
j. Under the current credit policy, what is the firm’s days sales outstanding (DSO)?
What would the expected DSO be if the credit policy change were made?
Mini Case: 27 – 7
© 2017 Cengage Learning. All Rights Reserved. May not be scanned, copied or duplicated, or posted to a publicly accessible
website, in whole or in part.
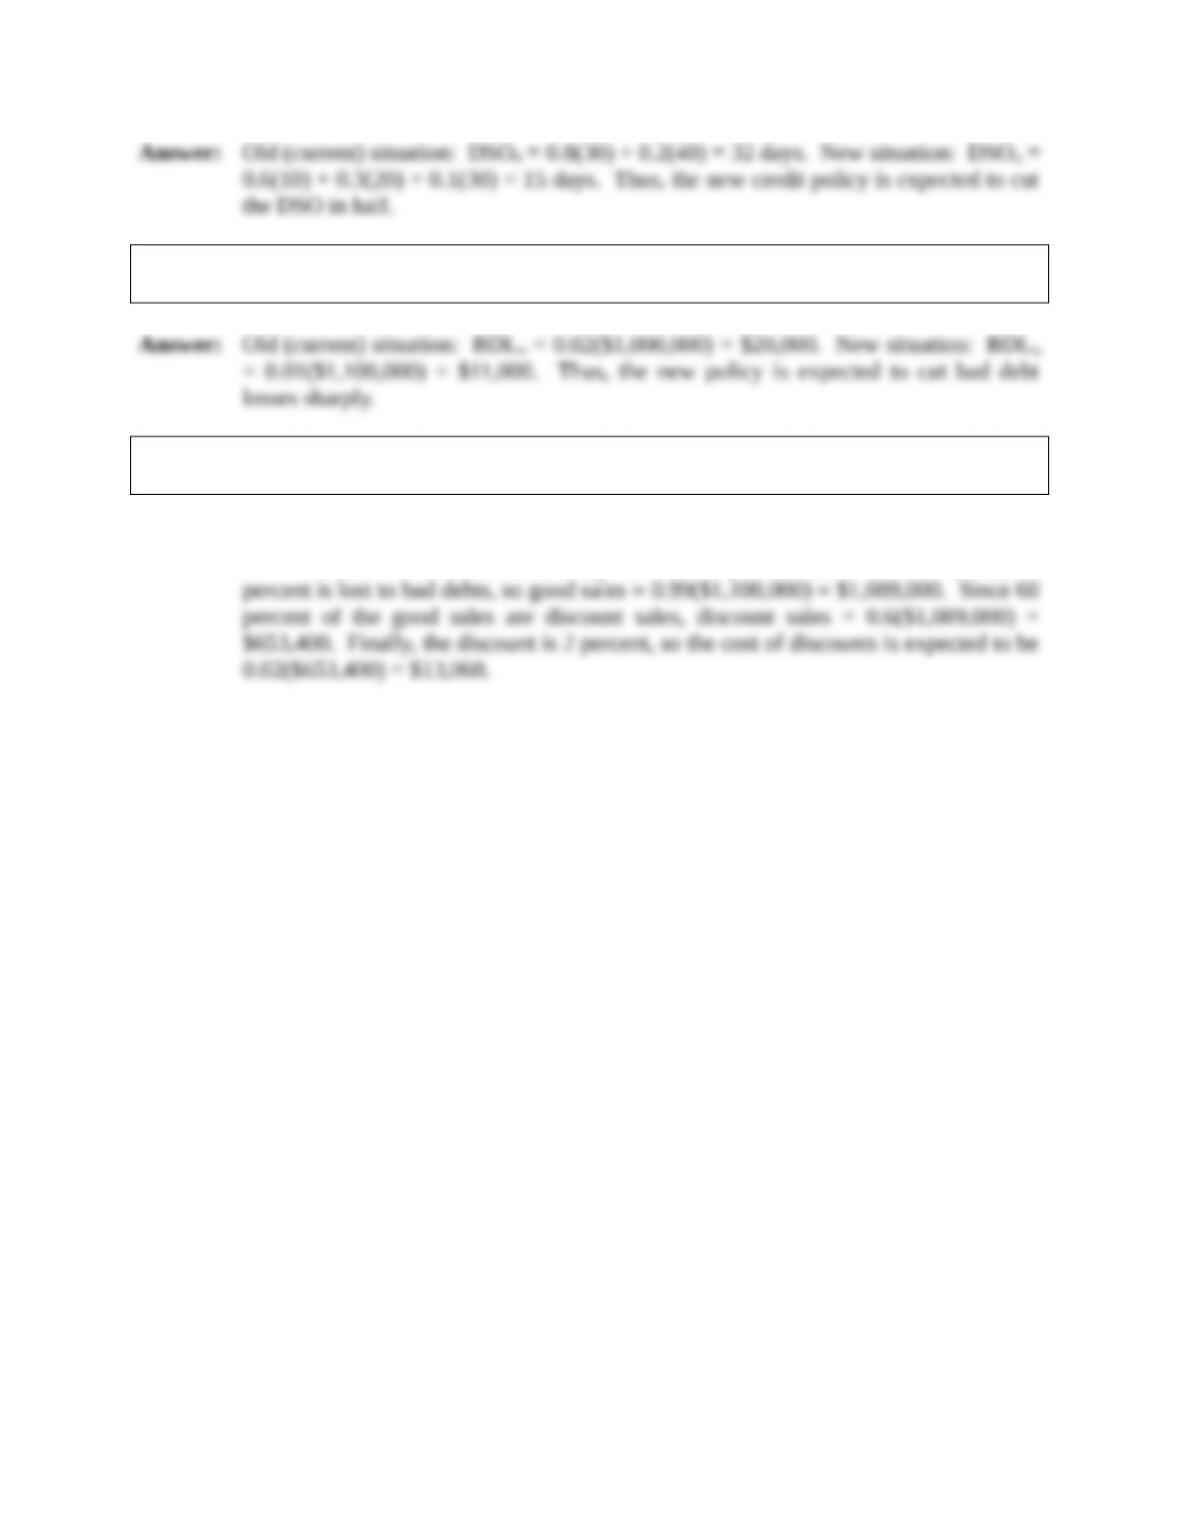
k. What is the dollar amount of the firm’s current bad debt losses? What losses
would be expected under the new policy?
l. What would be the firm’s expected dollar cost of granting discounts under the
new policy?
Answer: Current situation: under the current, no discount policy, the cost of discounts is $0.
New situation: of the $1,100,000 gross sales expected under the new policy, 1
Mini Case: 27 – 8
© 2017 Cengage Learning. All Rights Reserved. May not be scanned, copied or duplicated, or posted to a publicly accessible
website, in whole or in part.