Chapter 25
Portfolio Theory and Asset Pricing Models
ANSWERS TO END-OF-CHAPTER QUESTIONS
25-1 a. A portfolio is made up of a group of individual assets held in combination. An asset
The feasible, or attainable, set represents all portfolios that can be constructed from a
given set of stocks. This set is only efficient for part of its combinations.
An efficient portfolio is that portfolio which provides the highest expected return for
The efficient frontier is the set of efficient portfolios out of the full set of potential
b. An indifference curve is the risk/return trade-off function for a particular investor and
The optimal portfolio for an investor is the point at which the efficient set of
c. The Capital Asset Pricing Model (CAPM) is a general equilibrium market model
The Capital Market Line (CML) specifies the efficient set of portfolios an investor
d. The characteristic line for a particular stock is obtained by regressing the historical
e. Arbitrage Pricing Theory (APT) is an approach to measuring the equilibrium
risk/return relationship for a given stock as a function of multiple factors, rather than
25-2 Security A is less risky if held in a diversified portfolio because of its lower beta and
negative correlation with other stocks. In a single-asset portfolio, Security A would be
more risky because σA > σB and CVA > CVB.
SOLUTIONS TO END-OF-CHAPTER PROBLEMS
25-1 bi = iM (i / M) = 0.70(0.40/0.20) = 1.4.
25-3 rp = wArA + (1 wA) rB
p =
=
25-4 a.
.)rr(rb)rr(rr
M
iiM
RFMRFiRFMRFi
b. CML:
.
rr
rr p
M
RF
M
RF
p
SML:
.r
rr
rr
iiM
M
RFM
RFi
With some arranging, the similarities between the CML and SML are obvious. When
in this form, both have the same market price of risk, or slope, (rM – rRF)/σM.
The measure of risk in the CML is σp. Since the CML applies only to efficient
portfolios, σp not only represents the portfolio’s total risk, but also its market risk.
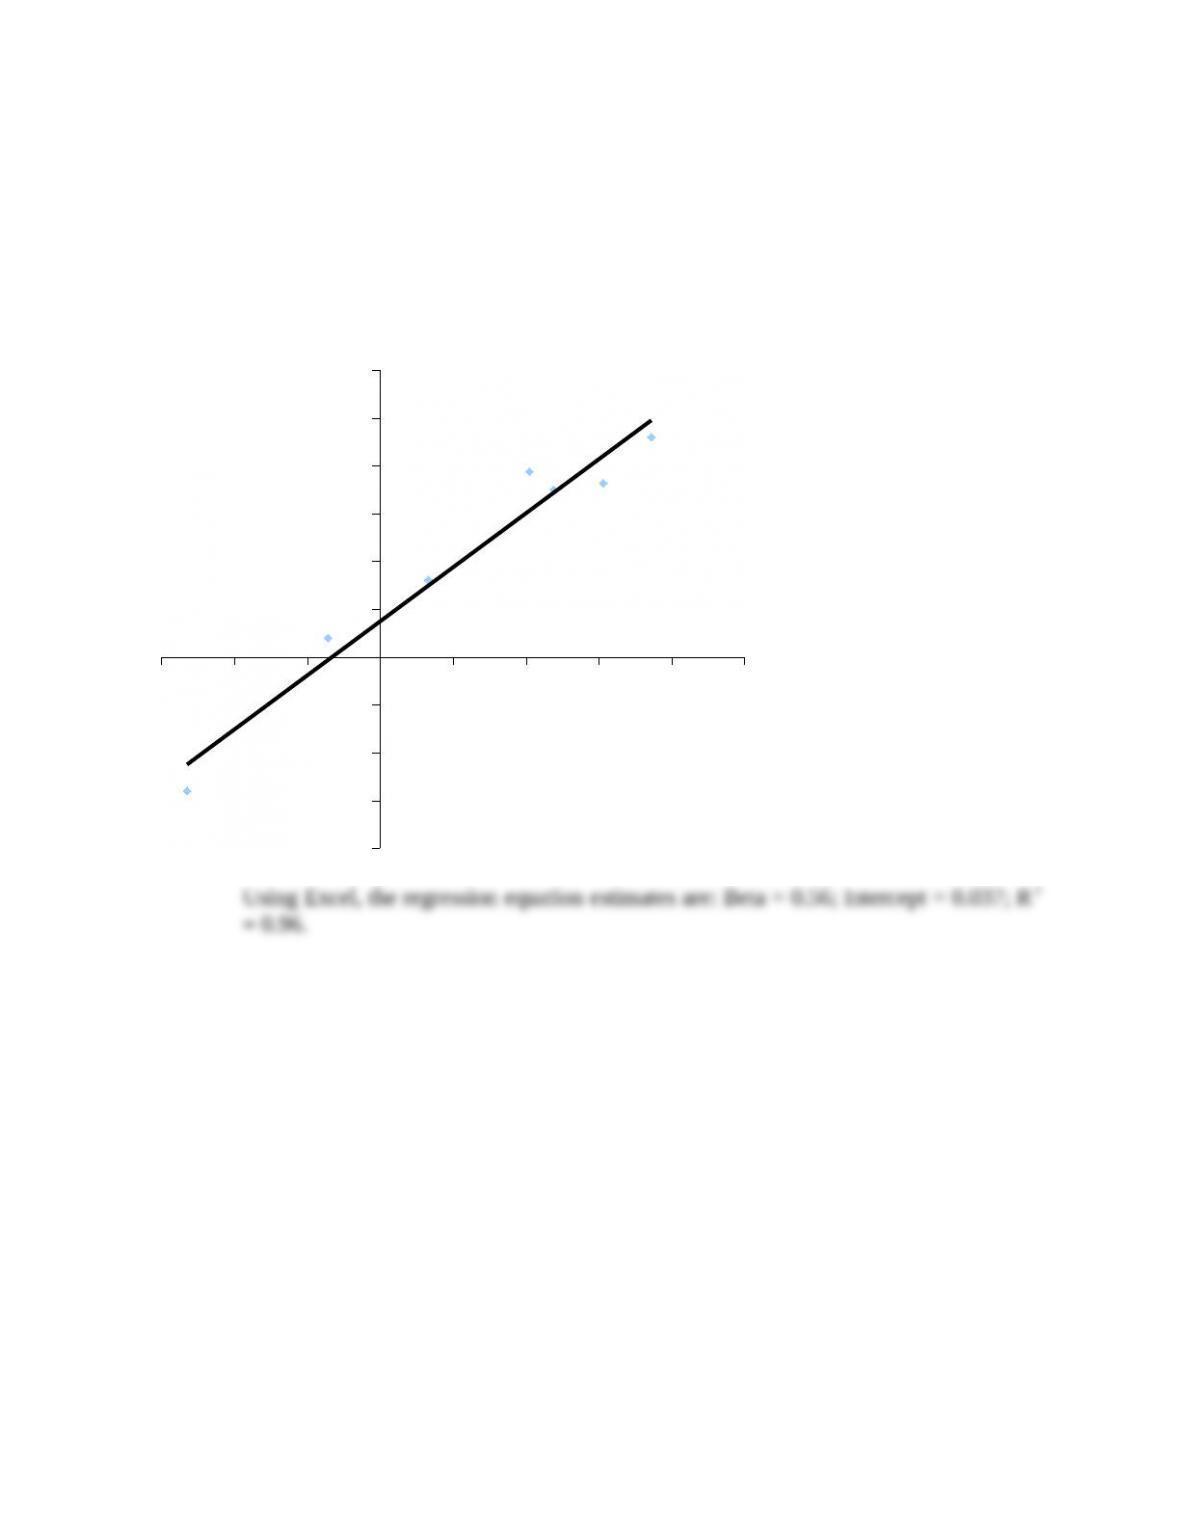
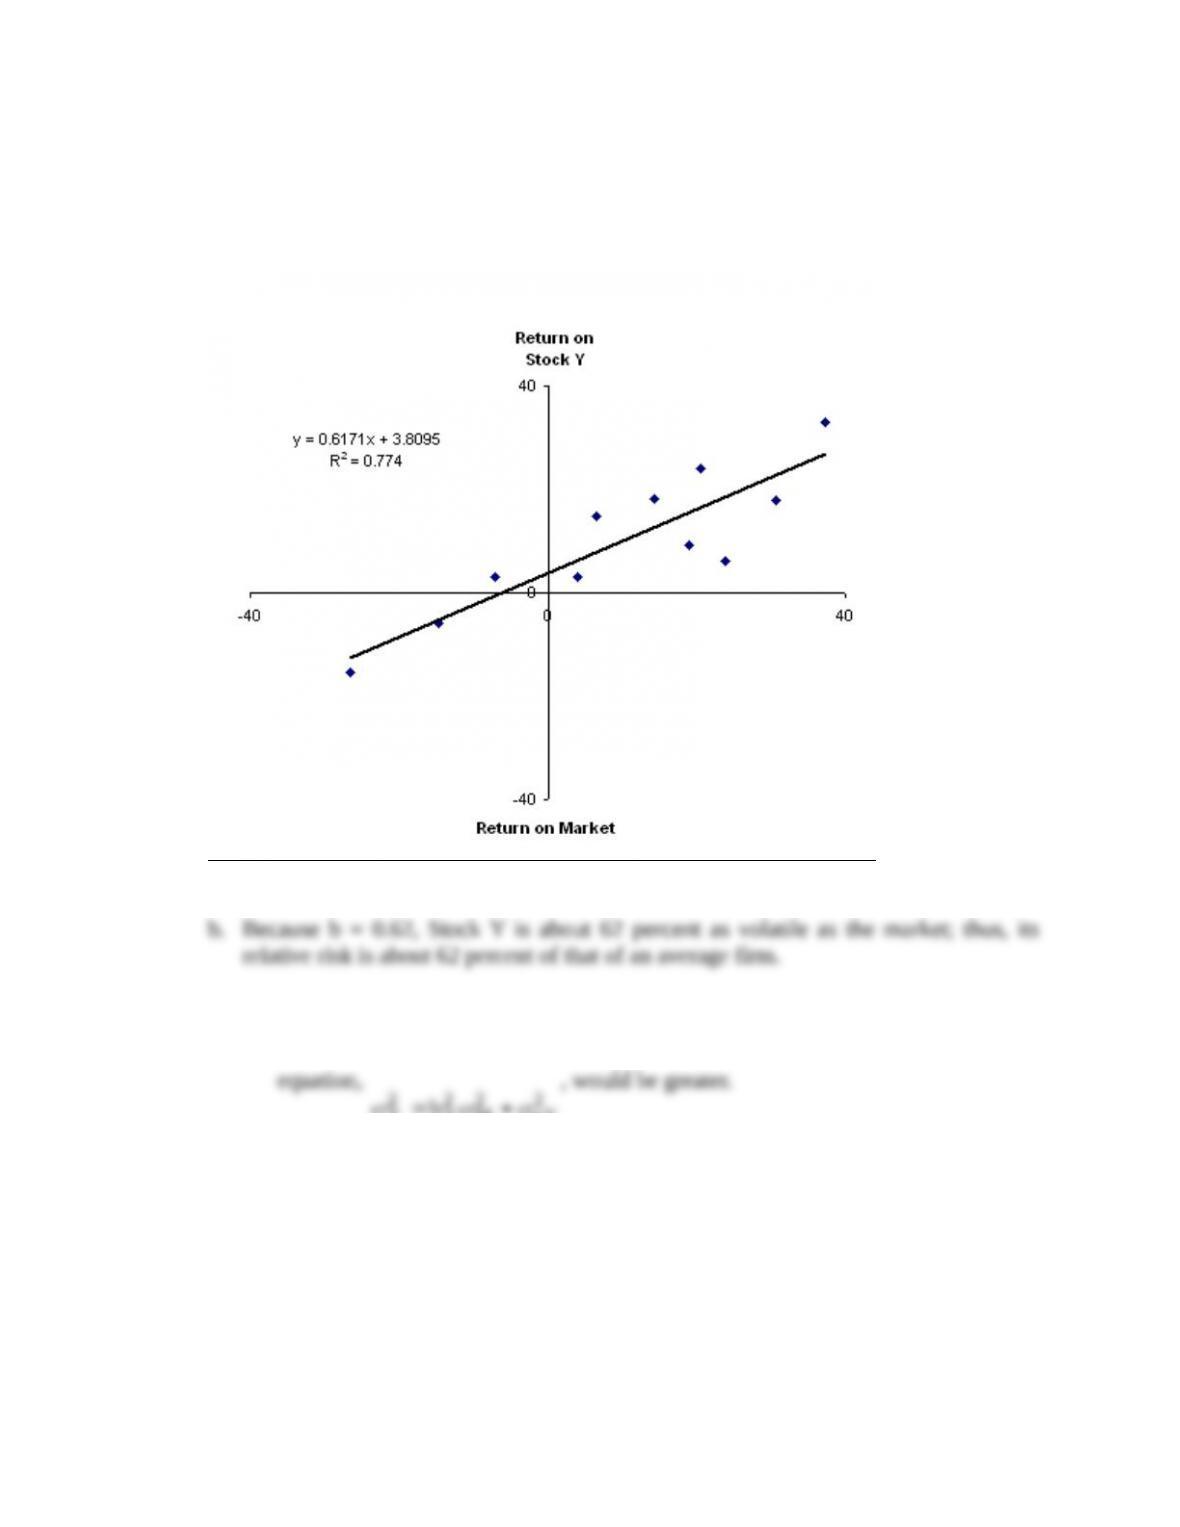
25-5 a. A plot of the approximate regression line is shown in the following figure:
-30 -20 -10 0 10 20 30 40 50
-20
-15
-10
-5
0
5
10
15
20
25
30
Using Excel, the regression equation estimates are: Beta = 0.56; Intercept = 0.037; R2
= 0.96.
b. The arithmetic average return for Stock X is calculated as follows:
%.6.10
7
)2.18…0.230.14(
r
Avg
c. Since Stock X is in equilibrium and plots on the Security Market Line (SML), and
given the further assumption that
XX
rr
and
MM
rr
–and this assumption often
does not hold–then this equation must hold:
.b)rr(rr
XRFRF
X
This equation can be solved for the risk-free rate, rRF, which is the only unknown:
%.6.844.0/8.3r
8.66.10r44.0
r56.08.6r6.10
56.0)r1.12(r6.10
RF
RF
RFRF
RFRF
X
r
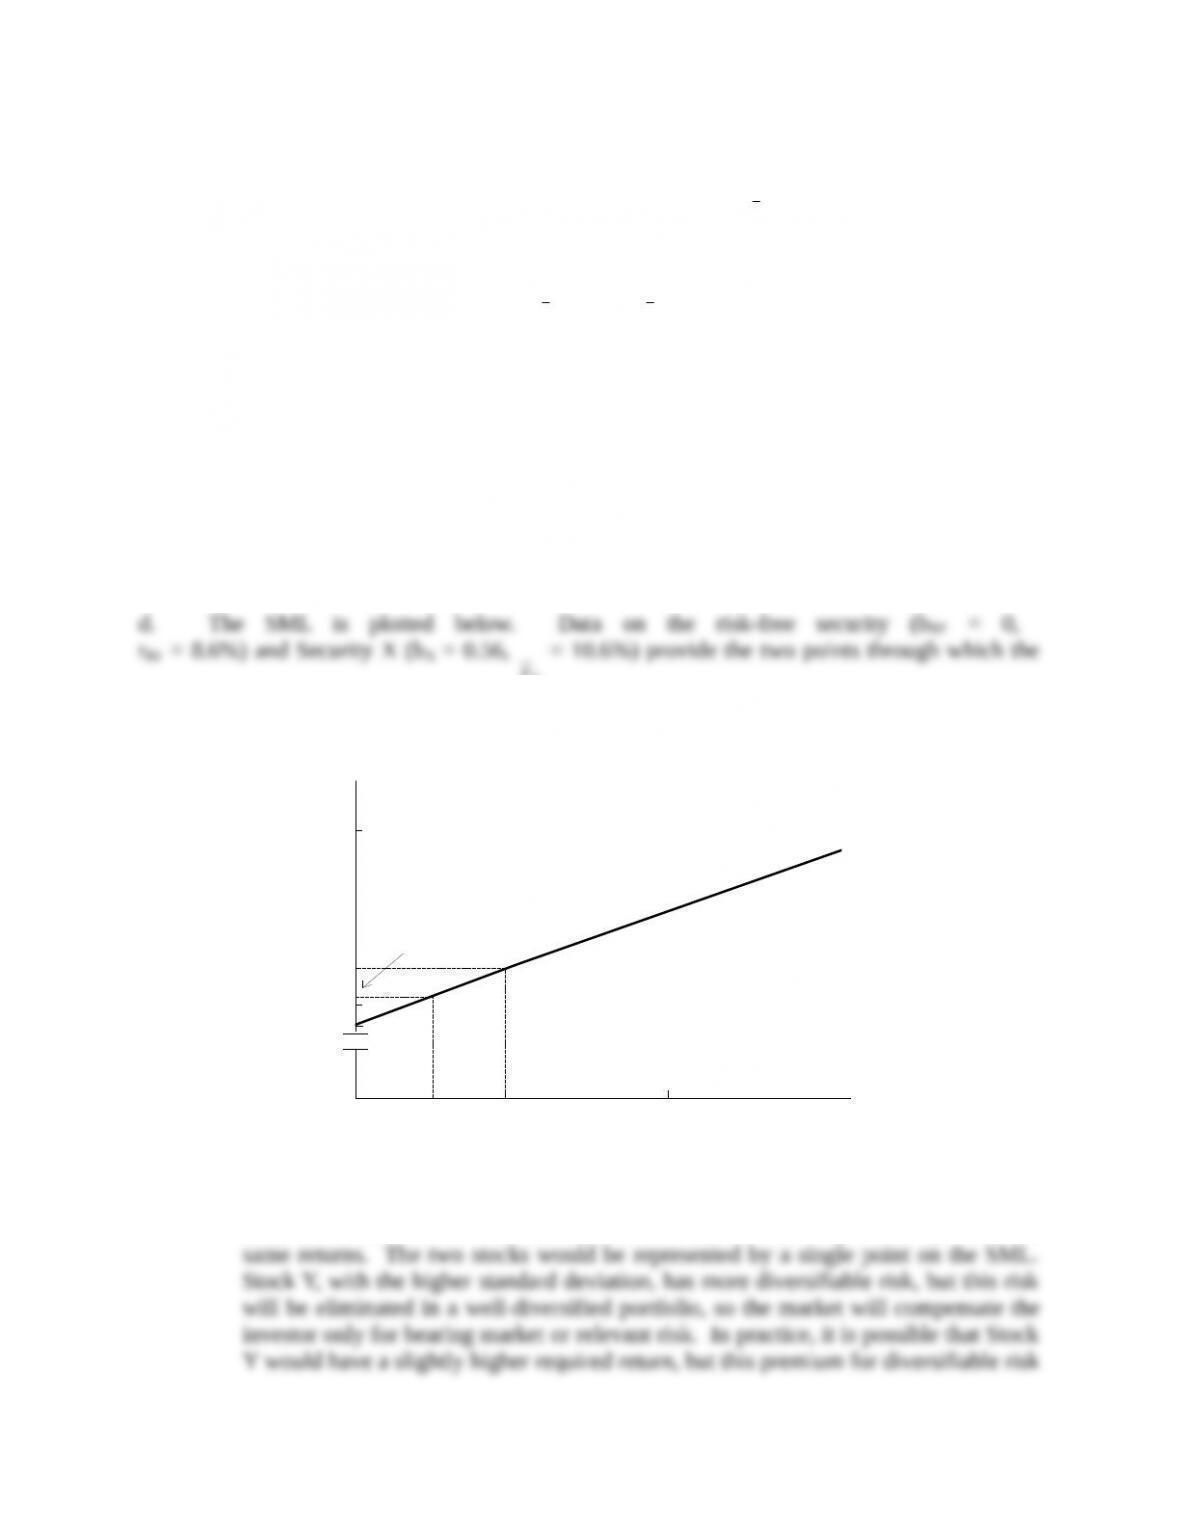
SML can be drawn. rM provides a third point.
e. In theory, you would be indifferent between the two stocks. Since they have the same
beta, their relevant risks are identical, and in equilibrium they should provide the
Beta
k(%)
20
10
1.0 2.0
= 8.6
kX= 10.6%
kM= 12.1%
kRF
r(%)
rX = 10.6%
rRF = 8.6%
c. 1. Total risk
)(
2
Y
would be greater because the second term of the firm’s risk
2
eY
2
M
2
Y
2
Y
b
2. CAPM assumes that company-specific risk will be eliminated in a portfolio, so
the risk premium under the CAPM would not be affected.

d. 1. The stock’s variance would not change, but the risk of the stock to an investor
holding a diversified portfolio would be greatly reduced.
SOLUTION TO SPREADSHEET PROBLEM
25-7 The detailed solution for the spreadsheet problem is available in the file Ch25 P07 Build
a Model Solution.xlsx on the textbook’s Web site.