MINI CASE
David Lyons, CEO of Lyons Solar Technologies, is concerned about his firm’s level of debt
financing. The company uses short-term debt to finance its temporary working capital
needs, but it does not use any permanent (long-term) debt. Other solar technology
companies average about 30 percent debt, and Mr. Lyons wonders why they use so much
more debt, and what its effects are on stock prices. To gain some insights into the matter,
he poses the following questions to you, his recently hired assistant:
a. Who were Modigliani and Miller (MM), and what assumptions are embedded in
the MM and Miller models?
Answer: Modigliani and Miller (MM) published their first paper on capital structure (which
assumed zero taxes) in 1958, and they added corporate taxes in their 1963 paper.
Firms’ business risk can be measured by σEBIT, and firms with the same degree of
risk can be grouped into homogeneous business risk classes.
All investors have identical (homogeneous) expectations about all firms’ future
earnings.
These assumptions–all of them–were necessary in order for MM to use the arbitrage
b. Assume that firms U and L are in the same risk class, and that both have EBIT =
$500,000. Firm U uses no debt financing, and its cost of equity is rsU = 14%.
Firm L has $1 million of debt outstanding at a cost of rd = 8%. There are no
taxes. Assume that the MM assumptions hold, and then:
1. Find v, s, rs, and WACC for firms U and L.
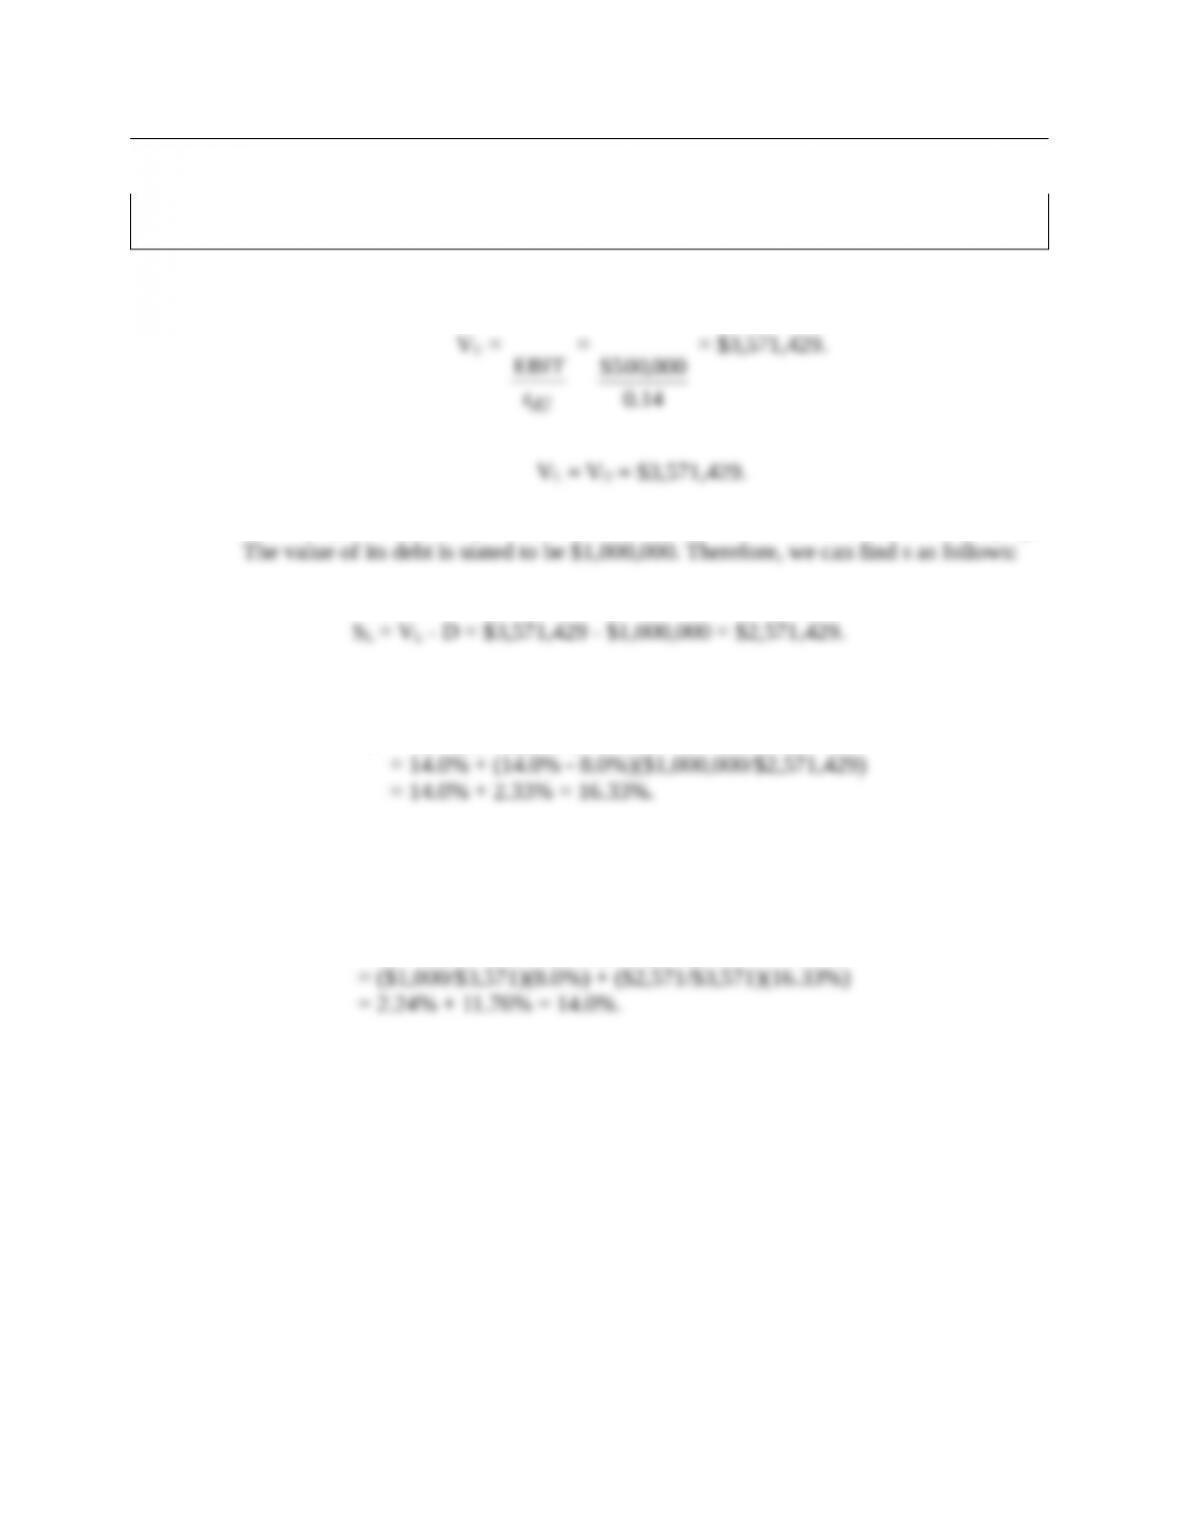
Answer: First, we find Vu and VL:
To find rsL, it is necessary first to find the market values of firm L’s debt and equity.
D + SL = VL
Now we can find L’s cost of equity, rsL:
rsL = rsU + (rsU – rd)(D/S)
We know from Proposition I that the WACC must be WACC = rsU = 14.0% for all
firms in this risk class, regardless of leverage, but this can be verified using the
WACC formula:
WACC = wdrd + wcers = (D/V)rd + (S/V)rs
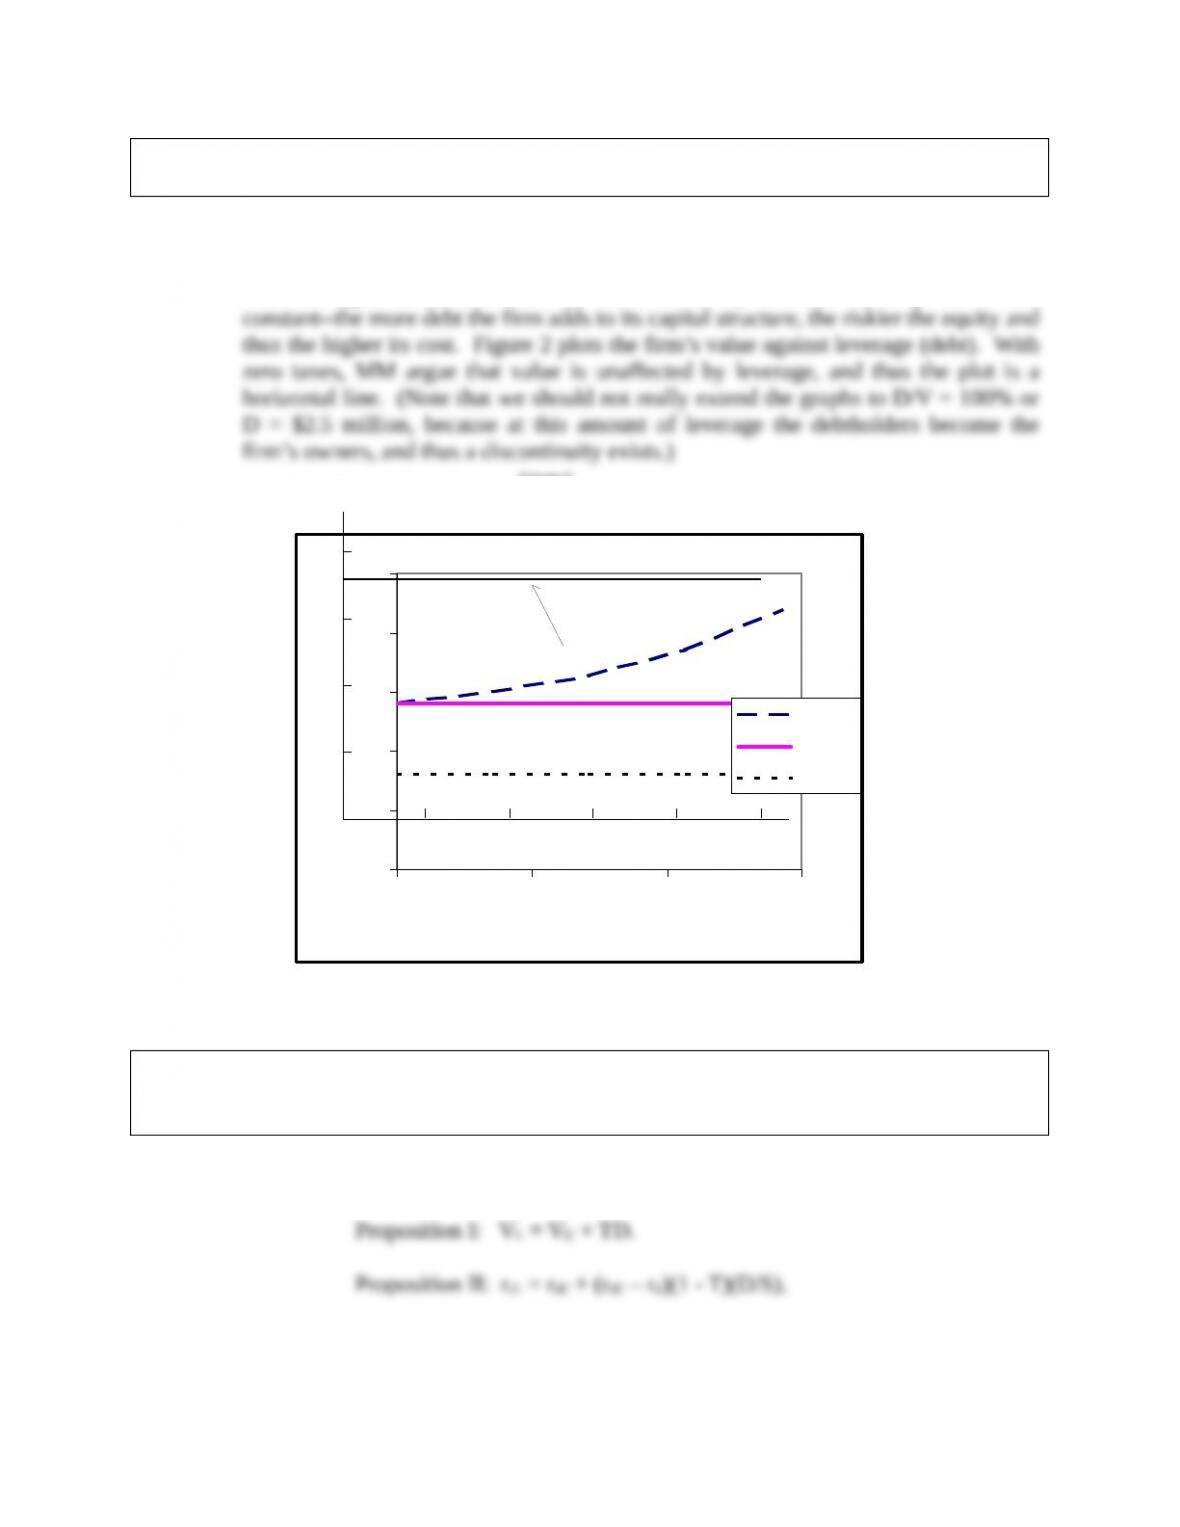
b. 2. Graph (a) the relationships between capital costs and leverage as measured by
D/V, and (b) the relationship between value and D.
Answer: Figure 1 plots capital costs against leverage as measured by the debt/value ratio.
Note that, under the MM no-tax assumption, rd is a constant 8 percent, but rs increases
with leverage. Further, the increase in rs is exactly sufficient to keep the WACC
Figure 1
c. Using the data given in part B, but now assuming that firms L and U are both
subject to a 40 percent corporate tax rate, repeat the analysis called for in B(1)
and B(2) under the MM with-tax model.
Answer: With corporate taxes added, the MM propositions become:
There are two very important differences between these propositions and the zero-tax
propositions: (1) when corporate taxes are added, VL does not equal VU; rather, VL
Without Taxes
0%
5%
10%
15%
20%
25%
0% 20% 40% 60%
Debt/Value Ratio
Cost of Capital
rs
WACC
rd
4
3
2
1
0 0.5 1.0 1.5 2.0 2.5
Firm Value ($3.6 Million)
Value of Firm, V
(Millions of $)
VUVL
($)
Debt ($)
Figure 2
Note also that with corporate taxes considered, VU changes to
sU
r
)T1(EBIT
14.0
)6.0(000,500$
This represents a 40% decline in value, and it is logical, because the 40% tax rate
To find rsL, it is first necessary to find the market value of the equity:
D + SL = VL
now,
rsL = rsU + (rsU – rd)(1 – T)(D/S)
Firm L’s WACC is 11.8 percent:
WACCL= (D/V)rd(1 – T) + (S/V)rs
The WACC is lower for the levered firm than for the unlevered firm when corporate
taxes are considered.
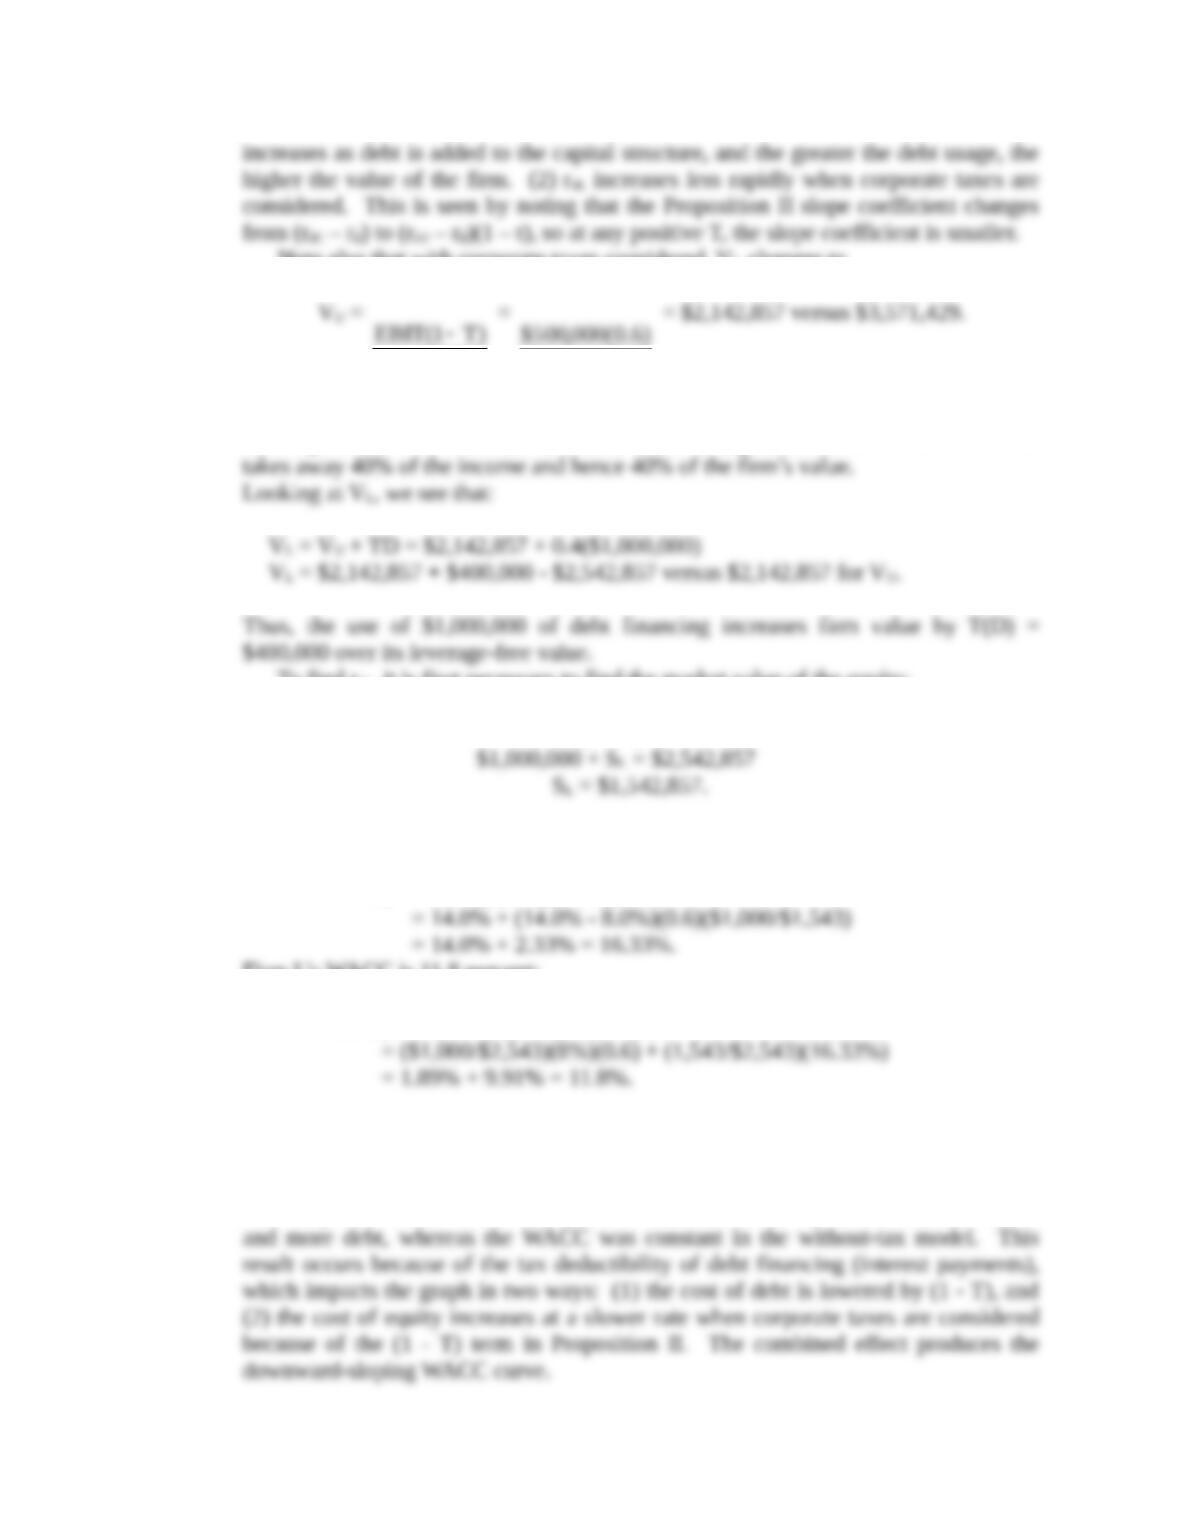
Figure 3 below plots capital costs at different D/V ratios under the MM model
with corporate taxes. Here the WACC declines continuously as the firm uses more
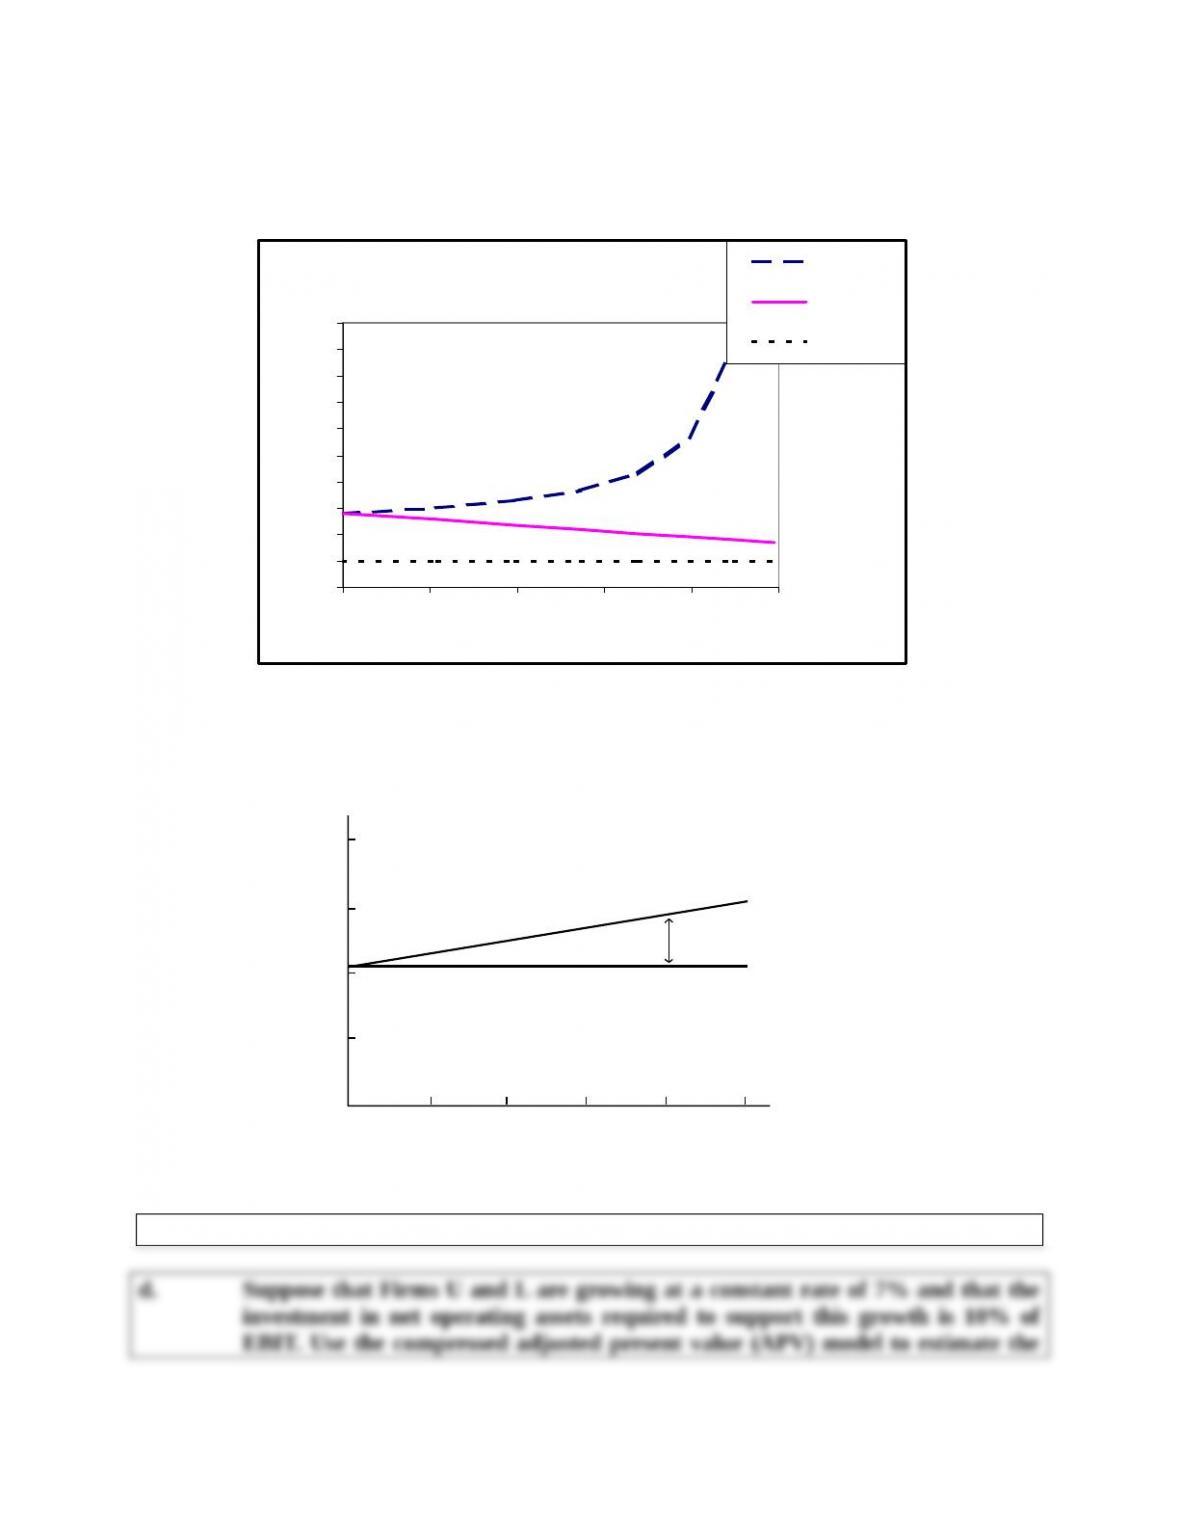
Figure 4 shows that, when corporate taxes are considered, the firm’s value
increases continuously as more and more debt is used.
Figure 3
With Taxes
0%
5%
10%
15%
20%
25%
30%
35%
40%
45%
50%
0% 20% 40% 60% 80% 100%
Debt/Value Ratio
Cost of Capital
rs
WACC
rd x (1-T)
4
3
2
1
0 0.5 1.0 1.5 2.0 2.5
Value of Firm, V
(Millions of $)
VU
VL
($)
Debt ($)
TD
Figure 4
value of U and L. Also estimate the levered cost of equity and the weighted
average cost of capital.
Answer: If a firm is growing, the assumptions that MM made are violated. The extension to
the MM model shows how growth affects the value of the debt tax shield and the cost
First, calculate expected free cash flow:
Investment In Net Operating Assets = 0.10 X EBIT = $50,000
Free Cash Flow = NOPAT – Investment In Net Operating Assets
(Note that this is an expected value for the coming year since EBIT is an expected
value for the coming year.)
The Value Of U = Expected FCF/(WACC – g)
Which is greater than in part C because the firm is growing.
If there is $1,000,000 in debt then:
The value of l = the value of U + value of debt tax shield
The value of the (growing) debt tax shield = rdTD/(rsU – g)
In this case the increase in the firm’s value due to the debt tax shield as a percent of
This is less than the increase in the non-growing firm’s value as calculated using the
To calculate the new levered cost of equity:
rsL = rsU + (rsU – rd)(D/S)
And the new levered WACC:
WACCL= (D/V)rd(1 – T) + (S/V)rs
e. Suppose the expected free cash flow for Year 1 is $250,000 but it is expected to
grow unevenly over the next 3 years: FCF2 = $290,000 and FCF3 = $320,000,
after which it will grow at a constant rate of 7%. The expected interest expense
at Year 1 is $80,000, but it is expected to grow over the next couple of years
before the capital structure becomes constant: Interest expense at Year 2 will be
$95,000, at Year 3 it will be $120,000 and it will grow at 7% thereafter. What is
the estimated horizon unlevered value of operations (i.e., the value at Year 3
immediately after the FCF at Year 3)? What is the current unlevered value of
operations? What is the horizon value of the tax shield at Year 3? What is the
current value of the tax shield? What is the current total value? The tax rate and
unlevered cost of equity remain at 40% and 14%, respectively.
Answer: The unlevered horizon value of operations can be found by applying the constant
growth formula:
The unlevered value of operations is the present value of the free cash flows and the
horizon value. In Excel, the formula is:
The tax shields are found by multiplying the interest expenses by the tax rate:
The horizon value of the tax shield can be found by applying the constant growth
formula:
The unlevered value of operations is the present value of the free cash flows and the
horizon value. In Excel, the formula is:

The value of operations is the sum of the unlevered value of operations and the value
of the tax shield: