Unlock document.
This document is partially blurred.
Unlock all pages and 1 million more documents.
Get Access
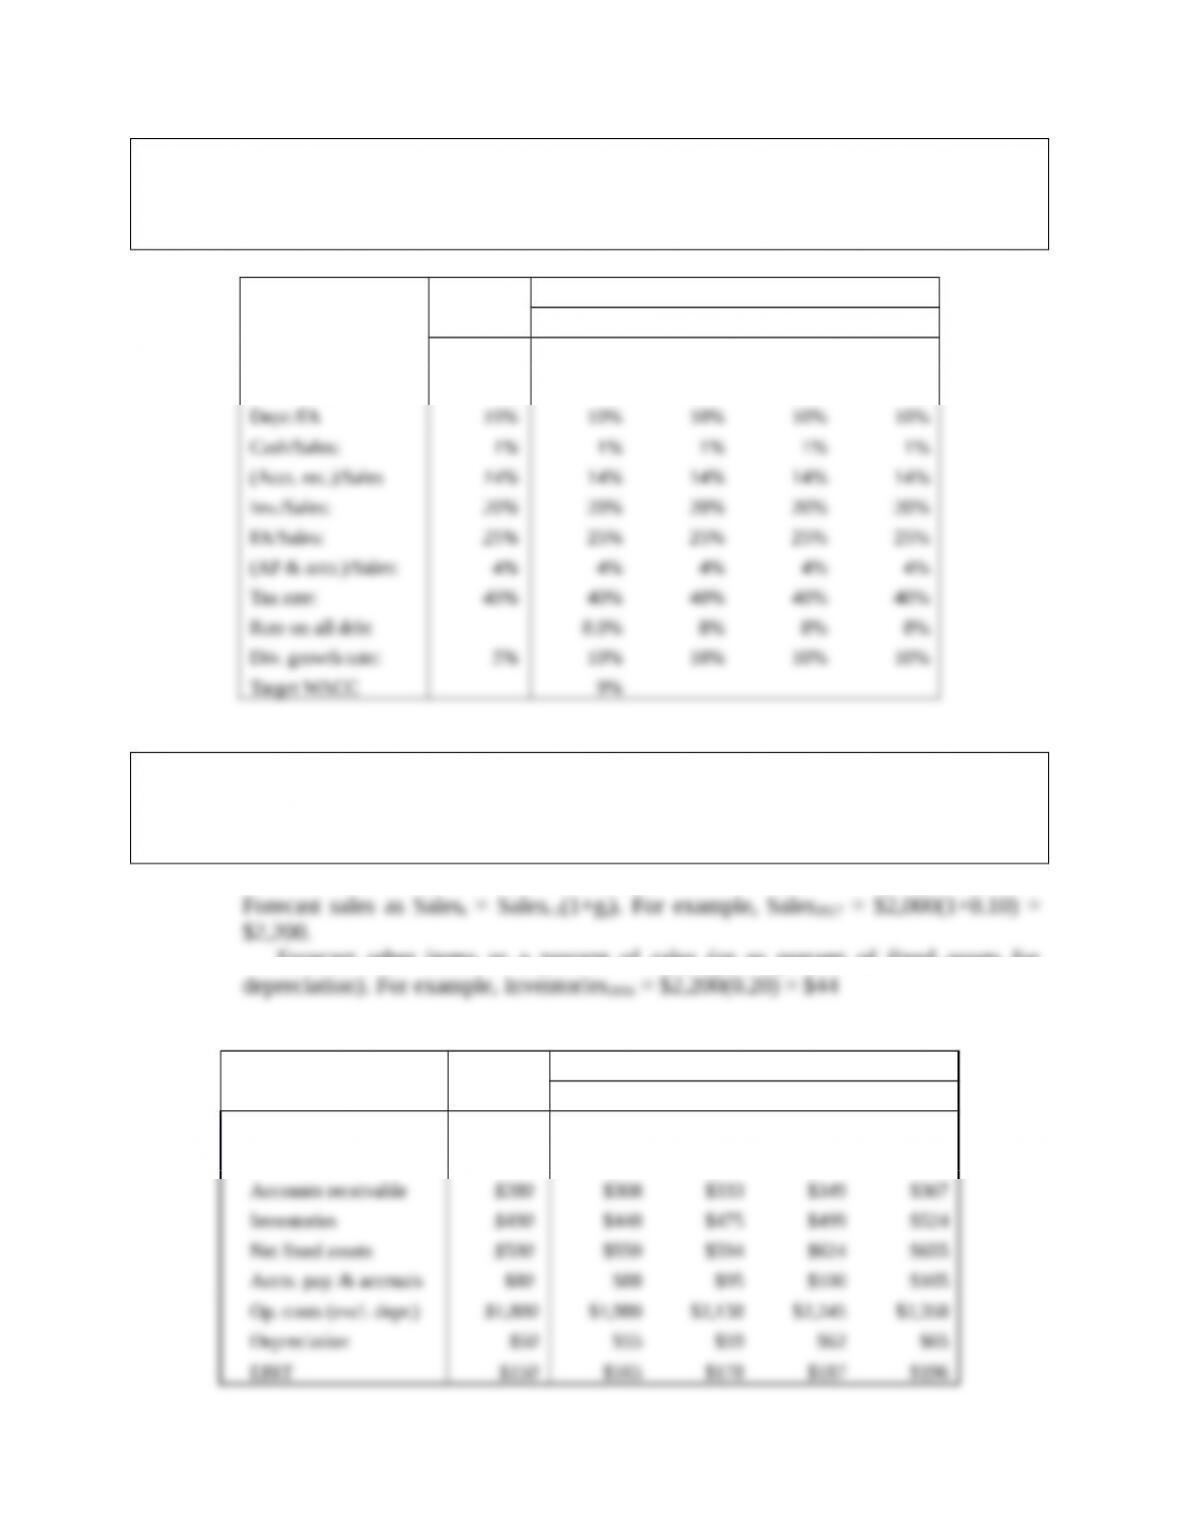
e. Use the following assumptions to answer the questions below: (1) Operating
ratios remain unchanged. (2) Sales will grow by 10%, 8%, 5%, and 5% for the
next four years. (3) The target weighted average cost of capital (WACC) is 9%.
This is the No Change scenario because operations remain unchanged.
Actual Forecast
Inputs 2016 2017 2018 2019 2020
Sales growth rate: 10% 8% 5% 5%
(Op. costs)/Sales: 90% 90% 90% 90% 90%
e. 1. For each of the next four years, forecast the following items: sales, cash, accounts
receivable, inventories, net fixed assets, accounts payable & accruals, operating
costs (excluding depreciation), depreciation, and earnings before interest and
taxes (EBIT).
Forecast other items as a percent of sales (or as percent of fixed assets for
Scenario: No Change Actual Forecast
2016 2017 2018 2019 2020
Net sales $2,000 $2,200 $2,376 $2,495 $2,620
Cash $20 $22 $24 $25 $26
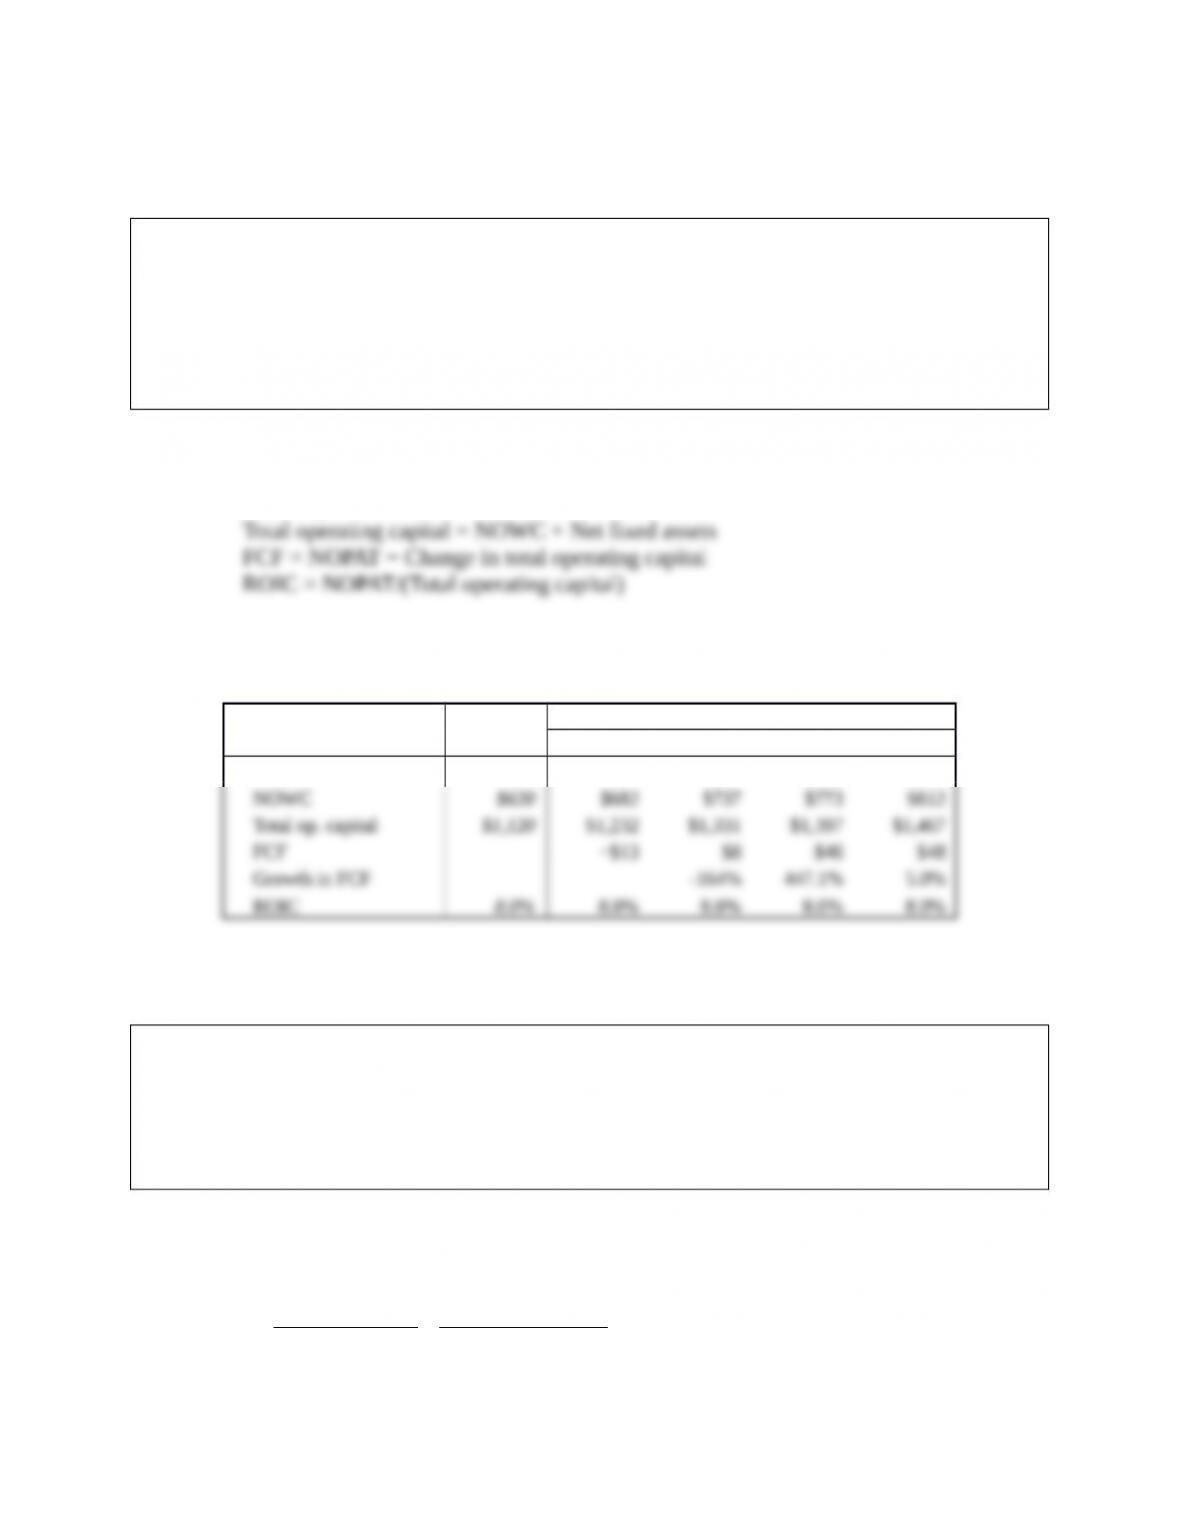
e. 2. Using the previously forecasted items, calculate for each of the next four years
the net operating profit after taxes (NOPAT), net operating working capital, total
operating capital, free cash flow, (FCF), annual growth rate in FCF, and return
on invested capital. What does the forecasted free cash flow in the first year
imply about the need for external financing? Compare the forecasted ROIC
compare with the WACC. What does this imply about how well the company is
performing?
NOPAT = EBIT(1-T)
NOWC = (Cash + accounts receivable + inventories) − (Accounts payable &
accruals)
Scenario: Actual Forecast
No Change 2016 2017 2018 2019 2020
NOPAT $90 $99 $107 $112 $118
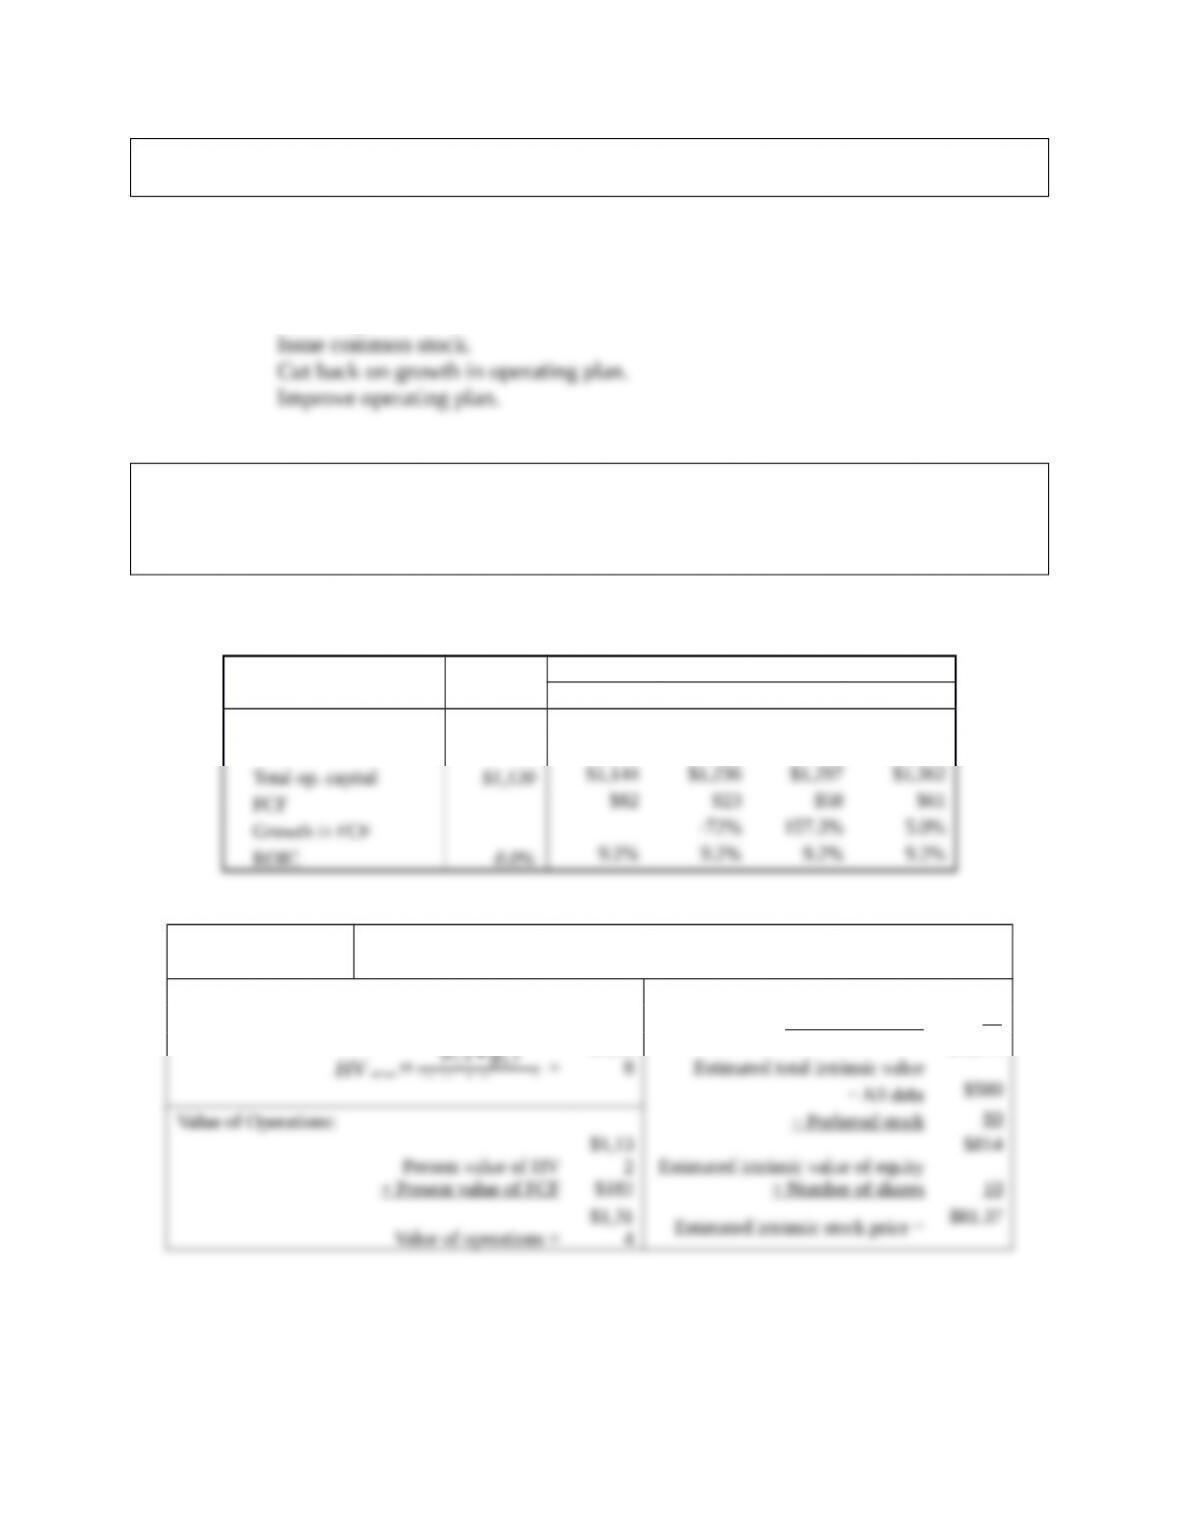
e. 3. Assume that FCF will continue to grow at the growth rate for the last year in the
forecast horizon (Hint: 5%). What is the horizon value at 2020? What is the
present value of the horizon value? What is the present value of the forecasted
FCF? (Hint: use the free cash flows for 2017 through 2020). What is the current
value of operations? Using information from the 2016 financial statements, what
is the current estimated intrinsic stock price?
With no rounding in intermediate steps, FCF2020 = $48.025.
HV2020=FCF 2020(1+gL)
(WACC−gL)=$48.025(1+0.05)
(0.09−0.05)=$1,261
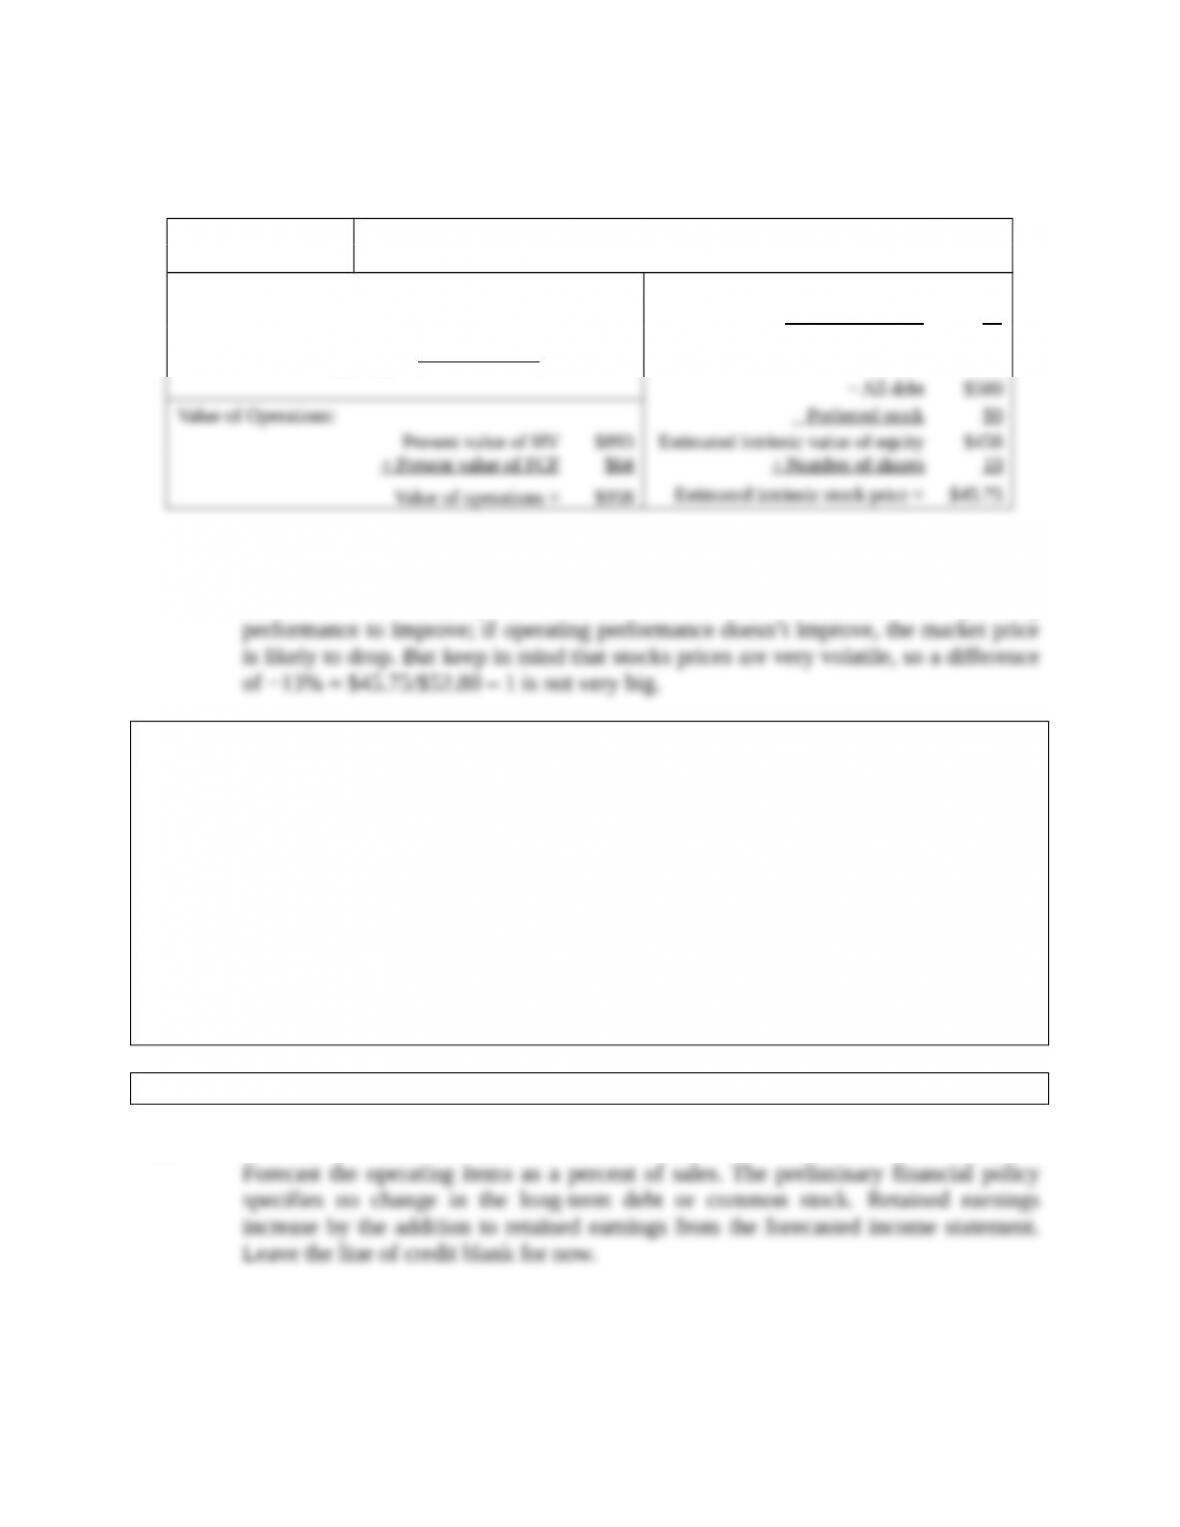
Scenario:
No Change
Horizon Value: Value of operations $958
+ ST investments $0
=
$1,26
1 Estimated total intrinsic value $958
The estimated intrinsic stock value of $45.75 is less than the actual market price of
$52.80. The market price indicates that the market expected the operating
f. Continue with the same assumptions for the No Change scenario from the
previous question, but now forecast the balance sheet and income statements for
2017 (but not for the following three years) using the following preliminary
financial policy. (1) Regular dividends will grow by 10%. (2) No additional
long-term debt or common stock will be issued. (3) The interest rate on all debt is
8%. (4) Interest expense for long-term debt is based on the average balance
during the year. (5) If the operating results and the preliminary financing plan
cause a financing deficit, eliminate the deficit by drawing on a line of credit. The
line of credit would be tapped on the last day of the year, so it would create no
additional interest expenses for that year. (6) If there is a financing surplus,
eliminate it by paying a special dividend. After forecasting the 2017 financial
statements, answer the following questions.
f. 1. How much will Hatfield need to draw on the line of credit?
Answer: Forecast sales and then items on the balance sheet. The forecast of sales is $2,200.
HV2019=9(1+gL)
(WACC −gL)
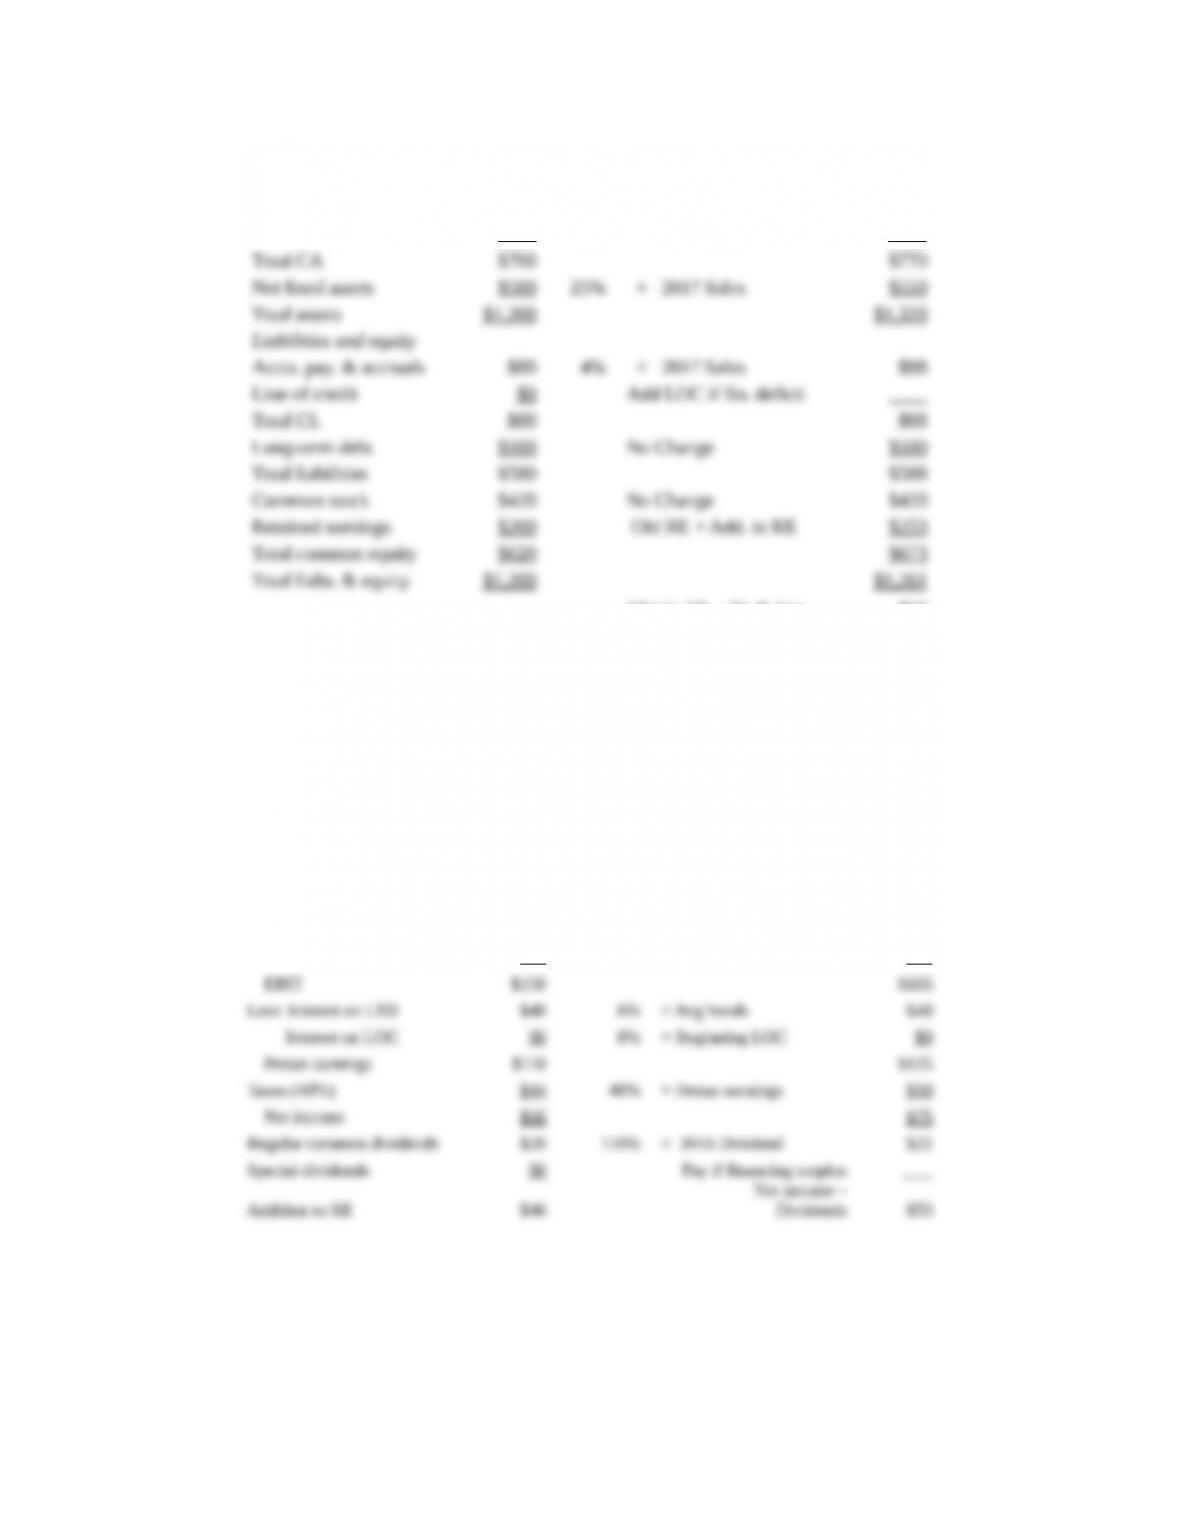
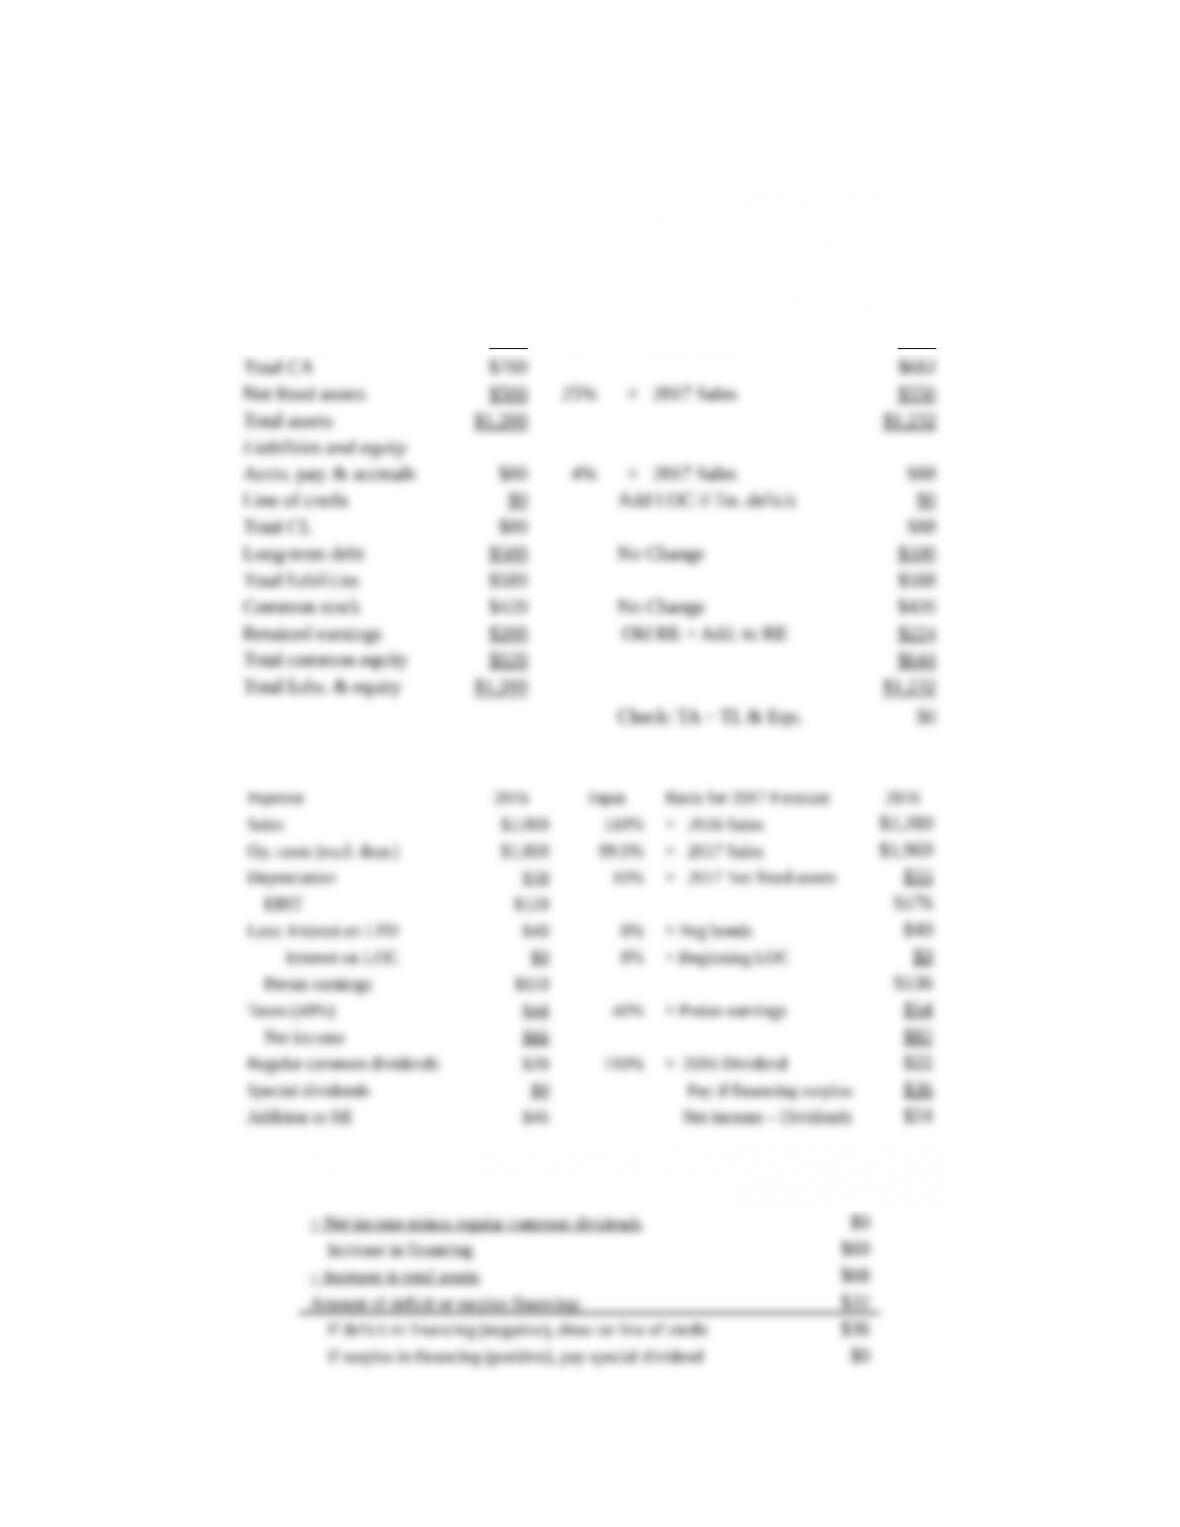
Assets 2016 Input Basis for 2017 Forecast 2017
Cash $20 1% × 2017 Sales $22
Accts. rec. $280 14% × 2017 Sales $308
Inventories $400 20% × 2017 Sales $440
Check: TA − TL & Equ. $59
Forecast the items on the income statement. Costs are a percent of sales, depreciation
is a percent of Net PP&E. Forecast interest expense on the long-term debt as the
product of the interest rate and the average balance on the long-term debt (i.e., the
average of the beginning value and the ending value). Pay a regular dividend. Leave
the special dividend blank for now.
2016 Input Basis for 2017 Forecast 2017
Sales $2,000 110% × 2016 Sales
$2,20
0
Op. costs (excl. depr.) $1,800 90% × 2017 Sales
$1,98
0
Depreciation $50 10% × 2017 Net fixed assets $55
The next step is to identify the financing surplus or deficit. Start with the additions to
operating assets, subtract the increase in spontaneous liabilities (accounts payable and
accruals), subtract any new external financing from long-term debt or common stock,
subtract the previous LOC (because the preliminary financial plan does not call for
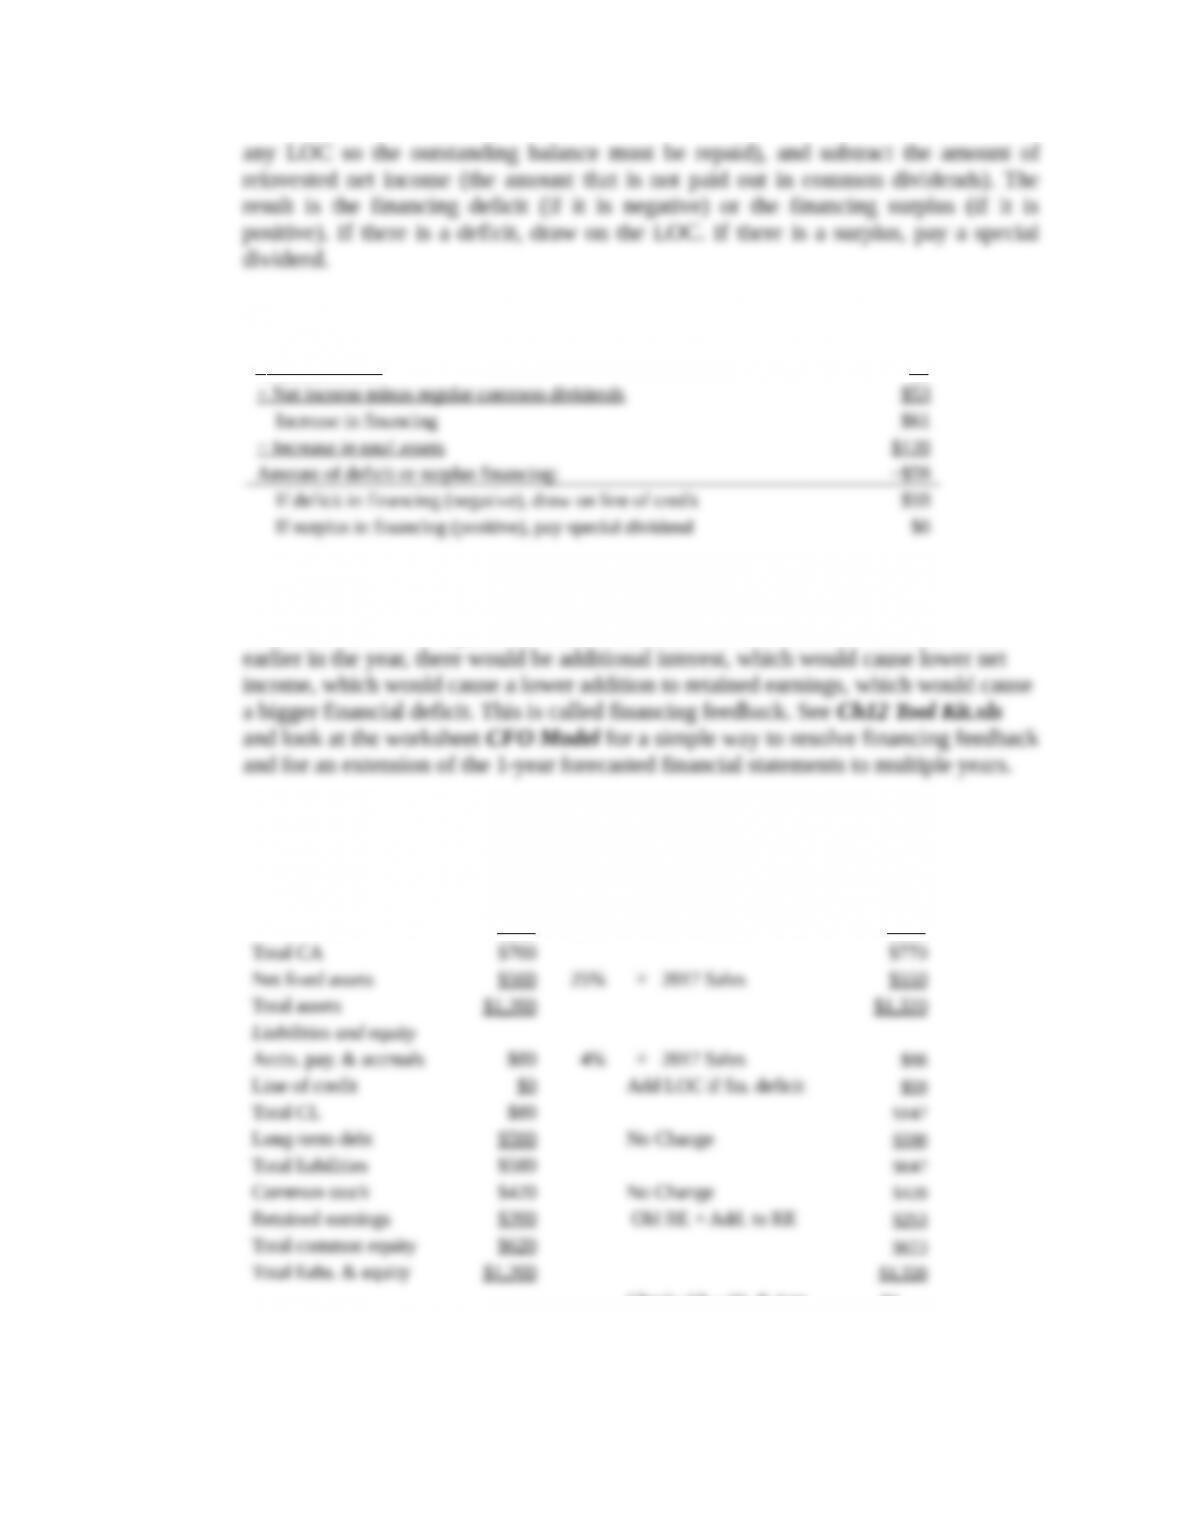
Increase in spontaneous liabilities (accounts payable and accruals) $8
+ Increase in long-term debt and common stock $0
− Previous LOC $0
There is a deficit of $59, so update the balance sheets by adding $59 to the line of
credit. Because the LOC is added at the end of the year, there is no additional interest,
so there is no need to update the income statement. If the LOC were instead added
Assets 2016 Input Basis for 2017 Forecast 2016
Cash $20 1% × 2017 Sales $22
Accts. rec. $280 14% × 2017 Sales $308
Inventories $400 20% × 2017 Sales $440
Check: TA − TL & Equ. $0
f. 2. What are some alternative ways than those in the preliminary financial policy
that Hatfield might choose to eliminate the financing deficit?
Answer: Here are some alternative ways to eliminate the deficit:
Cut dividends.
Add long-term debt.
g. Repeat the analysis performed the previous question but now assume that
Hatfield is able to improve the following inputs: (1) reduce operating costs
(excluding depreciation)/sales to 89.5% at a cost of $40 million; and (2) reduce
inventories/sales to 16% at a cost of $10 million. This is the Improve scenario.
Answer: The impact on the operating plan is shown below:
Scenario: Actual Forecast
Improve 2016 2017 2018 2019 2020
NOPAT $90 $106 $114 $120 $126
NOWC $620 $594 $642 $674 $707
Scenario:
Improve
Horizon Value: Value of operations $1,314
+ ST investments $0
$1,59
$1,314
The impact on the financial statements is shown below.
Scenario:
Improve
Assets 2016 Input Basis for 2017 Forecast 2016
Cash $20 1% × 2017 Sales $22
Accts. rec. $280 14% × 2017 Sales $308
Inventories $400 16% × 2017 Sales $352
Increase in spontaneous liabilities (accounts payable and accruals) $8
+ Increase in long-term debt and common stock $8

g. 1. Should Hatfield implement the plans? How much value would they add to the
company?
g. 2. How much can Hatfield pay as a special dividend in the Improve Scenario? What
else might Hatfield do with the financing surplus?
Answer: Hatfield can pay a special dividend of $35. Instead, Hatfield could repurchase stock,
repay debt, or purchase marketable securities.


