
Canada U.S.
Comparison
Percentage
Can. to U.S.
Tim Hortons
Number of Employees (in millions) 1.1 13.5 8.15% 0.1
Number of Restaurants 81,000 900,000 9.00% 4,546
Revenue Dollars (in billions) 57.5$ 683.40$ 8.41% 3.3$
Revenues per Restaurant 709,876.54$ 759,333.33$ 93.49% 725,912.89$ 2.26% -4.40% 16,036.35$ (33,420.44)$
Employees per Restaurant 14 15 90.53% 22 725,912.89$ 725,912.89$
Growth Rate 4.7% 3.6% 130.56% 4.7%
62.0%
46.6%

Full Service Fast Casual Quick Service
Average Check $13.66 $7.40 $5.30 -28%
Percent of Industry Revenue 32% 4% 28%
Revenue Dollars $ 202.2 billion $ 25.3 billion $ 176.9 billion
Mulitiple Customer Visits per Week 19% 39% 105%
individual- or family-owned

Industry Tim Hortons
Rise in wholesale food prices 7.1%
Rise in menu prices 2.4%
Costs
Food 33%
Labor 33%
Occupancy 5%
Net profits after Tax 3-6% 18.90%

Canada U.S. Gulf Eur Total
Stores 3,588 859 38 61 4,546
Percent of total
78.9% 18.9% 0.8% 1.3% 100.0%
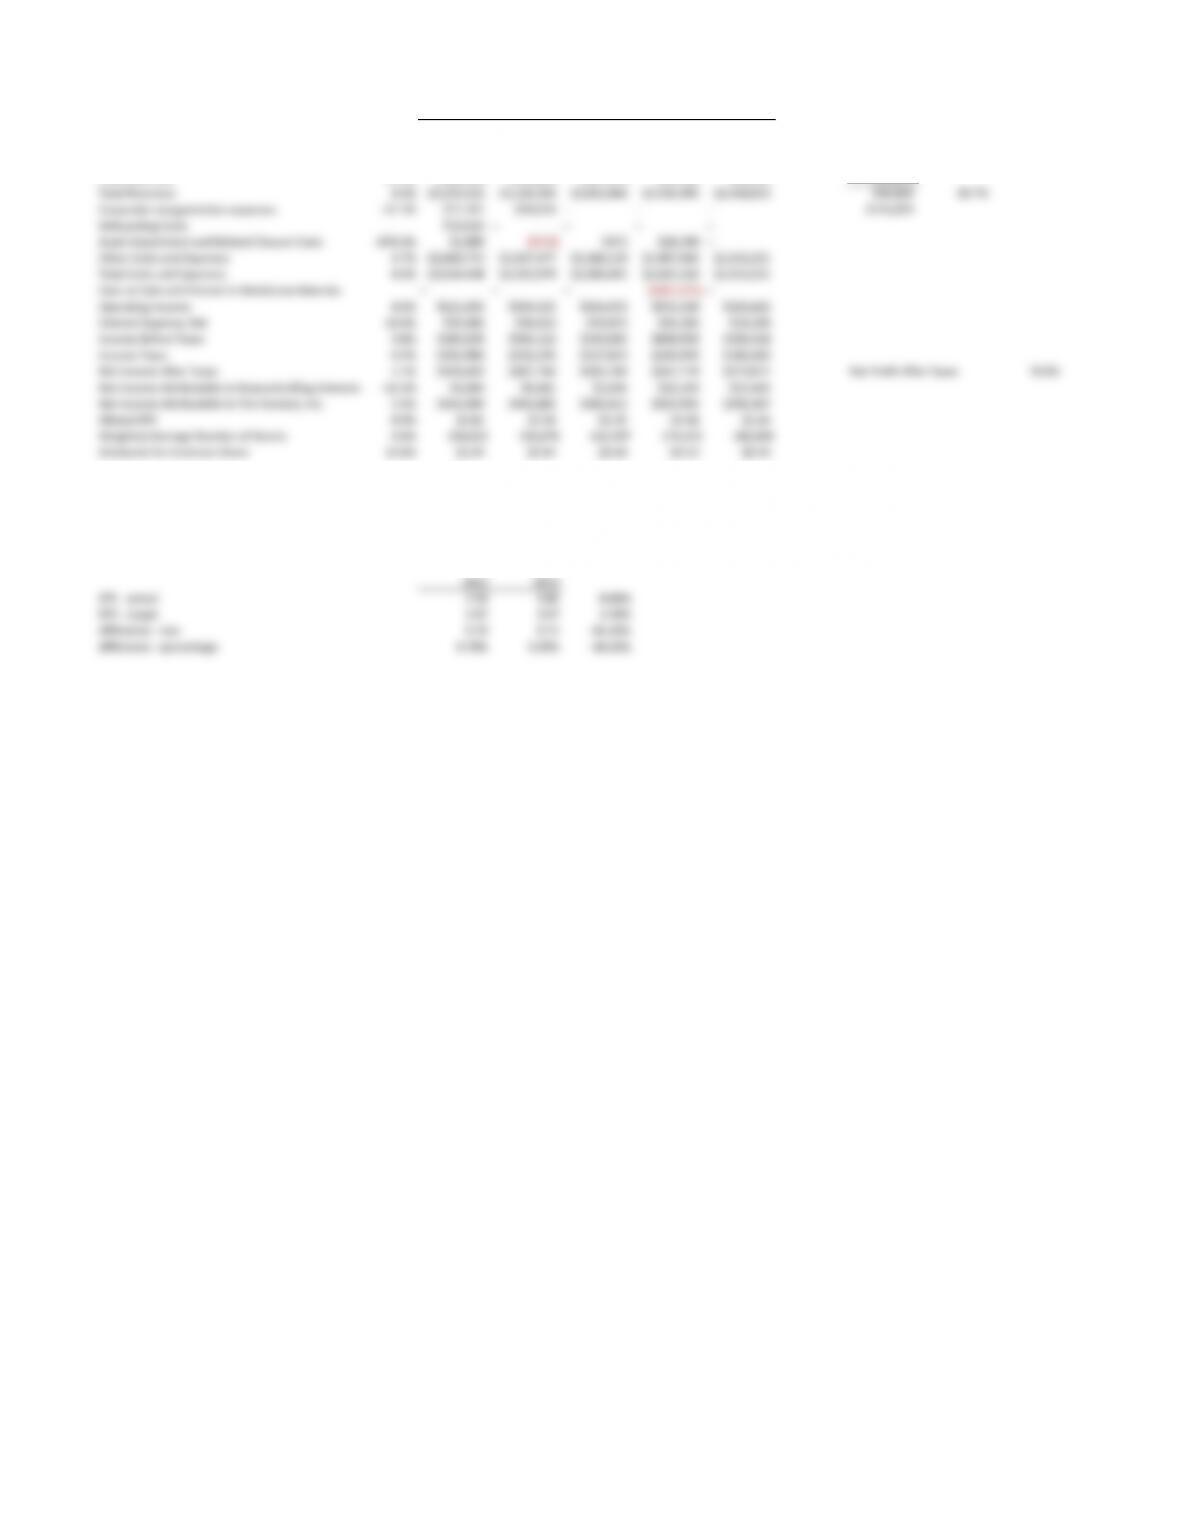
Fiscal Years 2013 2012 2011 2010 2009
Sales 1.8% $2,265,884 $2,225,659 $2,012,170 $1,755,244 $1,704,065 $40,225
Franchise revenues:
Rents & Royalties 5.2% $821,221 $780,992 $733,217 $687,039 $644,755 $40,229
Franchise Fees 47.9% $168,428 $113,853 $107,579 $94,212 $90,033 $54,575
Total Revenues 4.3% $3,255,533 $3,120,504 $2,852,966 $2,536,495 $2,438,853 $94,804 28.7%
Corporate reorganization expenses -37.7% $11,761 $18,874 – – – $135,029
Debranding Costs $19,016 – – – –
Asset Impairment and Related Closure Costs -876.6% $2,889 ($372) $372 $28,298 –
Other Costs and Expenses 3.7% $2,600,772 $2,507,477 $2,283,119 $1,997,034 $1,913,251
Total Costs and Expenses 4.3% $2,634,438 $2,525,979 $2,283,491 $2,025,332 $1,913,251
Gain on Sale and Interest in Maidstone Bakeries – – – ($361,075) –
Operating Income 4.5% $621,095 $594,525 $569,475 $872,238 $525,602
Interest Expense, Net 16.6% $35,466 $30,413 $25,873 $24,180 $19,184
Income Before Taxes 3.8% $585,629 $564,112 $543,602 $848,058 $506,418
Income Taxes 0.4% $156,980 $156,346 $157,854 $200,940 $186,606
Net Income After Taxes 5.1% $428,649 $407,766 $385,748 $647,118 $319,812 Net Profit After Taxes 18.9%
Net Income Attributable to Noncontrolling Interests -12.3% $4,280 $4,881 $2,936 $23,159 $23,445
Net Income Attributable to Tim Hortons, Inc. 5.3% $424,369 $402,885 $382,812 $623,959 $296,367
Diluted EPS 8.9% $2.82 $2.59 $2.35 $3.58 $1.64
Weighted Average Number of Shares 0.0% 150,622 150,676 162,597 174,215 180,609
Dividends Per Common Share 23.8% $1.04 $0.84 $0.68 $0.52 $0.40
18.92%
2012 2013
EPS – actual 2.59 2.82 8.88%
EPS – target 2.87 2.97 3.48%
difference – raw 0.28 0.15 -46.43%
difference – percentage 9.76% 5.05% –48.23%

Company
Global
Revenues 2013
Number
of
Locations
Total
Number
of
Locations
U.S.
Number
of
Locations
Canada
Franchise
Percentage
Tim Hortons Cdn$3.3 4,546 859 3,588 100%
McDonald’s US$29.1 billion 35,429 14,278 1,400 80%
Starbucks US$14.9 billion 23,305 13,049 1,555 40%
Dunkin’ Donuts US$7.4 10,083 7,015 4 70%
Tim Hortons McDonald’s Starbucks
Coffee (Medium) $1.52 $1.54 $1.85
Latte (Medium) $2.69 $2.99 $3.45
Muffin $1.29 $1.19 $2.00
Breakfast Sandwich $2.99 $3.19 $3.95