
Siemens: Management Innovation at the Corporate Level
1
Siemens
INTRODUCTION
Siemens is a leading global electrical engineering and electronics firm
headquartered in Munich, Germany. Profiling a highly diversified company, this case
addresses the issue of optimizing the business portfolio through a coherent corporate
strategy. An in-depth look at the programs designed and implemented at Siemens to spur
management innovation provides a unique opportunity to study an organization’s efforts
to facilitate the transfer corporate-level core competencies across business divisions in
order to strengthen competitive position and performance.
The case opens with an introduction and a profile of the company. Management
innovation activity at Siemens is then thoroughly reviewed, including the context,
evolution, purpose, content, implementation, capability development, and performance
measurement of the company’s top+ program.
This case study demonstrates how the principles of strategic management apply to
Siemens’ structured and systematic approach to management innovation and business
excellence. It also provides a framework for assessing the effectiveness of the company’s
corporate management tools and programs.
• Describe Siemens’ corporate-level strategy and characterize its level of
diversification. Discuss the advantages and disadvantages of the company’s
matrix organizational structure. Does the organizational design effectively support
the needs of Siemens’ corporate-level strategy?
• Describe how the company structured the top+ program. Who was responsible for
oversight and coordination of the business excellence initiatives? How does the
management innovation activity at Siemen’s facilitate achievement of the
company’s corporate objectives?
• Using a balanced scorecard framework, outline the financial and strategic
organizational controls used by Siemens to drive management behavior and firm
performance. Are the corporate criteria balanced? Are they yielding desired
outcomes for the company?
• Conduct a financial analysis using Siemens’ financial performance results from
1998 to 2007 to assess the effectiveness or success of the top+ program. What
recommendations would you make to improve either the design or
implementation of the company’s management innovation efforts?
Siemens: Management Innovation at the Corporate Level
2
Siemens
STRATEGY
• Describe Siemens’ corporate-level strategy and characterize its level of
diversification. Discuss the advantages and disadvantages of the company’s matrix
organizational structure. Does the organization’s design effectively support the
needs of Siemens’ corporate-level strategy?
A corporate-level strategy specifies the actions firms take to gain competitive
advantages through their selection and management of different business groups that
compete in different product markets. Siemens is a diversified company with an
extensive portfolio of businesses that have only a few links between them. The electrical
engineering giant’s particular mix and range of related and unrelated business units
employs a highly-diversified related linked corporate-level strategy.
As a firm’s level of diversification increases, information processing,
coordination, and control problems emerge that functional organizational structures
cannot handle. Large firms like Siemens, with few or less constrained links among their
divisions, use the strategic business unit (SBU) form of a multidivisional structure to
support implementation of their related linked diversification strategies. The SBU form of
the multidivisional structure consists of three levels: corporate headquarters, strategic
business units (SBUs), and SBU divisions (refer to Figure 11.6 in the text and Exhibit 2
in the case). The SBU structure can be complex, given the organization’s size and degree
of product and market diversity.
Siemens: Management Innovation at the Corporate Level
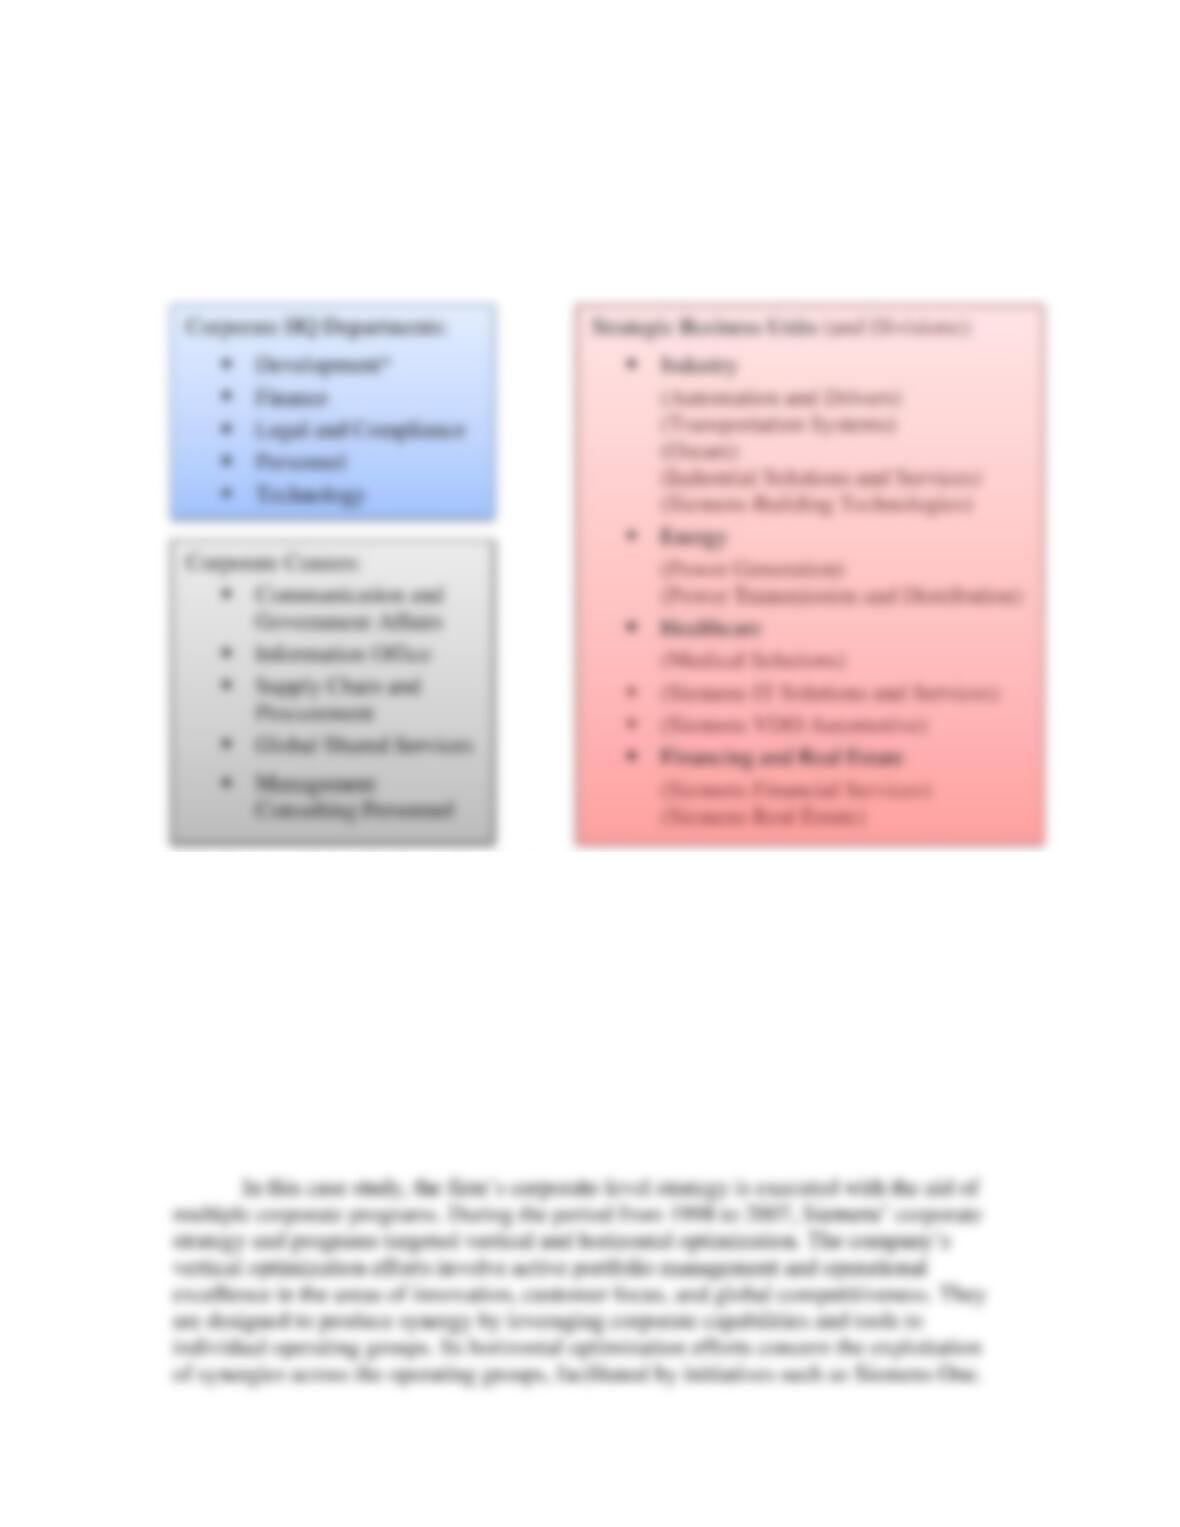
The entities within Siemens’ corporate headquarter, SBU, and division levels are
outlined and presented in the following boxes. The corporate structure also includes a
managing board (corporate executive committee) and the services of five corporate
centers (which are also detailed below).
*The Siemens One unit is located in this department.
The divisions within each SBU are related in terms of shared products or markets
(or both), but the divisions of one SBU probably have little in common with the divisions
of the other SBUs. Divisions within each SBU can share product or market competencies
to develop economies of scope and possibly economies of scale. In this structure, each
SBU is a profit center that is controlled and evaluated by the headquarters office. Sharing
competencies among divisions within individual SBUs is an important characteristic of
the SBU form of the multidivisional structure. Integrating mechanisms used by divisions
in this structure can also be applied to the other divisions within the individual strategic
business units.
Siemens: Management Innovation at the Corporate Level
4
Siemens
• Describe how the company structured its top+ program. Who was responsible for
oversight and coordination of the business excellence initiatives? How does the
management innovation activity at Siemens facilitate achievement of the
company’s corporate objectives?
In 2007, top+ was coordinated in the corporate center by a team of seven people
(excluding the customer focus program, Siemens One). The team head is responsible for
corporate-wide top+ efforts and reports directly to a member of the managing board who
monitors progress of the program. The role of this team is to manage the top+ initiatives
of the different SBUs (including eleven mandatory initiatives), to further develop the
overall program and individual initiatives, and to monitor the progress of implementation
at the SBU level. Each of the three pillars of top+ – innovation, customer focus, and
global competitiveness – is overseen and coordinated by one person.
Siemens: Management Innovation at the Corporate Level
5
Siemens
The purpose of the top+ program is to optimize Siemens’ business portfolio in a
way that continually and substantially adds to shareholder value through a coherent and
powerful corporate strategy. In other words, the overarching objective of top+ is to
maximize the economic value added (EVA) of the integrated technology company.
ANALYSIS
• Using a balanced scorecard framework, outline the financial and strategic
organizational controls used by Siemens to drive management behavior and firm
performance. Are the corporate criteria balanced? Are they yielding desired
outcomes for the company?
The top+ program is managed at the corporate level, which requires regular
reporting of measurable results to the managing board. With clear goals, concrete
measures, and rigorous consequences, Siemens continually monitors the effectiveness of
its top+ activities.
Siemens: Management Innovation at the Corporate Level
In contrast, strategic control focuses on the content of strategic actions rather than
their outcomes. They encourage lower-level managers to make decisions that incorporate
moderate and acceptable levels of risk because leaders and managers throughout the firm
share the responsibility for the outcomes of those decisions and the actions that result.
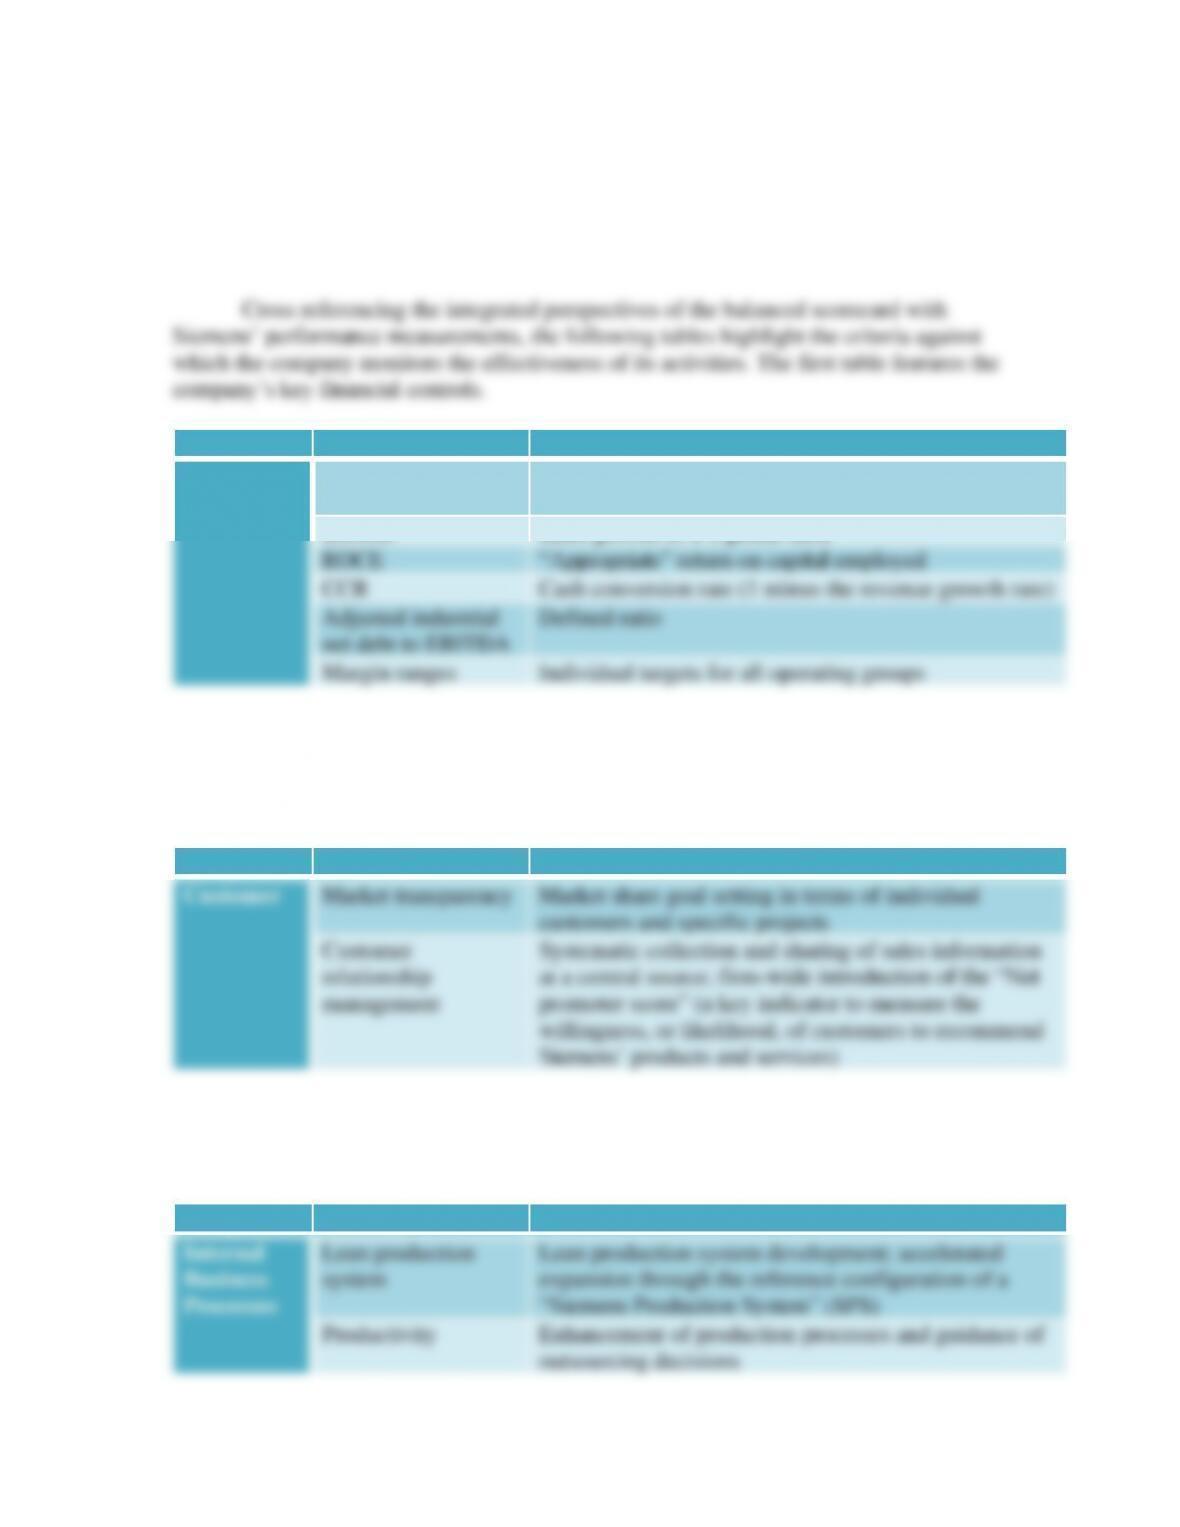
Perspective
Criteria
Financial
EVA
Net operating profit after taxes (NOPAT) less a charge
for capital employed in the business (cost of capital).
Growth
Sales growth of 2 x global GDP
ROCE
“Appropriate” return on capital employed
CCR
Cash conversion rate (1 minus the revenue growth rate)
Adjusted industrial
net debt to EBITDA
Defined ratio
Margin ranges
Individual targets for all operating groups
Financial metrics of importance to Siemens are concerned with growth,
profitability, cash flow, returns, and shareholder value. Alternatively, Siemens’ strategic
controls are structured around the three pillars of innovation, customer focus, and global
competitiveness. They are outlined in each of the three tables below.
Perspective
Criteria
Customer
Market transparency
Market share goal setting in terms of individual
customers and specific projects
Customer
relationship
management
Systematic collection and sharing of sales information
at a central source; firm-wide introduction of the “Net
promoter score” (a key indicator to measure the
willingness, or likelihood, of customers to recommend
Siemens’ products and services)
Siemens’ customer-focused strategic criteria emphasize the depth and quality of
the company’s relationships with its customers. The company thoughtfully aligns its
development, production, and administration processes to customer needs.
Perspective
Criteria
Internal
Business
Processes
Lean production
system
Lean production system development; accelerated
expansion through the reference configuration of a
“Siemens Production System” (SPS)
Productivity
Enhancement of production processes and guidance of
outsourcing decisions
Siemens: Management Innovation at the Corporate Level
Concerned with global competitiveness and shareholder satisfaction, Siemens’
internal business process measurements focus on efficiencies throughout the value chain.
Monitoring of internal business processes has inspired the reorganization of production
capacity for world-wide operations.
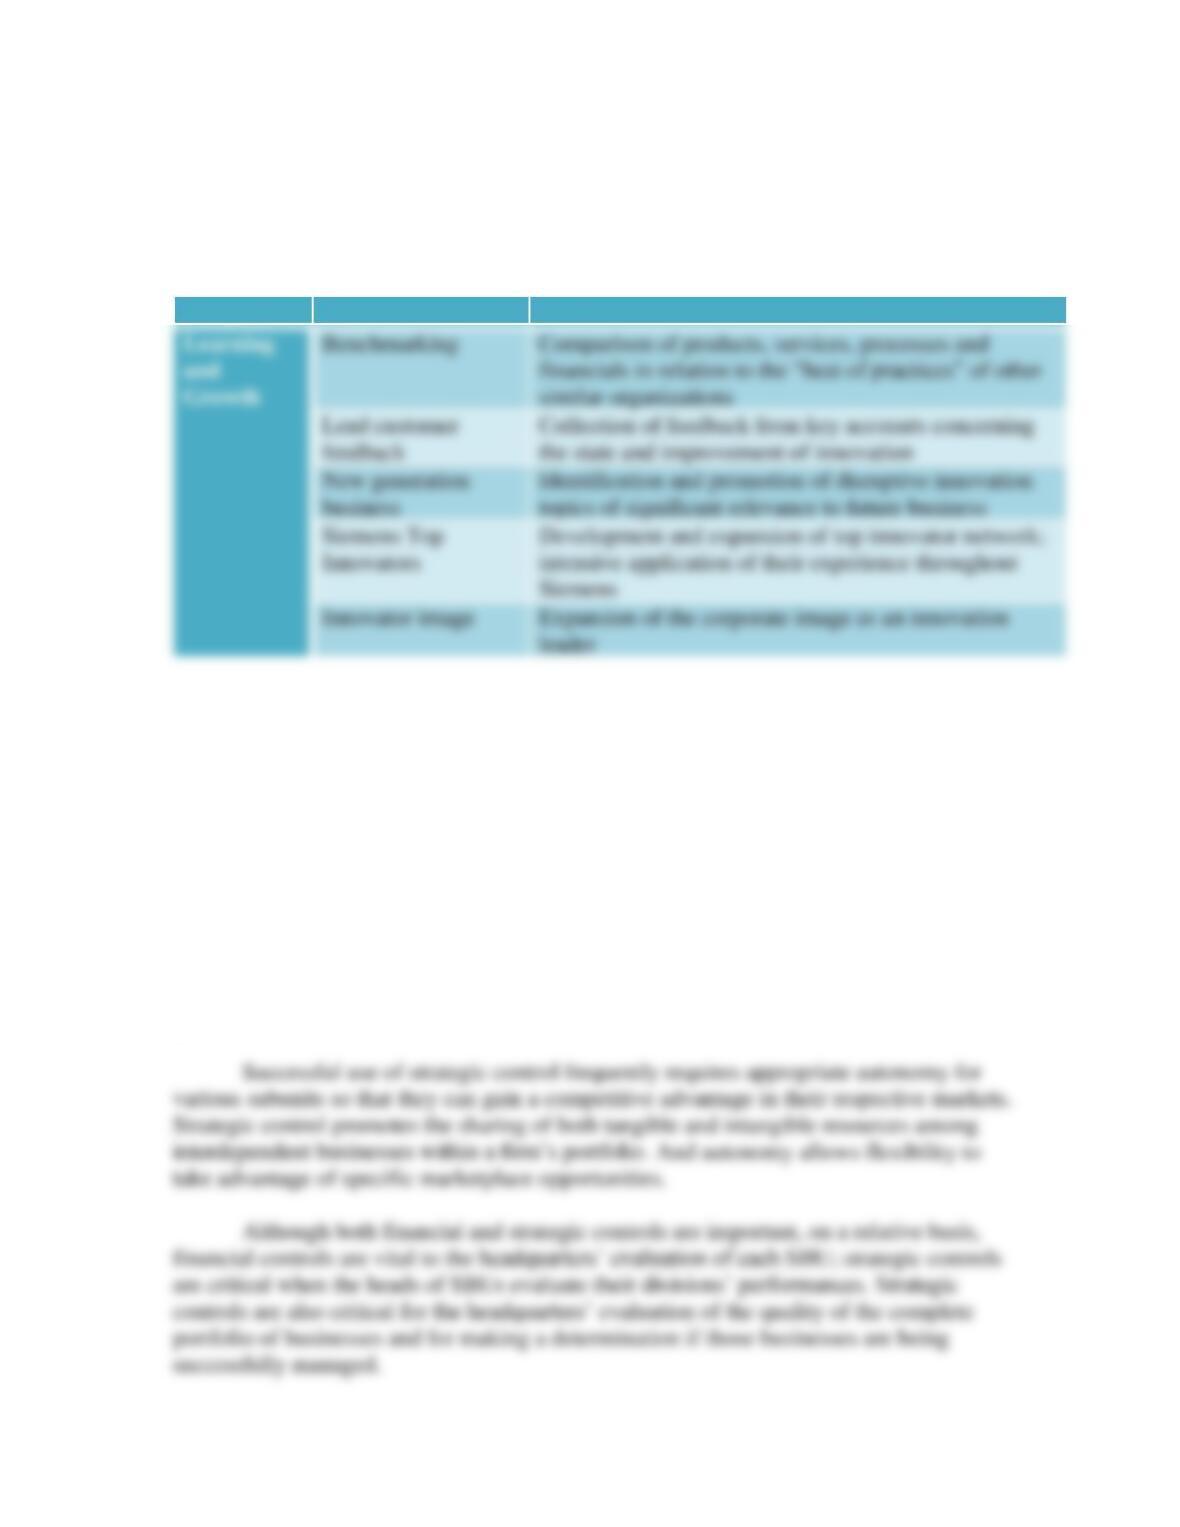
Perspective
Criteria
Learning
and
Growth
Benchmarking
Comparison of products, services, processes and
financials in relation to the “best of practices” of other
similar organizations
Lead customer
feedback
Collection of feedback from key accounts concerning
the state and improvement of innovation
New generation
business
Identification and promotion of disruptive innovation
topics of significant relevance to future business
Siemens Top
Innovators
Development and expansion of top innovator network;
intensive application of their experience throughout
Siemens
Innovator image
Expansion of the corporate image as an innovation
leader
Its learning and growth criteria focus on the firm’s efforts to create an
organizational climate that supports knowledge-sharing, innovation, and growth. Clearly
the top+ program at Siemens heavily influences the control measurements of these less
tangible aspects of the company’s performance.
Research shows that decisions balancing short-term goals with long-term goals
generally lead to higher performance. An appropriate balance of strategic controls and
financial controls, rather than an overemphasis on either, allows firms to achieve higher
levels of performance. Thus, using the balanced scorecard can help the firm understand
how it satisfies shareholders (financial perspective), meets customer needs (customer
perspective), shapes processes to make full use of its competitive advantages (internal
perspective), and identifies ways to improve performance in order to grow (learning and
growth perspective).
Siemens: Management Innovation at the Corporate Level
8
Siemens
• Conduct a financial analysis using Siemens’ financial performance results from
1998 to 2007 to assess the effectiveness or success of the top+ program. What
recommendations would you make to improve either the design or implementation
of the company’s management innovation efforts?
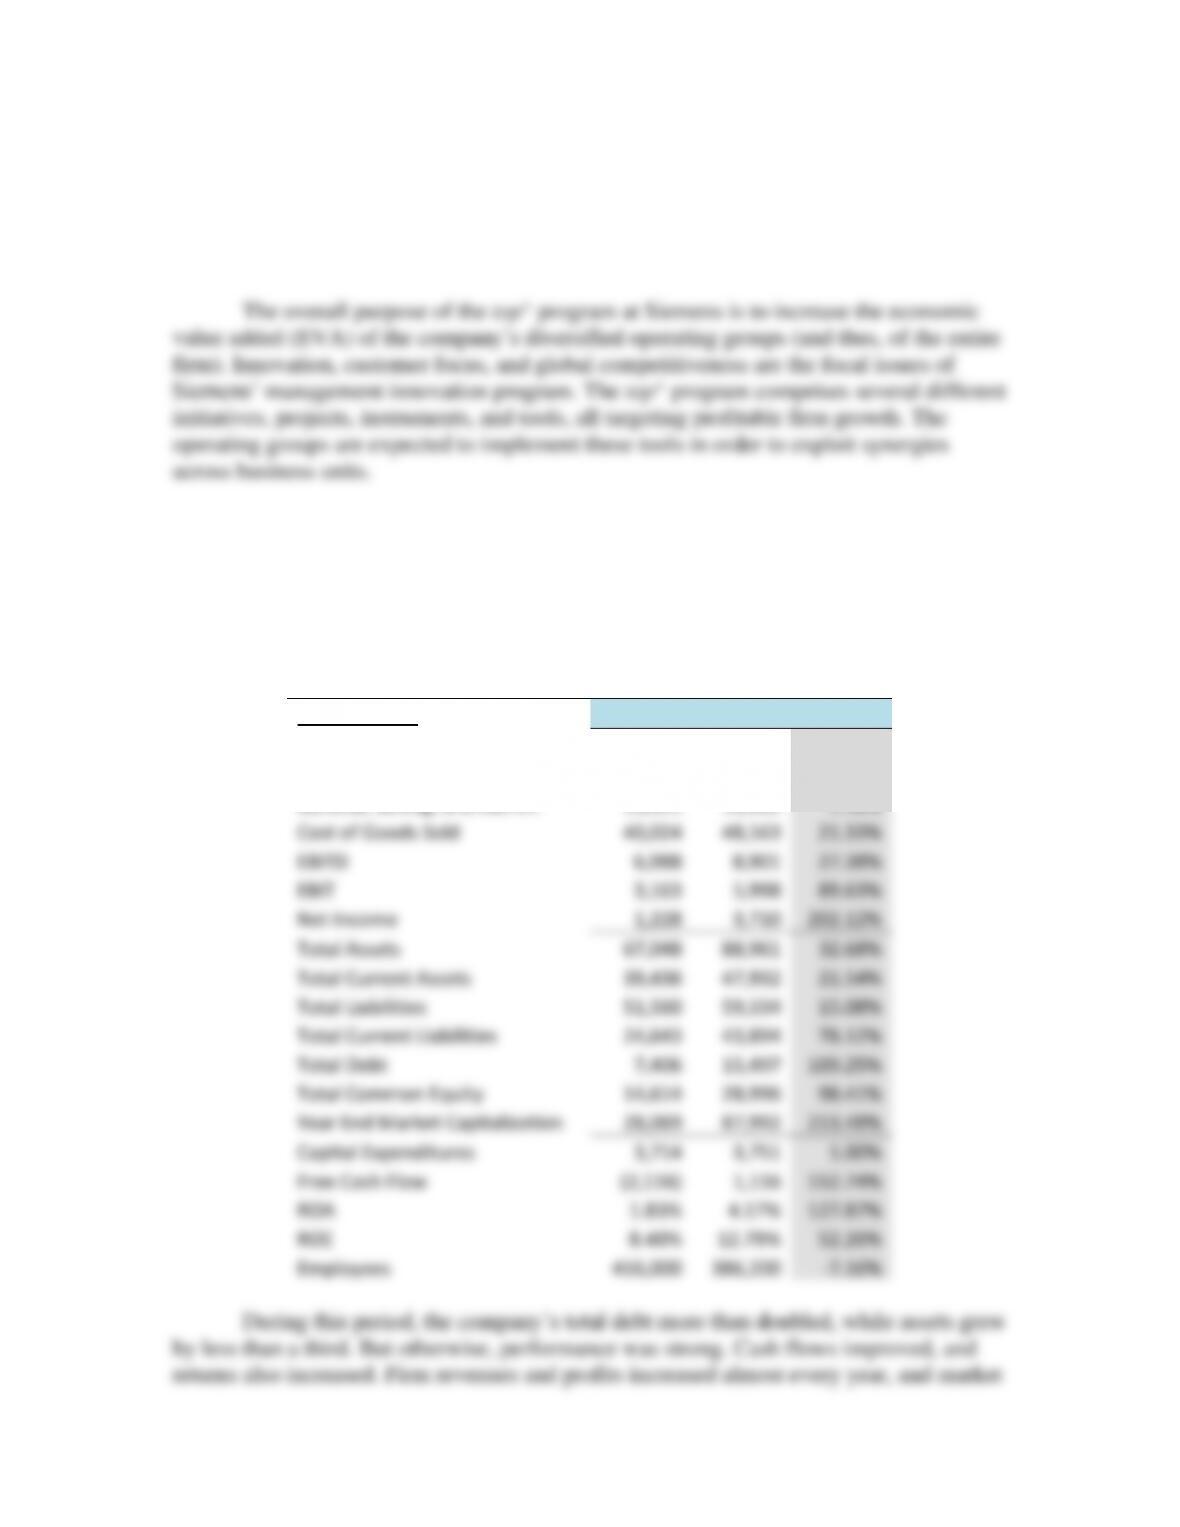
Overall, the leaders of Siemens consider the performance impact of top+ to be
significant. From 1998 to 2007, the corporation increased sales by over 20%, earnings
nearly 90%, and net income over 200% (due to highly controlled operating and GSA
expenses). Market capitalization went up an impressive 214% (refer to Exhibit 8 in the
case or the table below).
1998 to 2007
Ten-Year Period
In EUR million
Y1998
Y2007
% Chg.
Sales
60,177
72,448
20.39%
Total Operating Expenses
59,365
67,827
14.25%
General, Selling, and Admin.
15,321
15,502
1.18%
Cost of Goods Sold
40,024
48,563
21.33%
EBITD
6,988
8,901
27.38%
EBIT
3,163
5,998
89.63%
Net Income
1,228
3,710
202.12%
Total Assets
67,048
88,961
32.68%
Total Current Assets
39,436
47,932
21.54%
Total Liabilities
51,560
59,334
15.08%
Total Current Liabilities
24,643
43,894
78.12%
Total Debt
7,406
15,497
109.25%
Total Common Equity
14,614
28,996
98.41%
Year End Market Capitalization
28,069
87,992
213.48%
Capital Expenditures
3,714
3,751
1.00%
Free Cash Flow
(2,116)
1,116
152.74%
ROA
1.83%
4.17%
127.87%
ROE
8.40%
12.79%
52.26%
Employees
416,000
386,200
-7.16%
During this period, the company’s total debt more than doubled, while assets grew
by less than a third. But otherwise, performance was strong. Cash flows improved, and
returns also increased. Firm revenues and profits increased almost every year, and market
Siemens: Management Innovation at the Corporate Level
9
Siemens
capitalization grew dramatically over the 10-year period (the value of the company rose
from 28 billion EUR to nearly 88 billion EUR). However, it is unclear if this is the result
of management innovation or portfolio management. Analysis of results as the program
evolved may provide more insights to enable a better assessment of the program’s
success.
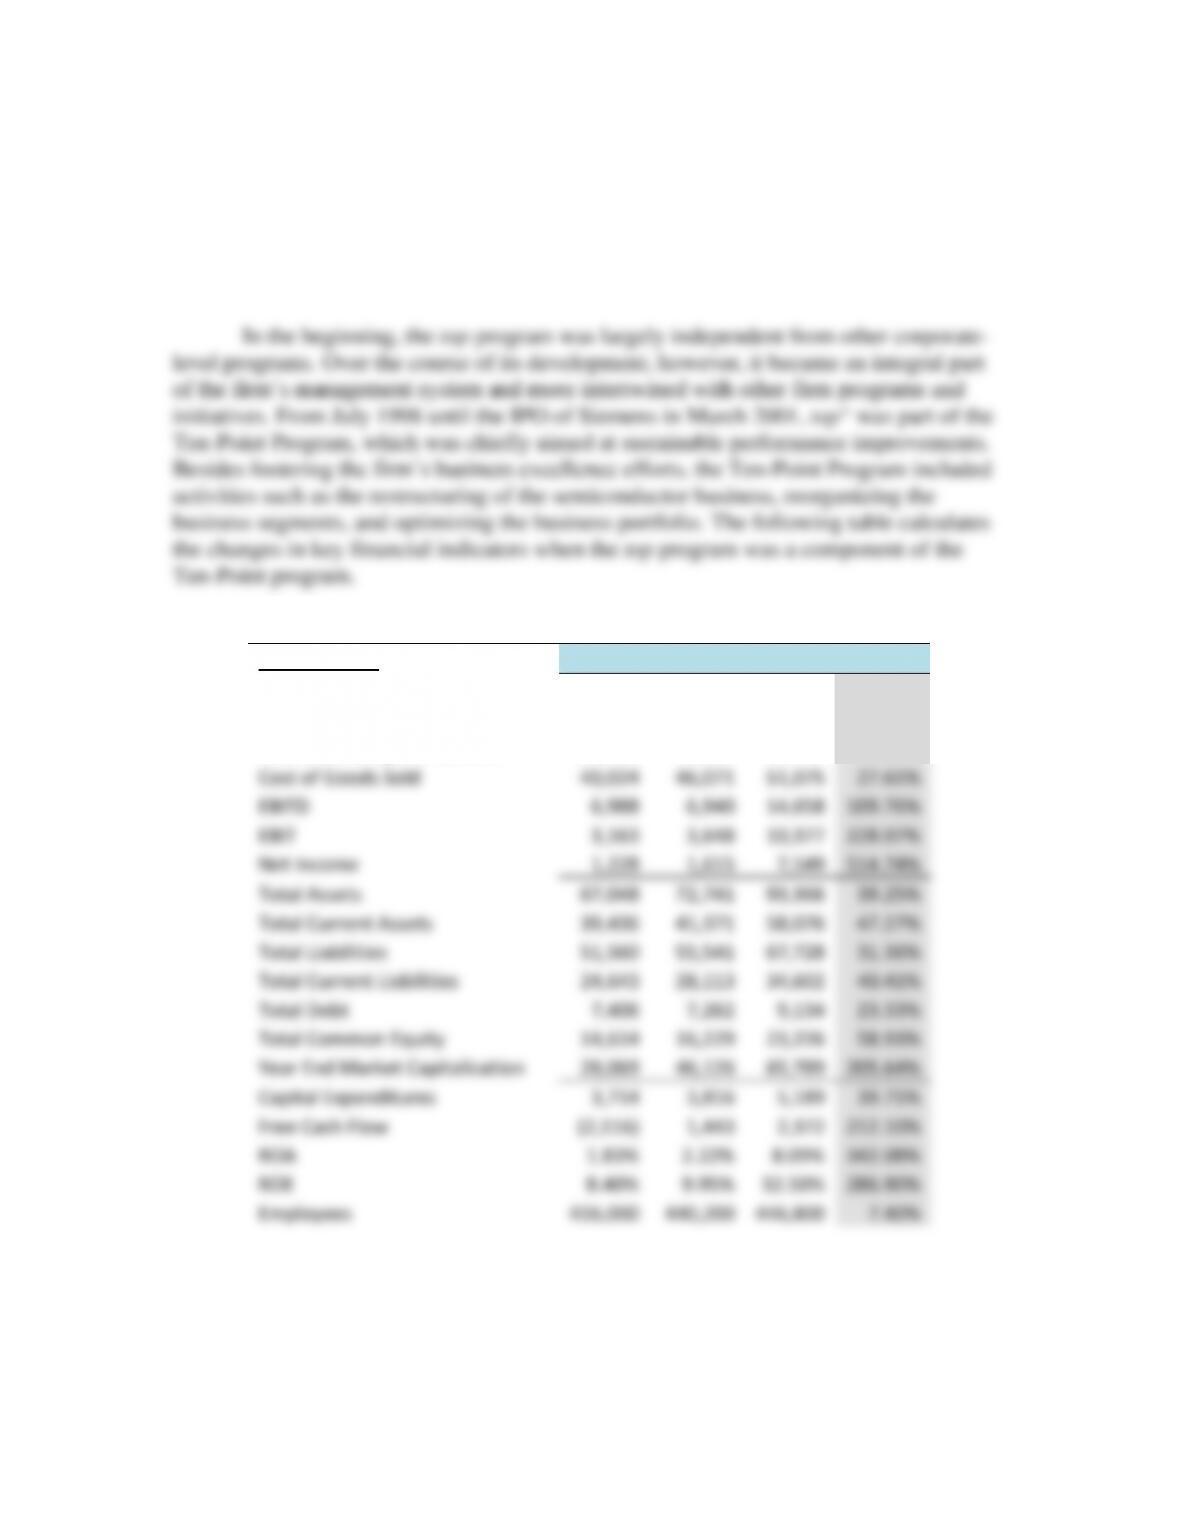
1998 – 2000
Ten-Point Program
In EUR million
Y1998
Y1999
Y2000
% Chg.
Sales
60,177
68,582
78,396
30.28%
Total Operating Expenses
59,365
67,964
74,855
26.09%
General, Selling, and Admin.
15,321
17,663
19,354
26.32%
Cost of Goods Sold
40,024
46,071
51,075
27.61%
EBITD
6,988
6,940
14,658
109.76%
EBIT
3,163
3,648
10,377
228.07%
Net Income
1,228
1,615
7,549
514.74%
Total Assets
67,048
72,741
93,366
39.25%
Total Current Assets
39,436
41,371
58,076
47.27%
Total Liabilities
51,560
55,541
67,728
31.36%
Total Current Liabilities
24,643
28,113
34,602
40.41%
Total Debt
7,406
7,262
9,134
23.33%
Total Common Equity
14,614
16,229
23,226
58.93%
Year End Market Capitalization
28,069
46,126
85,789
205.64%
Capital Expenditures
3,714
3,816
5,189
39.71%
Free Cash Flow
(2,116)
1,443
2,372
212.10%
ROA
1.83%
2.22%
8.09%
342.08%
ROE
8.40%
9.95%
32.50%
286.90%
Employees
416,000
440,200
446,800
7.40%
During this period, sales were strong, expenses remained steady, and earnings
performed extremely well (EBIT grew 228%). Net income made a remarkable jump in
the year 2000 – a 515% increase over 1998 levels. It is also notable that market
capitalization, free cash flow, and returns more than doubled during these three years.
And returns on assets grew 342%.
Siemens: Management Innovation at the Corporate Level
10
Siemens
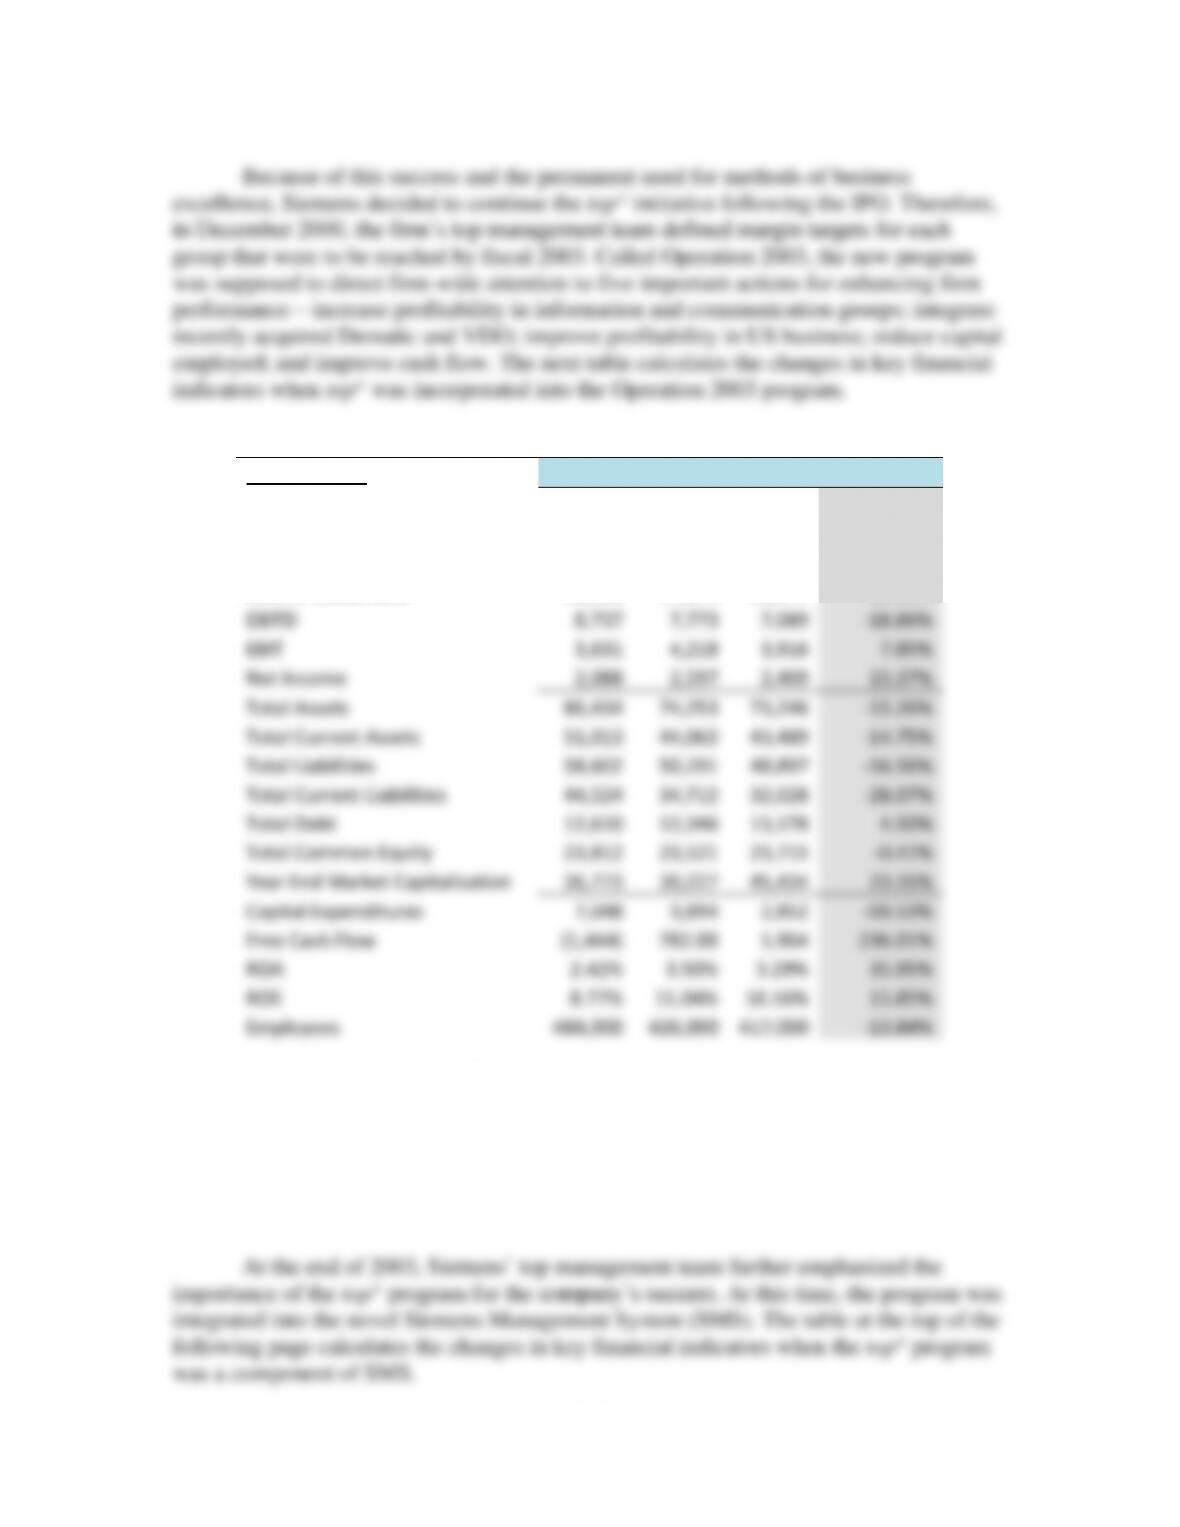
2001 – 2003
Operation 2003
In EUR million
Y2001
Y2002
Y2003
% Chg.
Sales
87,000
84,016
74,233
-14.67%
Total Operating Expenses
88,662
82,702
71,951
-18.85%
General, Selling, and Admin.
23,422
21,274
18,601
-20.58%
Cost of Goods Sold
60,011
57,873
50,177
-16.39%
EBITD
8,737
7,773
7,089
-18.86%
EBIT
3,631
4,218
3,916
7.85%
Net Income
2,088
2,597
2,409
15.37%
Total Assets
86,434
74,253
73,246
-15.26%
Total Current Assets
51,013
44,062
43,489
-14.75%
Total Liabilities
58,602
50,191
48,897
-16.56%
Total Current Liabilities
44,524
34,712
32,028
-28.07%
Total Debt
12,610
12,346
13,178
4.50%
Total Common Equity
23,812
23,521
23,715
-0.41%
Year End Market Capitalization
36,773
30,227
45,434
23.55%
Capital Expenditures
7,048
3,894
2,852
-59.53%
Free Cash Flow
(1,444)
782.00
1,964
236.01%
ROA
2.42%
3.50%
3.29%
35.95%
ROE
8.77%
11.04%
10.16%
15.85%
Employees
484,000
426,000
417,000
-13.84%
The SBU data is not available in the case, but Operation 2003’s asset management
focus on capital and cash flow achieved desired results for the corporation. Returns and
market capitalization were also positive, and cost reductions ranged from 16.4% to 20.6%
over the three-year period. However, sales fell from 2001 to 2003 by a total of 14.7%.
With little to base this on, one speculation can be that the intense attention on operational
performance detracted firm efforts from sales growth.
Siemens: Management Innovation at the Corporate Level
11
Siemens
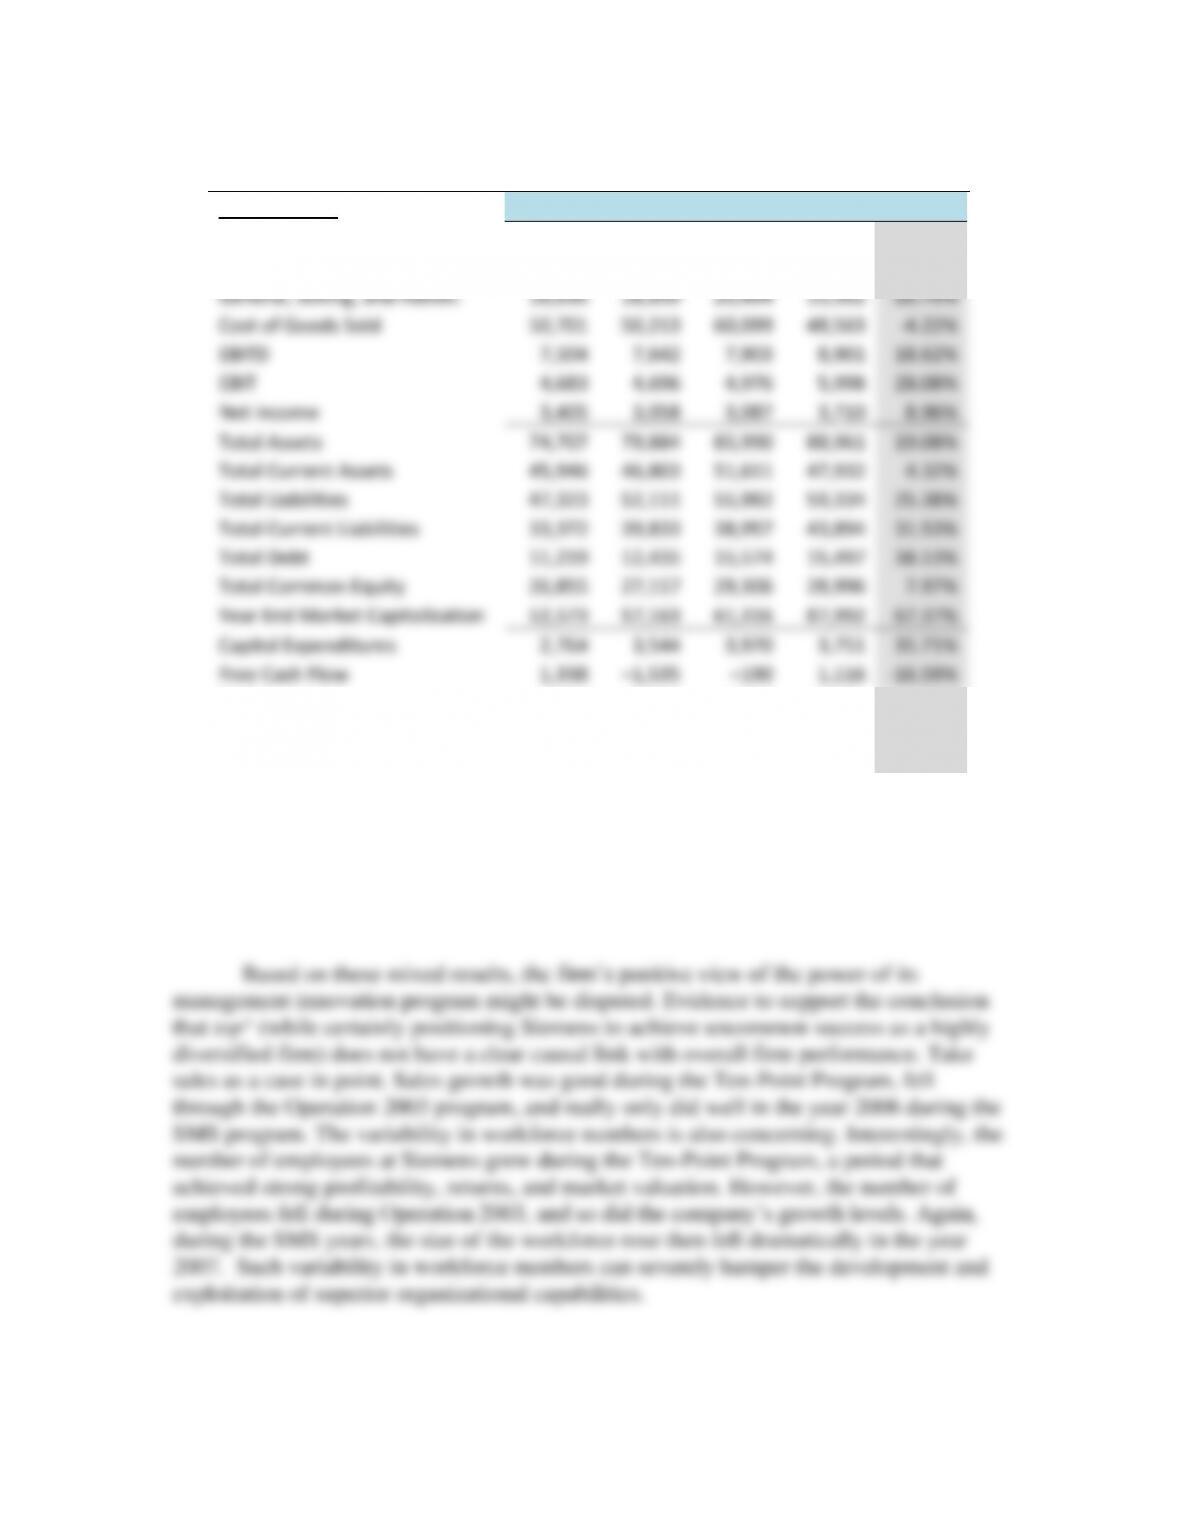
2004 – 2007
SMS
In EUR million
Y2004
Y2005
Y2006
Y2007
% Chg.
Sales
75,167
75,445
87,325
72,448
-3.62%
Total Operating Expenses
72,152
71,998
83,520
67,827
-5.99%
General, Selling, and Admin.
18,630
18,839
20,494
15,502
-16.79%
Cost of Goods Sold
50,701
50,213
60,099
48,563
-4.22%
EBITD
7,504
7,642
7,903
8,901
18.62%
EBIT
4,683
4,696
4,976
5,998
28.08%
Net Income
3,405
3,058
3,087
3,710
8.96%
Total Assets
74,707
79,884
85,990
88,961
19.08%
Total Current Assets
45,946
46,803
51,611
47,932
4.32%
Total Liabilities
47,323
52,111
55,982
59,334
25.38%
Total Current Liabilities
33,372
39,833
38,957
43,894
31.53%
Total Debt
11,219
12,435
15,574
15,497
38.13%
Total Common Equity
26,855
27,117
29,306
28,996
7.97%
Year End Market Capitalization
52,573
57,163
61,316
87,992
67.37%
Capital Expenditures
2,764
3,544
3,970
3,751
35.71%
Free Cash Flow
1,338
−1,535
−190
1,116
-16.59%
ROA
4.56%
3.83%
3.59%
4.17%
-8.55%
ROE
12.68%
11.28%
10.53%
12.79%
0.87%
Employees
430,000
460,800
475,000
386,200
-10.19%
During this four-year period, earnings rose 28%, and net income went up slightly.
Market capitalization increased an impressive 67%, but much of that growth occurred
during the final year of the program. Total assets grew 19%, but total liabilities went up
over 25%. Capital expenditures were again on the rise to 1998 levels; total debt rose 38%;
and both cash flow and returns suffered.
Appropriately designed organizational structures provide the stability a firm needs
to successfully implement its strategies and maintain competitive advantages while
Siemens: Management Innovation at the Corporate Level
12
Siemens