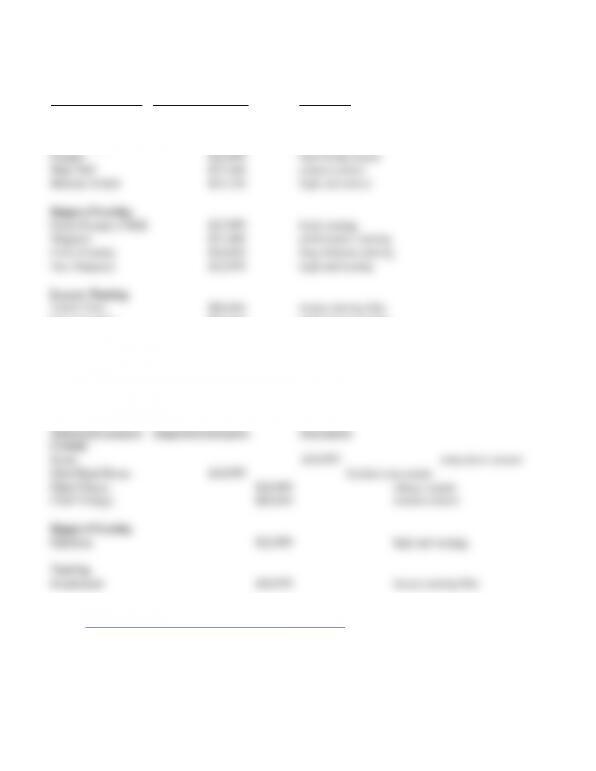
Exhibit 3
Victory Motorcycle Models
Motorcycle category Suggested retail price Description
Cruisers
Vegas 8-Ball $12,499 basic cruiser
Gunner $12,999 throwback cruiser
High-Ball $13,349 custom cruiser
Hammer 8-Ball $14,499 high end cruiser
Baggers/Touring
Cross Country 8-Ball $17,999 basic touring
Magnum $21,999
performance touring
Cross Country $18,999 long distance touring
Ness Magnum $22,999 high end touring
Scout $10,999 entry-level cruiser
Chief Dark Horse $16,999 blacked-out crusier
Chief Classic $18,999 classic cruiser
Chief Vintage $20,999 custom cruiser
Baggers/Touring
Chieftain $22,999 high end touring
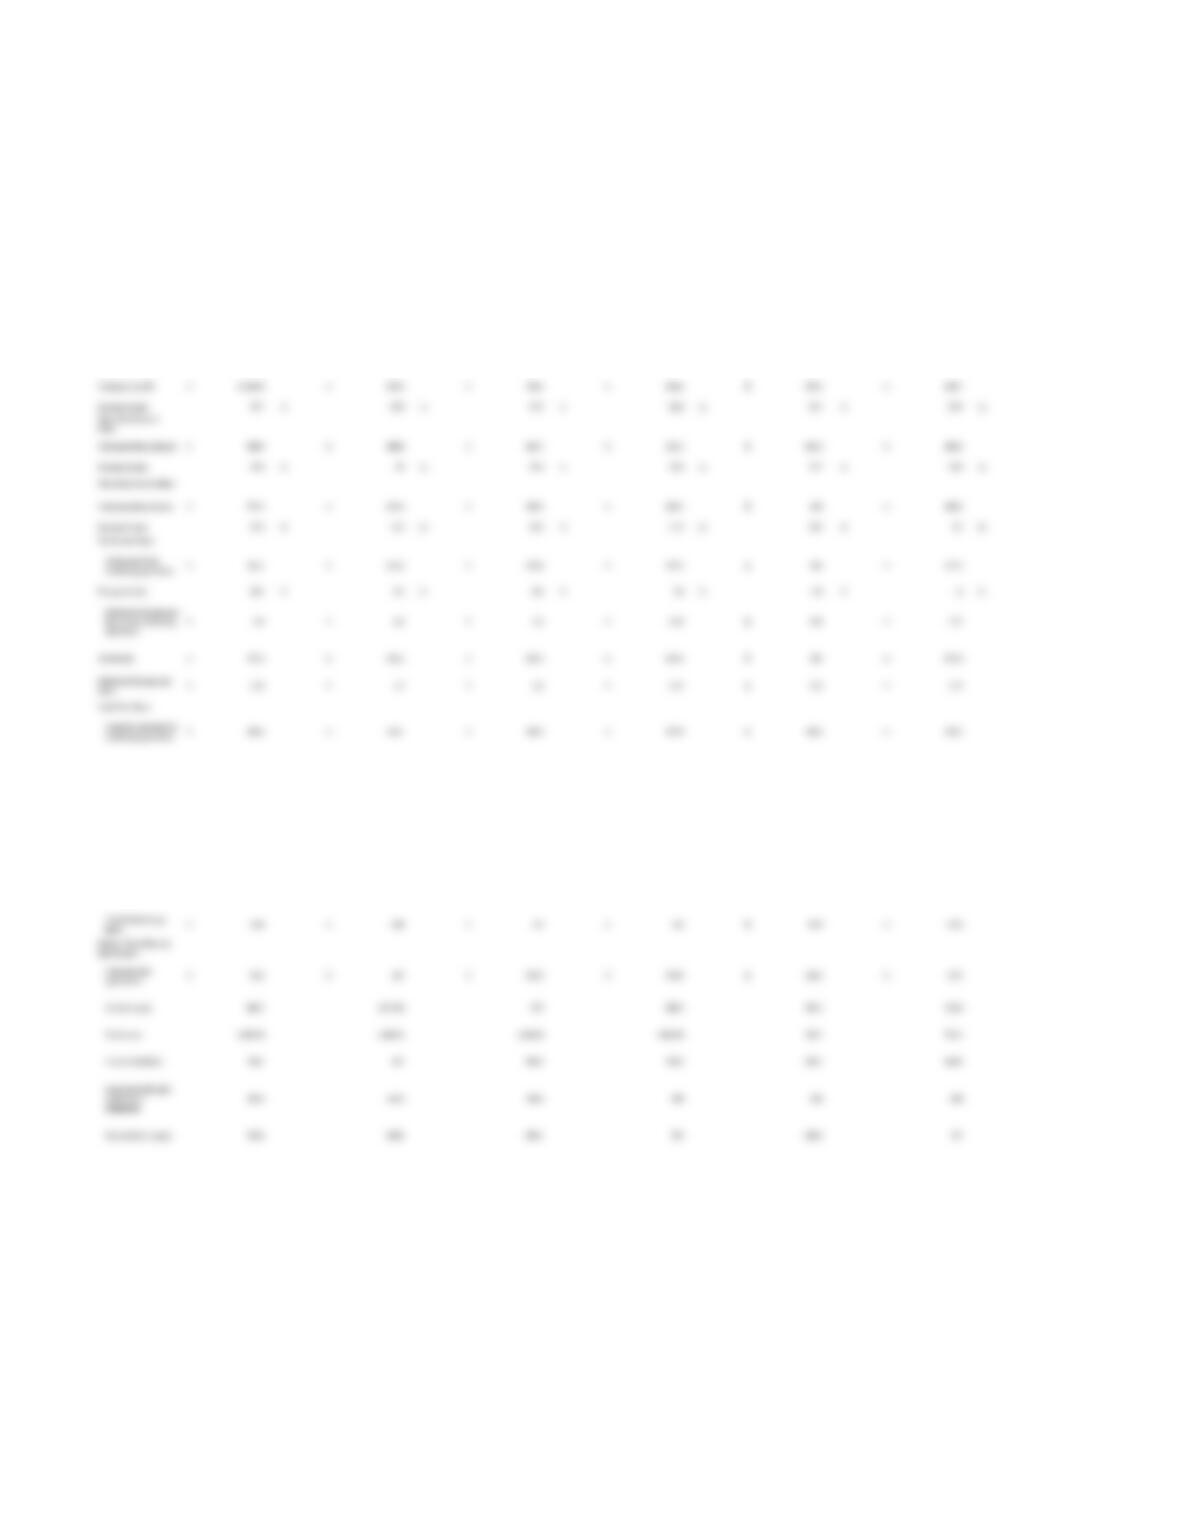
(Dollars in millions,
except per-share data)
Statement of Operations
Data
Sales Data:
Percent change from
prior year
% % % % % %
Sales mix by product:
Off-Road Vehicles % % % % % %
Snowmobiles % % % % % %
Motorcycles % % % % % %
Small Vehicles % % % % % %
Parts, Garments
and Accessories
% % % % % %
Gross Profit Data:
Percent of sales % % % % % %
Operating Expense
Data:
Percent of sales % % % % % %
Operating Income Data:
Percent of sales % % % % % %
Net Income Data:
Percent of sales % % % % % %
Cash Flow Data:
Balance Sheet Data (at
end of year):
For the Years Ended December 31,
2013
2012
2011
2010
2009
2008
$
1,991.10
Total sales
$
3,777.10
$
3,209.80
18
21
33
27
-20
9
$
1,565.90
$
1,948.30
$
2,656.90
8
9
11
10
12
10
67
69
69
69
65
67
3
2
—
—
—
—
6
6
5
4
3
5
16
14
15
17
20
18
Total gross profit
$
1,120.90
$
925.3
29.7
28.8
27.9
26.6
25.1
22.9
$
393.2
$
445.7
$
740.6
$
530.2
Total operating expenses
$
588.9
$
480.8
15.6
15
15.6
16.4
15.7
14.6
$
245.3
$
284.1
$
414.7
$
326.3
Total operating income
$
577.9
$
478.4
15.3
14.9
13.2
11.1
10.5
9.4
$
165
$
182.8
$
349.9
$
220.7
Net income from
continuing operations
$
381.1
$
312.3
5.4
$
4.4
10.1
9.7
8.6
7.4
6.5
6
$
101
$
117.4
$
227.6
$
147.1
Net income
$
377.3
$
312.3
$
$
1.53
$
1.75
$
3.2
$
2.14
Diluted net income per
share from continuing
operations
$
117.4
227.6
$
147.1
$
Diluted net income per
share
$
5.35
$
4.4
101
$
$
1.53
$
1.75
$
3.2
$
2.14
Purchase of property
and equipment for
continuing operations
251.4
103.1
84.5
55.7
$
302.5
$
297.9
Cash flow provided by
continuing operations
$
499.2
$
416.1
132.4
43.9
76.6
$
193.2
$
176.2
49.6
Cash dividends to
shareholders
113.7
101.5
61.6
53
27.5
4.6
107.2
Repurchase and
retirement of common
stock
530
127.5
Cash dividends per
share
$
1.68
$
1.48
50.2
$
0.78
$
0.76
$
0.9
$
0.8
325.3
$
393.9
Cash and cash
equivalents
$
92.2
$
417
491.5
443.6
Current assets
865.7
1,017.80
875
808.1
$
140.2
$
27.2
$
Current liabilities
748.1
631
586.3
584.2
1,061.60
763.7
751.1
Total assets
1,685.50
1,488.50
1,228.00
104.3
104.6
343.1
404.8
204.5
137
Shareholders’ equity
535.6
690.5
500.1
371
100
200
200
Long-term debt and
capital lease
obligations
284.3

2009 2010 2011 2012 2013
Sales $1.6B $2B $2.7B $3.2B $3.8B
ROA 13% 16% 20% 23% 24%
EPS $1.53 $2.14 $3.20 $4.40 $5.40