
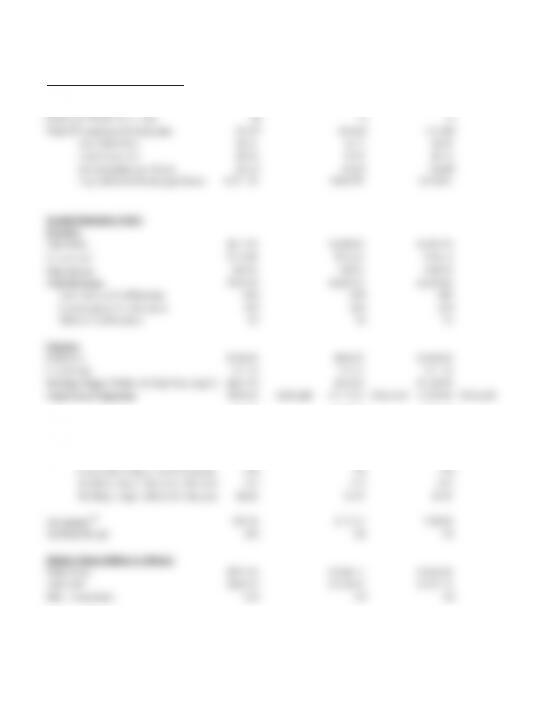
U.S. Demographic & Admission Trends
Age
Segment
% of
Tickets
Purchased
Admission
s Per
Capita
% of
Frequent
Movie
Goers1
# (mil.) % # (mil.) % # (mil.) %
# Increase
per
existing
screen2
New
annual
admissions
per
screen3
% of New
Admission
s
2 to 11 yrs
12% 3.3 7% 43.2 14% 50 13% 6.8 16% 170 563 10%
12 to 17 yrs
14% 6.4 15% 25.4 8% 30.6 8% 5.3 21% 132 843 15% combined ages 12-24
18 to 24 yrs
16% 6.2 19% 31.1 10% 35.7 9% 4.6 15% 114 708 13% 9.9 36% 246 1,551
25 to 39 yrs
20% 3.7 19% 64.4 21% 73.3 19% 8.9 14% 223 827 15%
40 to 49 yrs
13% 3.6 15% 41.9 13% 48.7 13% 6.8 16% 170 611 11%
50 to 59 yrs
12% 3.1 11% 43.9 14% 43.8 12% -0.1 0% -2 -7 0%
60 yrs+
13% 2.4 14% 63.7 20% 97.3 26% 33.6 53% 839 2,013 36%
Simple
Avg. = 4.1
U.S. Avg.
= 3.7
19%
1,646
5,558
14%
Projections
100%
100%
313.6
65.8
2014 Admissions
2014 Population
Est. 2035 Population
Change 2014 – 2035
100%
379.5
100%
Carmike
Cinemark** Regal
Theater and Attendance Information
Screens (U.S. only) 2,502 3,916 6,880
Theaters (U.S. only) 249 298 540
Screens per Theater (U.S. only) 10 13 13
Total US Attendance (in thousands) 50,357 163,639 216,400
Avg Ticket Price $6.85 $6.72 $8.90
Avg Concessions $3.10 $3.34 $3.46
Avg Attendance per Screen 20,127 41,787 31,453
Avg Admission Revenue per Screen $137,130 $280,797 $279,811
Net Income*** $96.30 $171.42 $144.80
Net Profit Margin 18% 10% 5%
Balance Sheet (dollars in millions)
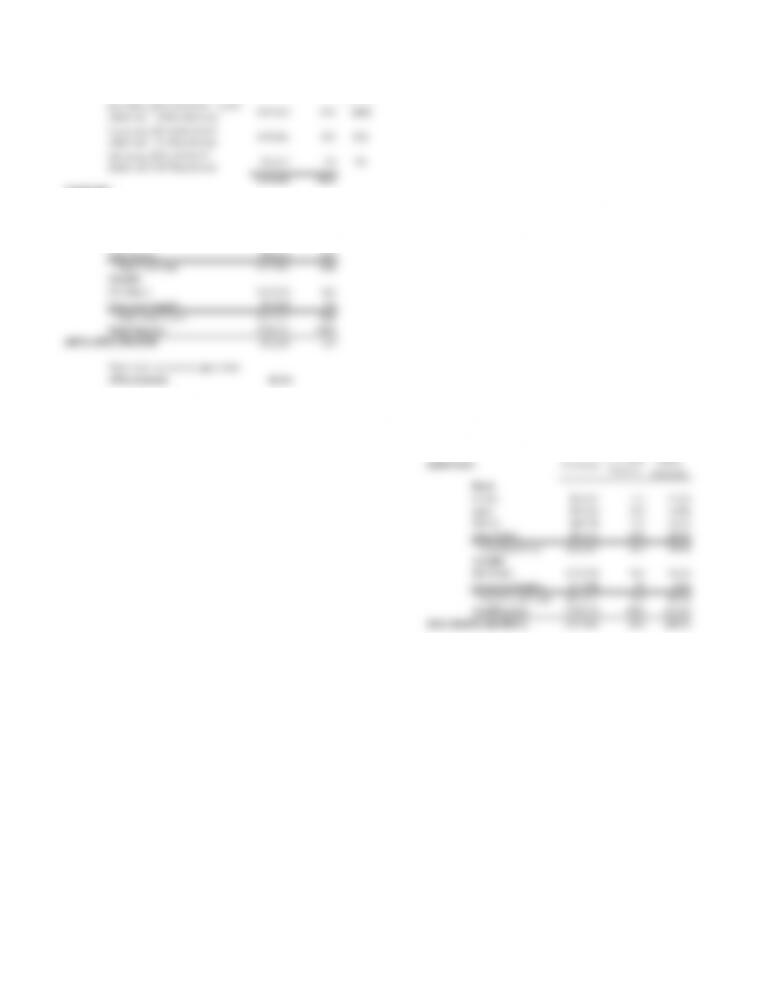
Per Screen
% of Total
Expenses
% Box
Office
Revenues
$257,923 63% 100%
$130,964 32% 51%
$21,117 5% 8%
$442,400 100%
Facility $65,942 17%
Labor $39,565 10%
Utilities $48,358 12%
Other SG&A $79,131 20%
Total Fixed Costs $232,997 60%
Film Rental $139,278 36%
Concession Supplies $17,898 5%
Total Variable Costs $157,177 40%
Total Expenses $390,174 100%
$52,226 12%
Fixed costs as a percentage of box
office revenues
90.3%
Box office revenues as percentage
of total expenses
66.1%
Per Screen
% of Total
Expenses
% Box
Office
Variable
Film Rental $139,278 36% 54.0%
Concession Supplies $17,898 5% 6.9%
Total Variable Costs $157,177 40% 60.9%
Total Expenses $390,174 100% 151.3%
EXPENSES
Variable
OPERATING INCOME
REVENUES
Box Office ($257,923/$8.59 = 30,037
admissions = 618/week/screen)
Concessions ($130,964/30,037
admissions = $4.36/admission)
Advertising ($21,117/30,037
admissions = $0.70/admission)
EXPENSES
Fixed