
College Bound
Rates
Impoverished neighborhoods 18%
Prosperous neighborhoods 77%
KIPP early results 33%
National results 30%
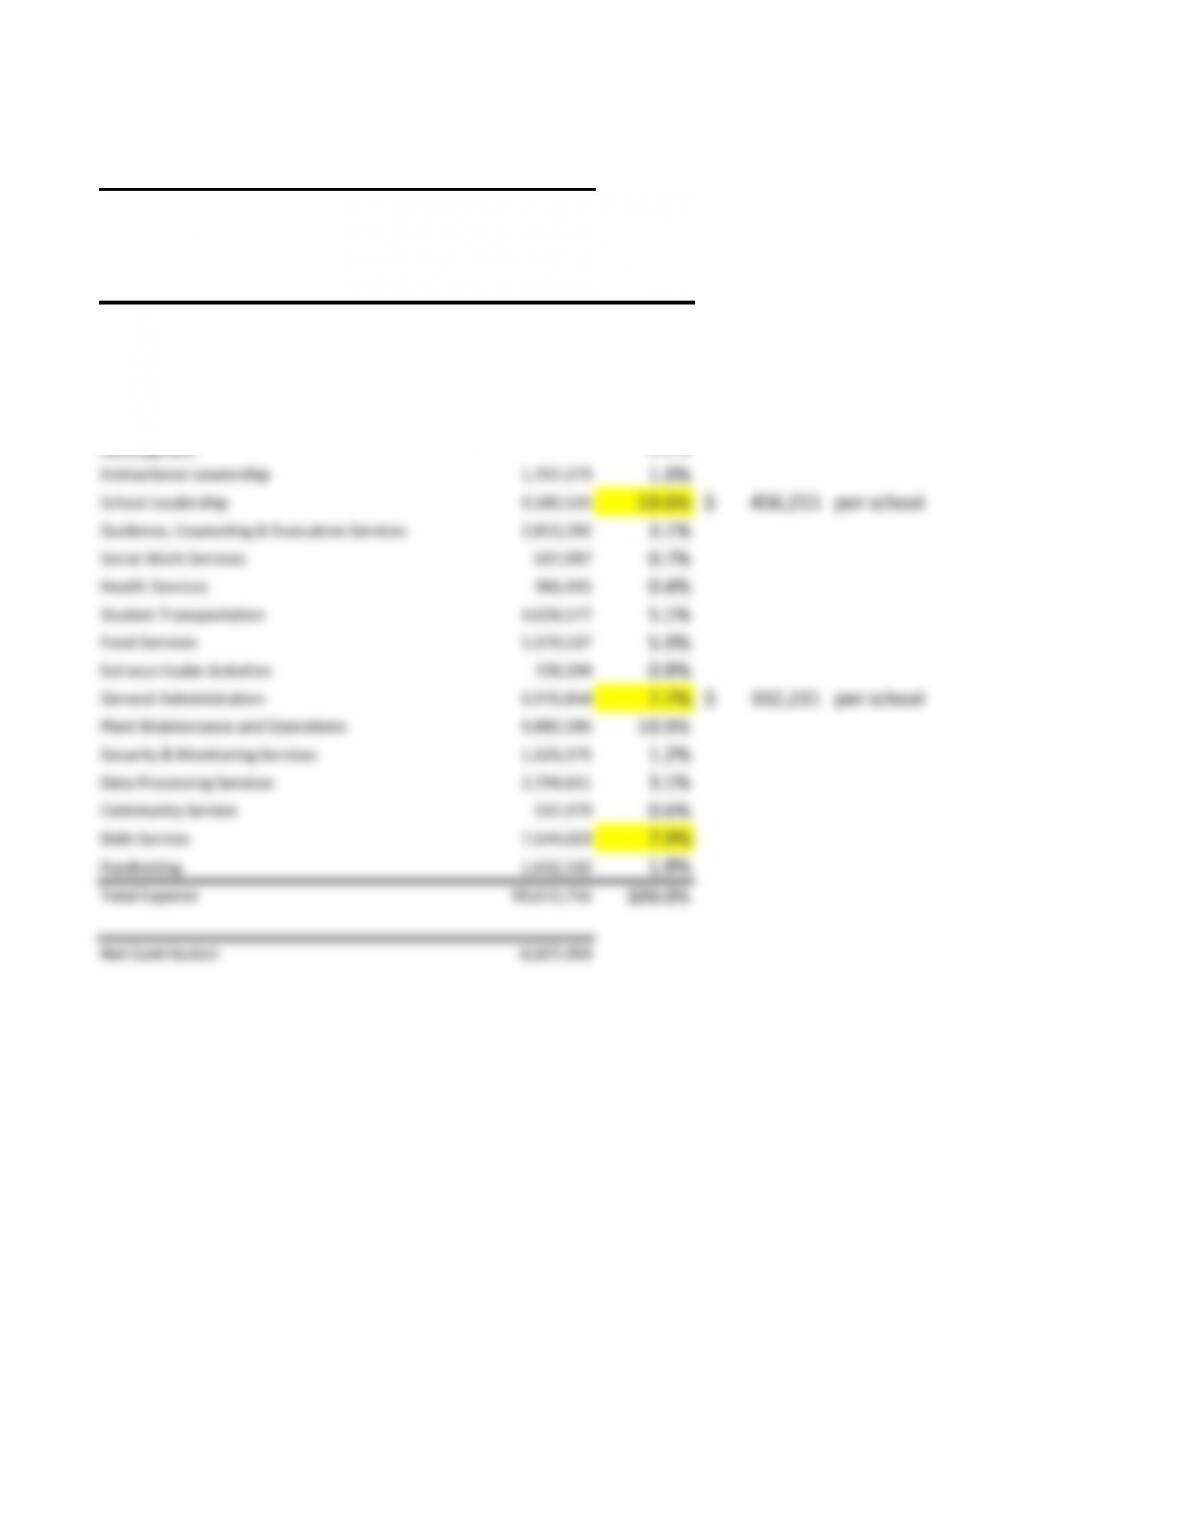
Other Revenues from Local Sources 9,635,525 11.8%
State Program Revenues 60,998,666 74.6%
Federal Revenues 11,149,111 13.6%
Total Revenue 81,783,302 100.0%
Basic Instruction 33,724,037 37.2%
Instructional Resources and Media Services 62,510 0.1%
Curriculum Development and Instructional Staff
Development
859,936 0.9%
Instructional Leadership 1,707,373 1.9%
School Leadership 9,580,515 10.6% 456,215$ per school
Guidance, Counseling & Evaluation Services 2,853,292 3.1%
Social Work Services 637,097 0.7%
Health Services 366,415 0.4%
Student Transportation 4,624,577 5.1%
Food Services 5,379,537 5.9%
Extracurricular Activities 728,194 0.8%
General Administration 6,976,854 7.7% 332,231$ per school
Plant Maintenance and Operations 9,880,396 10.9%
Security & Monitoring Services 1,121,375 1.2%
Data Processing Services 2,794,611 3.1%
Community Service 537,479 0.6%
Debt Service 7,144,023 7.9%
Fundraising 1,632,532 1.8%
Total Expense 90,610,756 100.0%
Net Contribution -8,827,454
KIPP, Inc.
Consolidated District Final Budget
For the Year Ended June 30, 2013
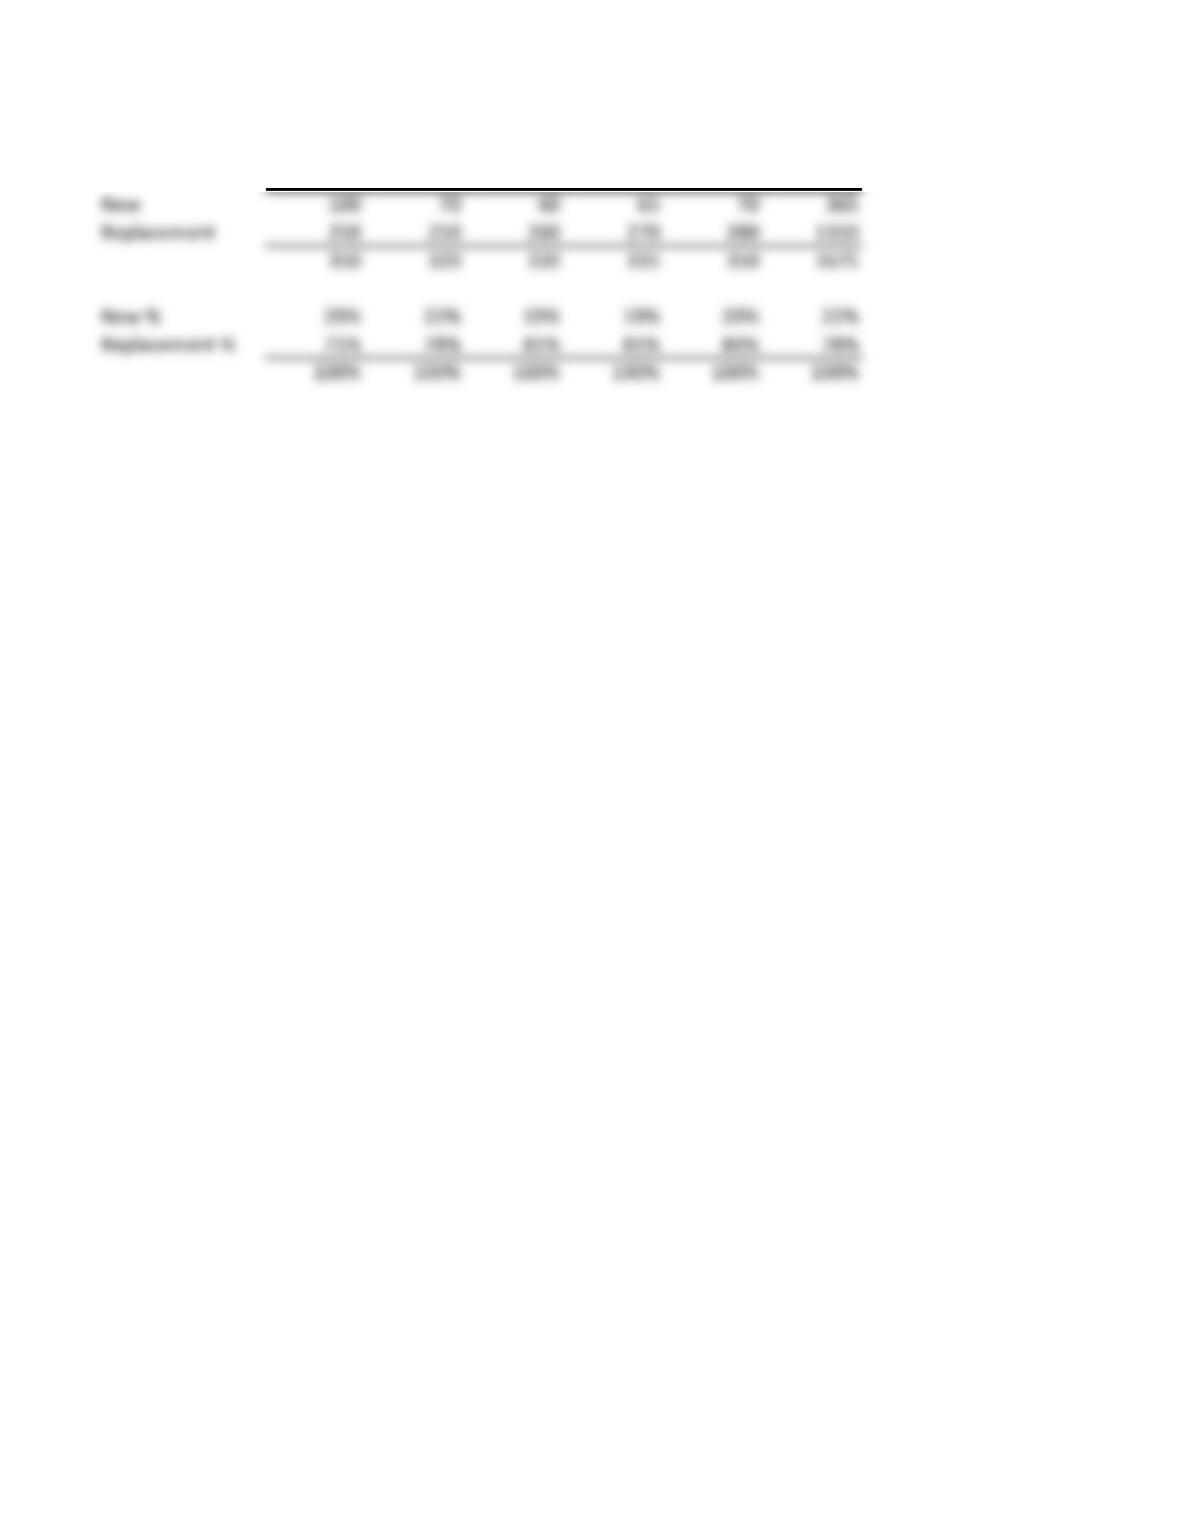
2014 2015 2016 2017 2018 Totals
New 100 70 60 65 70 365
Replacement 250 250 260 270 280 1310
350 320 320 335 350 1675
New % 29% 22% 19% 19% 20% 22%
Replacement % 71% 78% 81% 81% 80% 78%
100% 100% 100% 100% 100% 100%
Projected Hiring Needs – Next 5 Years
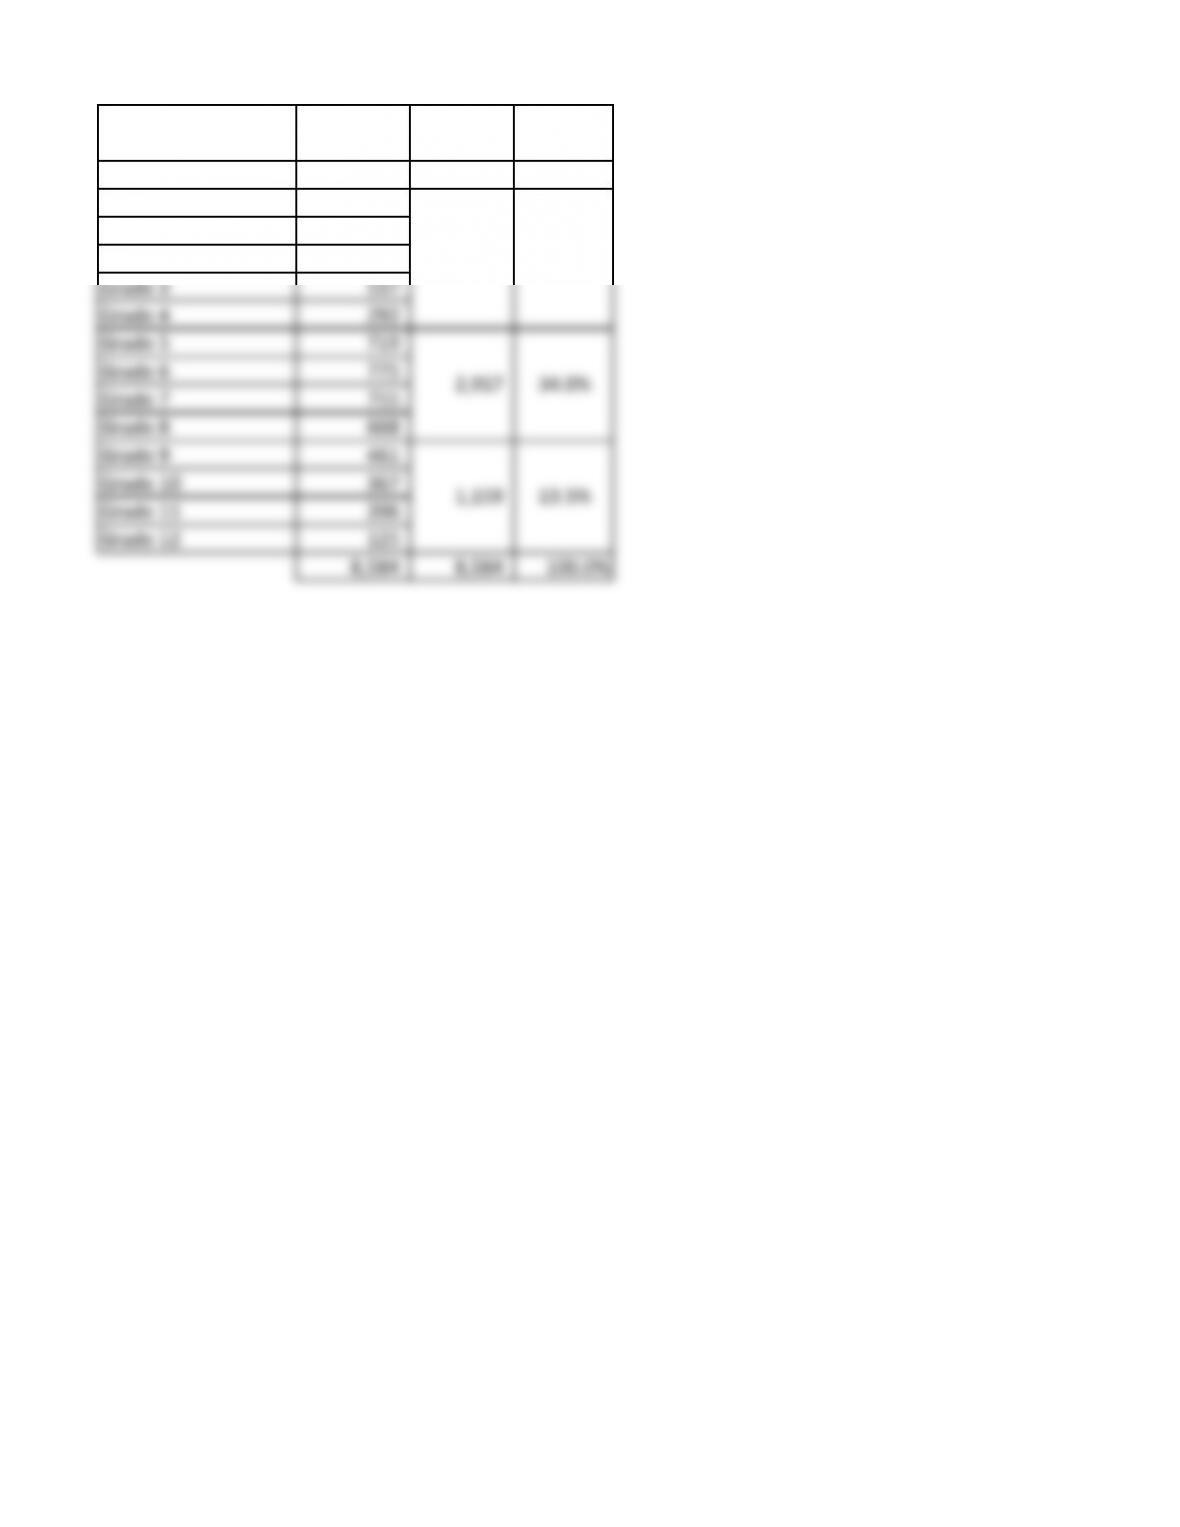
Class # Students
School
Total
School
Percent
Pre-Kindergarten 1,247 1,247 14.5%
Kindergarten 891
Grade 1 845
Grade 2 696
Grade 3 537
Grade 4 292
Grade 5 719
Grade 6 775
Grade 7 755
Grade 8 668
Grade 9 461
Grade 10 367
Grade 11 206
Grade 12 125
8,584 8,584 100.0%
1,159
2,917
3,261
38.0%
34.0%
13.5%