Chapter 5/Consumer Choice: Individual and Market Demand
CHAPTER 5
CONSUMER CHOICE: INDIVIDUAL AND
MARKET DEMAND
TEST YOURSELF
1. Which gives you greater total utility: 14 gallons of water per day or 22 gallons per day?
Why?
2. At which level do you get greater marginal utility: 14 gallons per day or 22 gallons per
day? Why?
3. Which of the following items are likely to be normal goods for a typical consumer?
Which are likely to be inferior goods?
a. Expensive perfume
b. Paper plates
c. Secondhand clothing
d. Overseas trips
4.Emily buys an air conditioner that costs $700. Because the air in her home is cleaner, its
use saves her $250 in curtain cleaning costs over the lifetime of the air conditioner. In
money terms, what is the opportunity cost of the air conditioner?
5. Suppose that strawberries sell for $3 per basket. Jim is considering whether to buy zero,
one, two, three, or four baskets. On your own, create a plausible set of total and
marginal utility numbers for the different quantities of strawberries (as we did for
pizza in Table 1), and arrange them in a table. From your table, calculate how many
baskets Jim would buy.
Baskets Marginal Utility ($) Total Utility ($)
0 — —
1 6 6
6. Draw a graph showing the consumer’s surplus Jim would get from his strawberry
purchase in Test Yourself Question 5, and check your answer with the help of your
marginal utility table.
Chapter 5/Consumer Choice: Individual and Market Demand
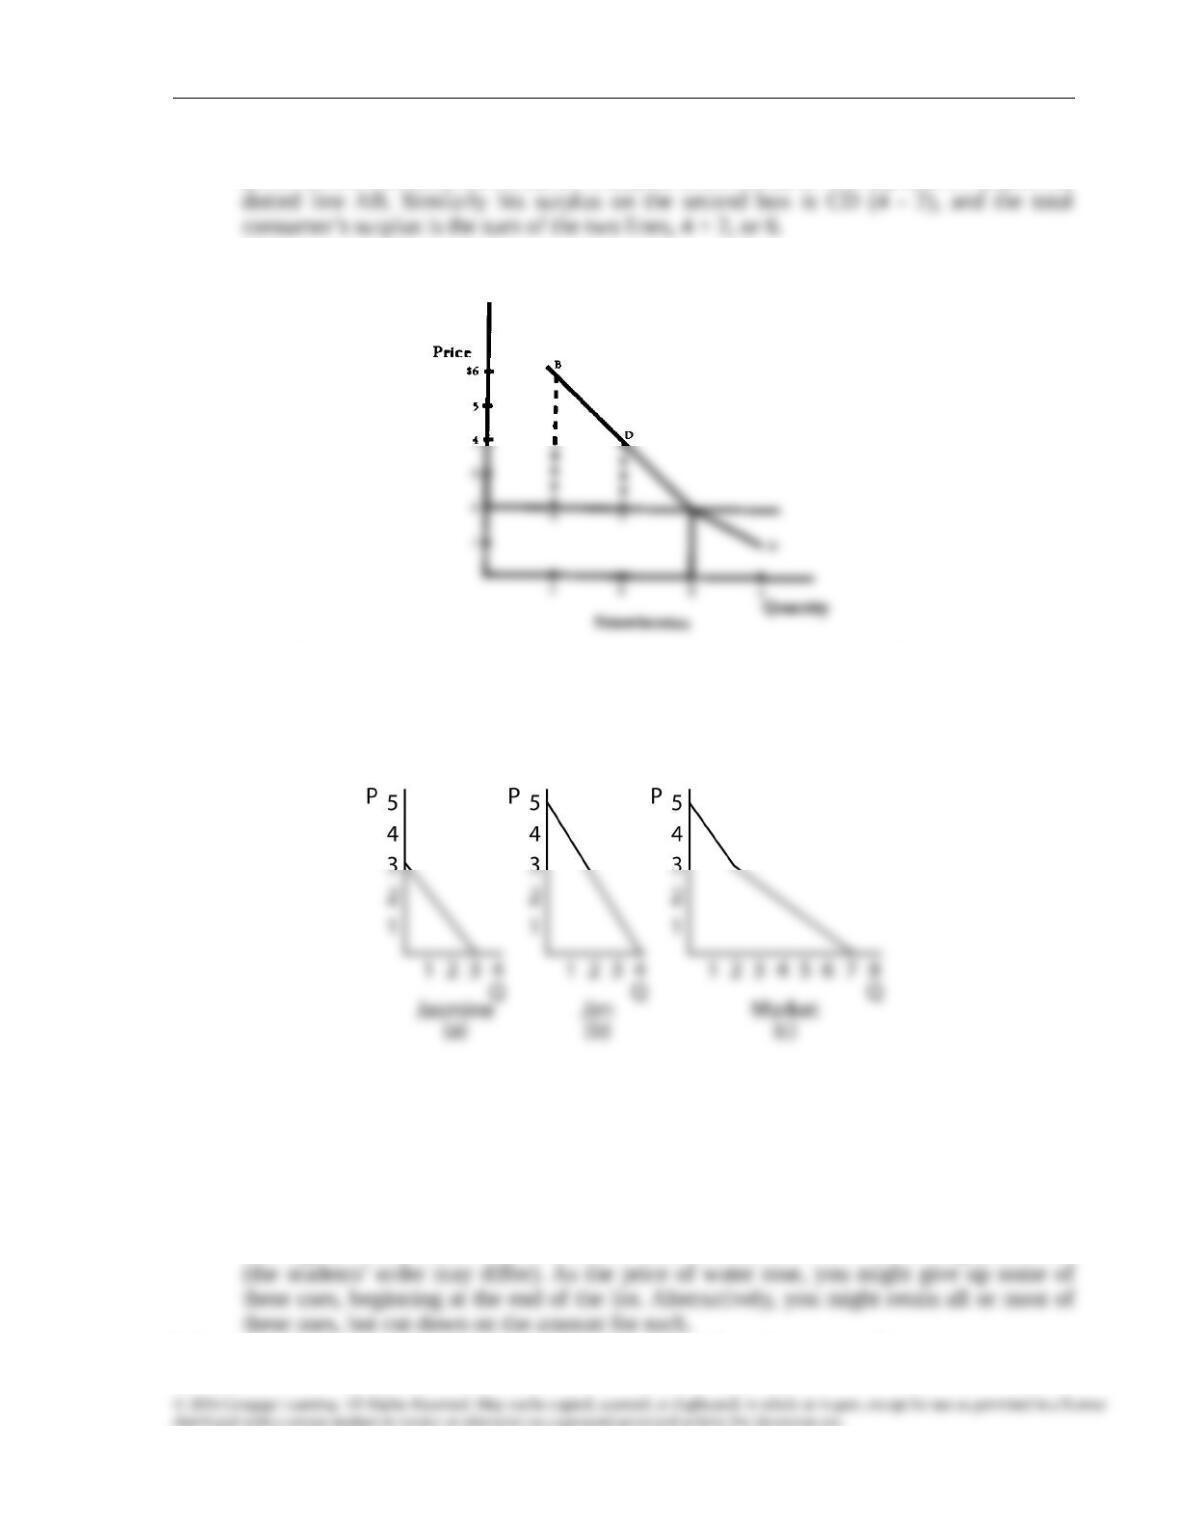
Figure 1 shows that Jim buys 3 boxes of berries, where marginal utility equals
price. On the first box, his consumer’s surplus is the excess of MU (6) above P (2), or the
FIGURE 1
7. Consider a market with two consumers, Jasmine and Jim. Draw a demand curve for
each of the two consumers, and use those curves to construct the demand curve for
the entire market.
FIGURE 2
DISCUSSION QUESTIONS
1.Describe some of the different ways you use water. Which would you give up if the price
of water were to rise a little? If it were to rise by a fairly large amount? If it were to rise
by a very large amount?
In descending order of importance, water is used for drinking, for cooking, for
bathing, to feed pets, to wash clothes, to water lawns, to store in swimming pools, etc.
2.Suppose that you wanted to measure the marginal utility of a commodity to a consumer
Chapter 5/Consumer Choice: Individual and Market Demand
by directly determining the consumer’s psychological attitude or strength of feeling
toward the commodity rather than by seeing how much money the consumer would
give up for the commodity. Why would you find it difficult to make such a psychological
measurement?
You could ask the consumer to construct a scale, from 1 to 100, then reveal where
on the scale each commodity falls. Or you could try measuring blood pressure or pulse as
3.Some people who do not understand the optimal purchase rule argue that if a consumer
buys so much of a good that its price equals its marginal utility, the consumer could not
possibly be behaving optimally. Rather, they say, the consumer would be better off
quitting while ahead or buying a quantity such that marginal utility is much greater
than price. What is wrong with this argument? (Hint: What opportunity would the
consumer then miss? Is it maximization of marginal or total utility that serves the
consumer’s interests?)
It is reasonable to assume that rational consumers are trying to get the most
possible consumer’s surplus for themselves, that is, the most total utility less expenditure
—not the most possible average utility per good or marginal utility. If a consumer quit
4.What inferior goods do you purchase? Why do you buy them? Do you think you will
continue to buy them when your income is higher?
Students are particularly well situated to answer this question, since many of them
5.A bottle of wine you bought 15 years ago for $20 now has a market value of $1,500.
Would you sell your bottle at that price or keep it for an important occasion? Would
you purchase another bottle of such old wine at that high price?
It may be more rational (or at least consistent) to take one of the following
6.You have $20,000 to invest in the stock market, which has been rising rapidly for the past
18 months. What course of action seems rational?
Perhaps you should invest in the stock market now on the expectation that stock
Chapter 5/Consumer Choice: Individual and Market Demand
ANSWERS TO APPENDIX QUESTIONS
TEST YOURSELF
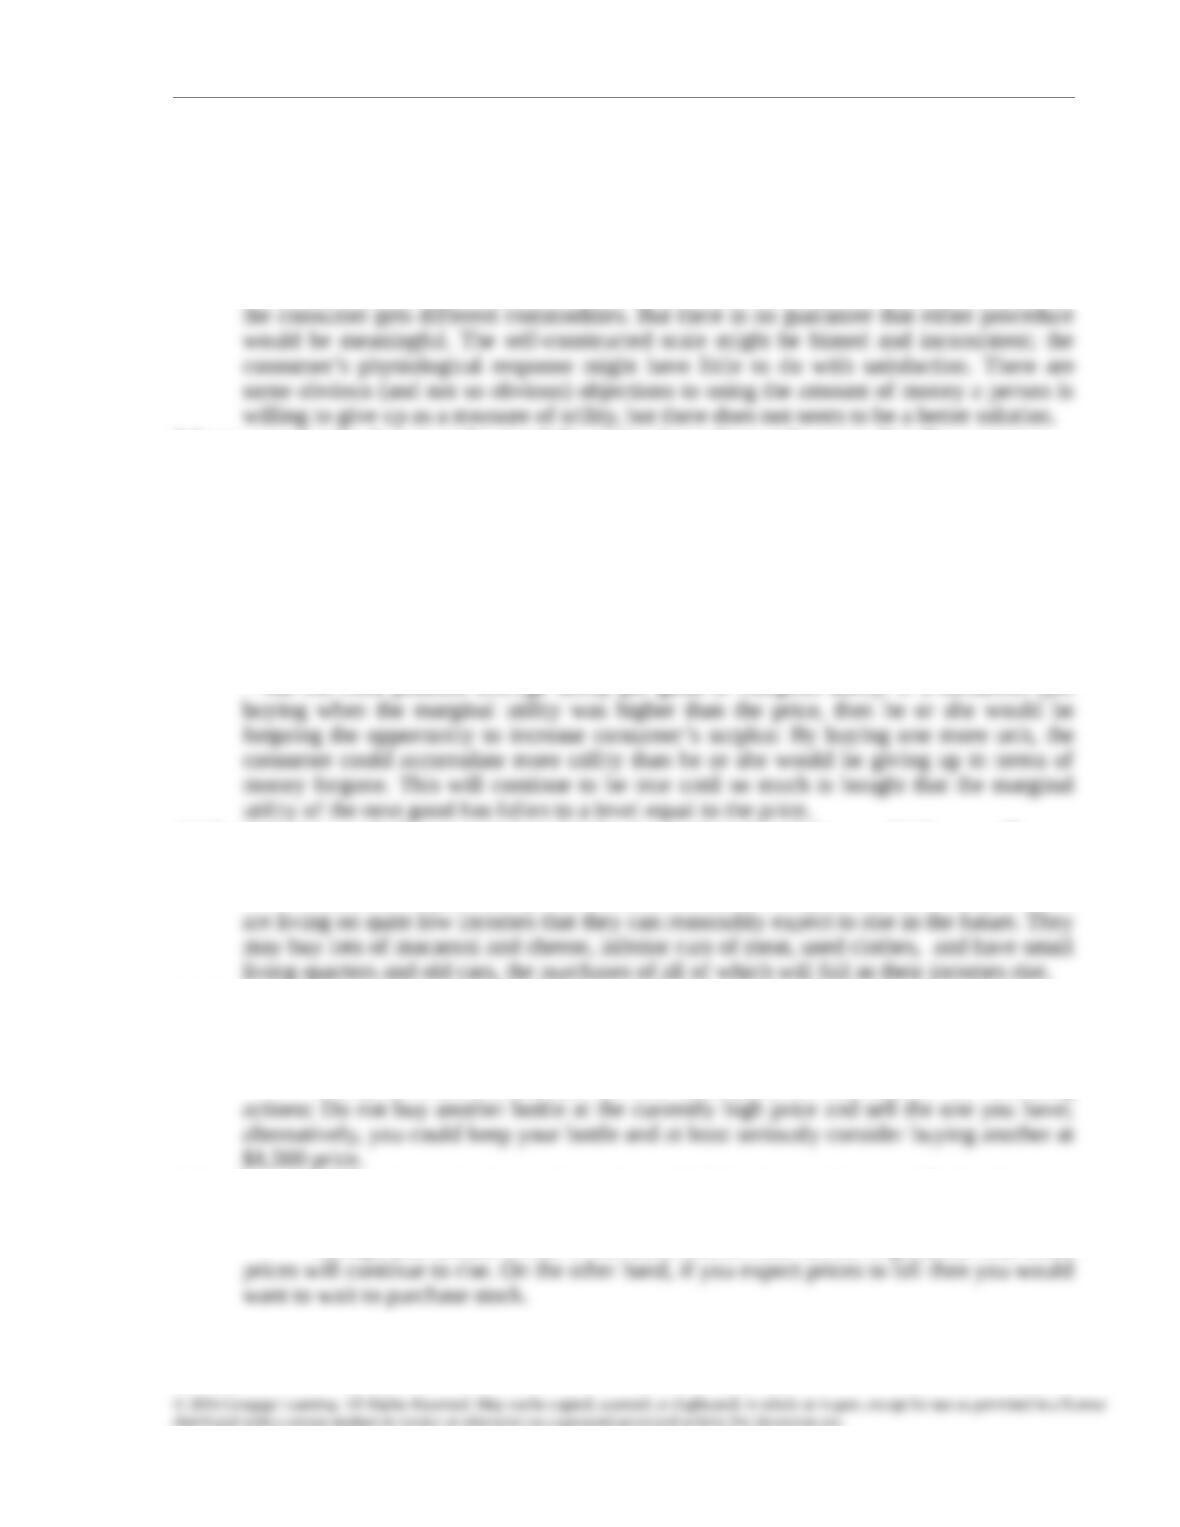
1. John Q. Public spends all of his income on tacos and hot dogs. Draw his budget line
under several conditions:
a. His income is $100, and one taco and one hot dog each cost $2.
b. His income is $150, and the two prices remain the same.
c. His income is $100, hot dogs cost $2 each, and tacos cost $2.50 each.
FIGURE 3
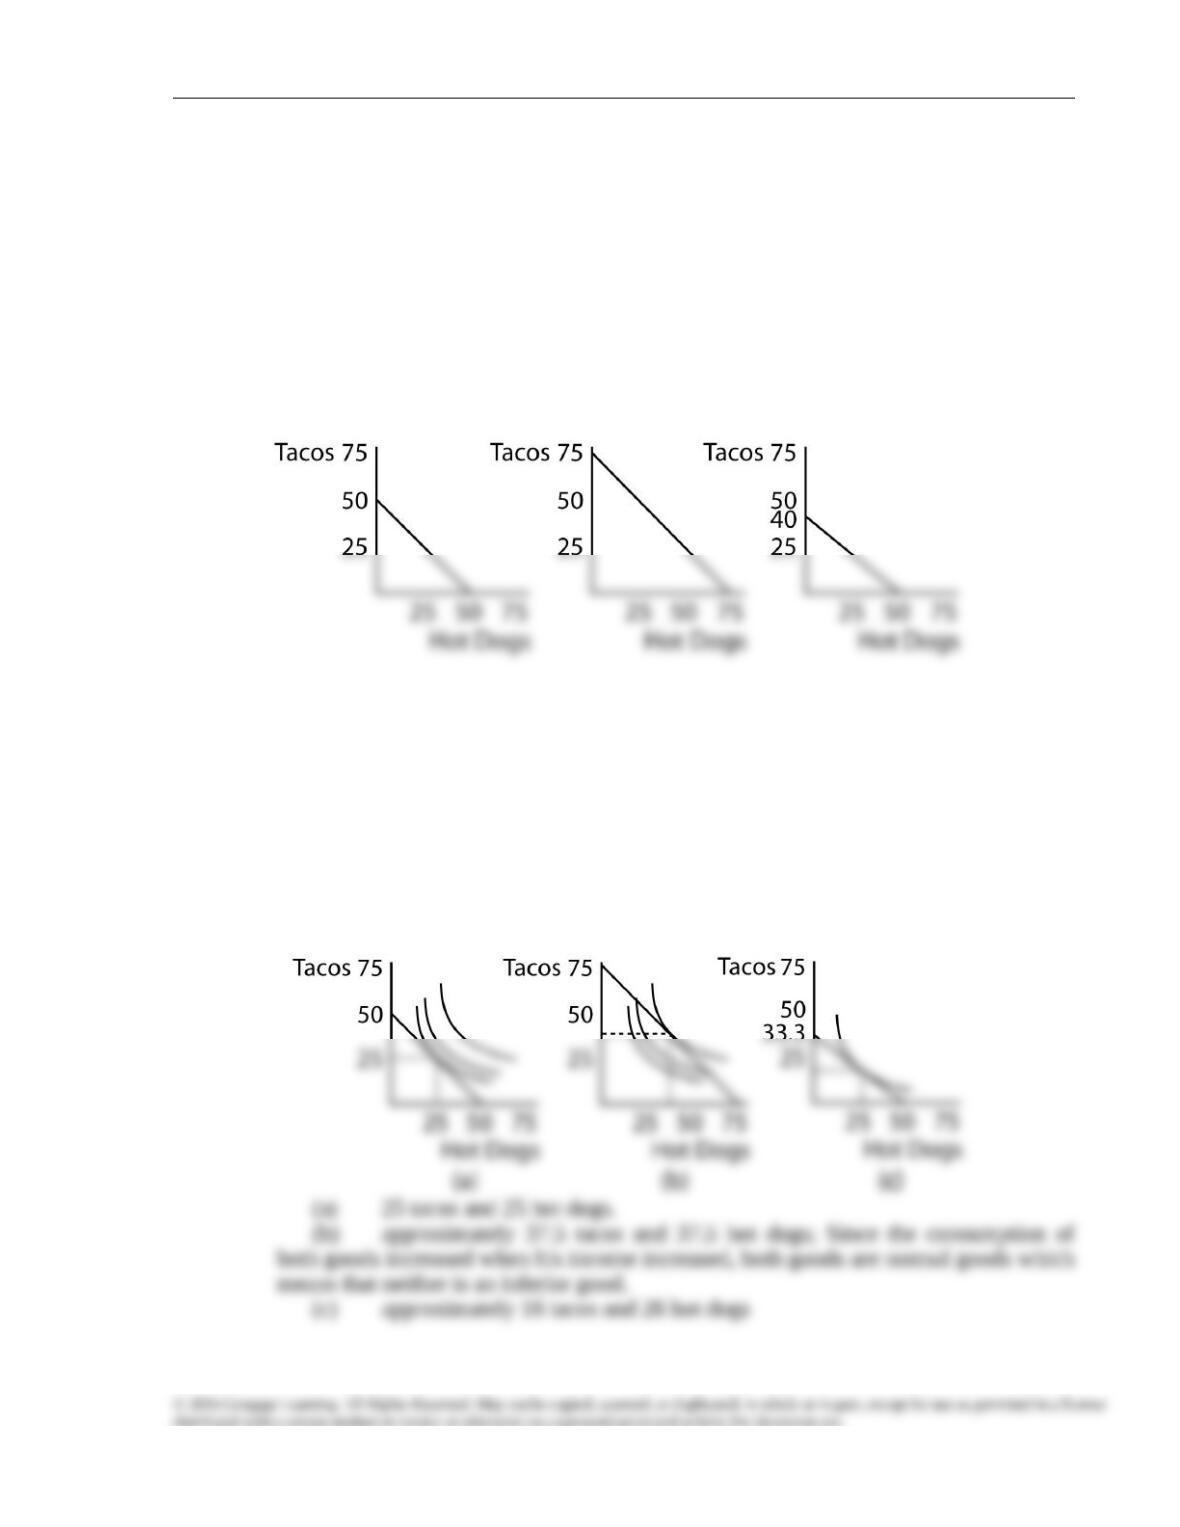
2. Draw some hypothetical indifference curves for John Q. Public on a diagram identical
to the one you constructed for Test Yourself Question 1.
a. Approximately how many tacos and how many hot dogs will Mr. Public buy?
b. How will these choices change if his income increases to $150? Is either good an
inferior good?
c. How will these choices change if the price of a taco rises to $3.00?
FIGURE 4
3. Explain the information that the slope of an indifference curve conveys about a
consumer’s preferences. Use this relationship to explain the typical U-shaped
curvature of indifference curves.
The slope of an indifference curve is the maximum number of units of the good
on the Y-axis (say, cookies) the consumer is willing to give up to get one more unit of the
good on the X-axis (say, compact discs). An indifference curve that is U-shaped with