
Chapter 1/What Is Economics?
PART II
SOLUTIONS
Chapter 1/What Is Economics?
CHAPTER 1
WHAT IS ECONOMICS?
DISCUSSION QUESTIONS
1. Think about a way you would construct a model of how your college is governed. Which
officers and administrators would you include and exclude from your model if the
objective were one of the following:
a.To explain how decisions on financial aid are made
b.To explain the quality of the faculty
Relate this to the map example in the chapter.
This question is designed to make students construct their own version of the map
example. A good answer is one in which (i) the people who are principally involved in
the decision are identified, (ii) the flow of information and persuasion between those
people is outlined and (iii) extraneous detail is eliminated. The “model” is likely to be
quite different for part (a) and part (b). Thus decisions on financial aid may depend upon
2. Relate the process of abstraction to the way you take notes in a lecture. Why do you not
try to transcribe every word uttered by the lecturer? Why don’t you write down just the
title of the lecture and stop there? How do you decide, roughly speaking, on the correct
amount of detail?
Most students are familiar with the need to abstract from detail, and take notes only about
the essential points. The student will want enough detail to be able to reconstruct the
instructor’s argument, but not so much detail as to obscure the main point. It is unlikely
that simply writing down the title of the lecture will enable the student to recall the main
3. Explain why a government policy maker cannot afford to ignore economic theory.
Chapter 1/What Is Economics?
Without theory, an economist (or anyone else) can only assemble facts, but she cannot
understand the relationship between those facts, in particular the cause-and-effect
relationships. For example, a person who ignores theory can notice that average prices
APPENDIX—USING GRAPHS: A REVIEW
TEST YOURSELF
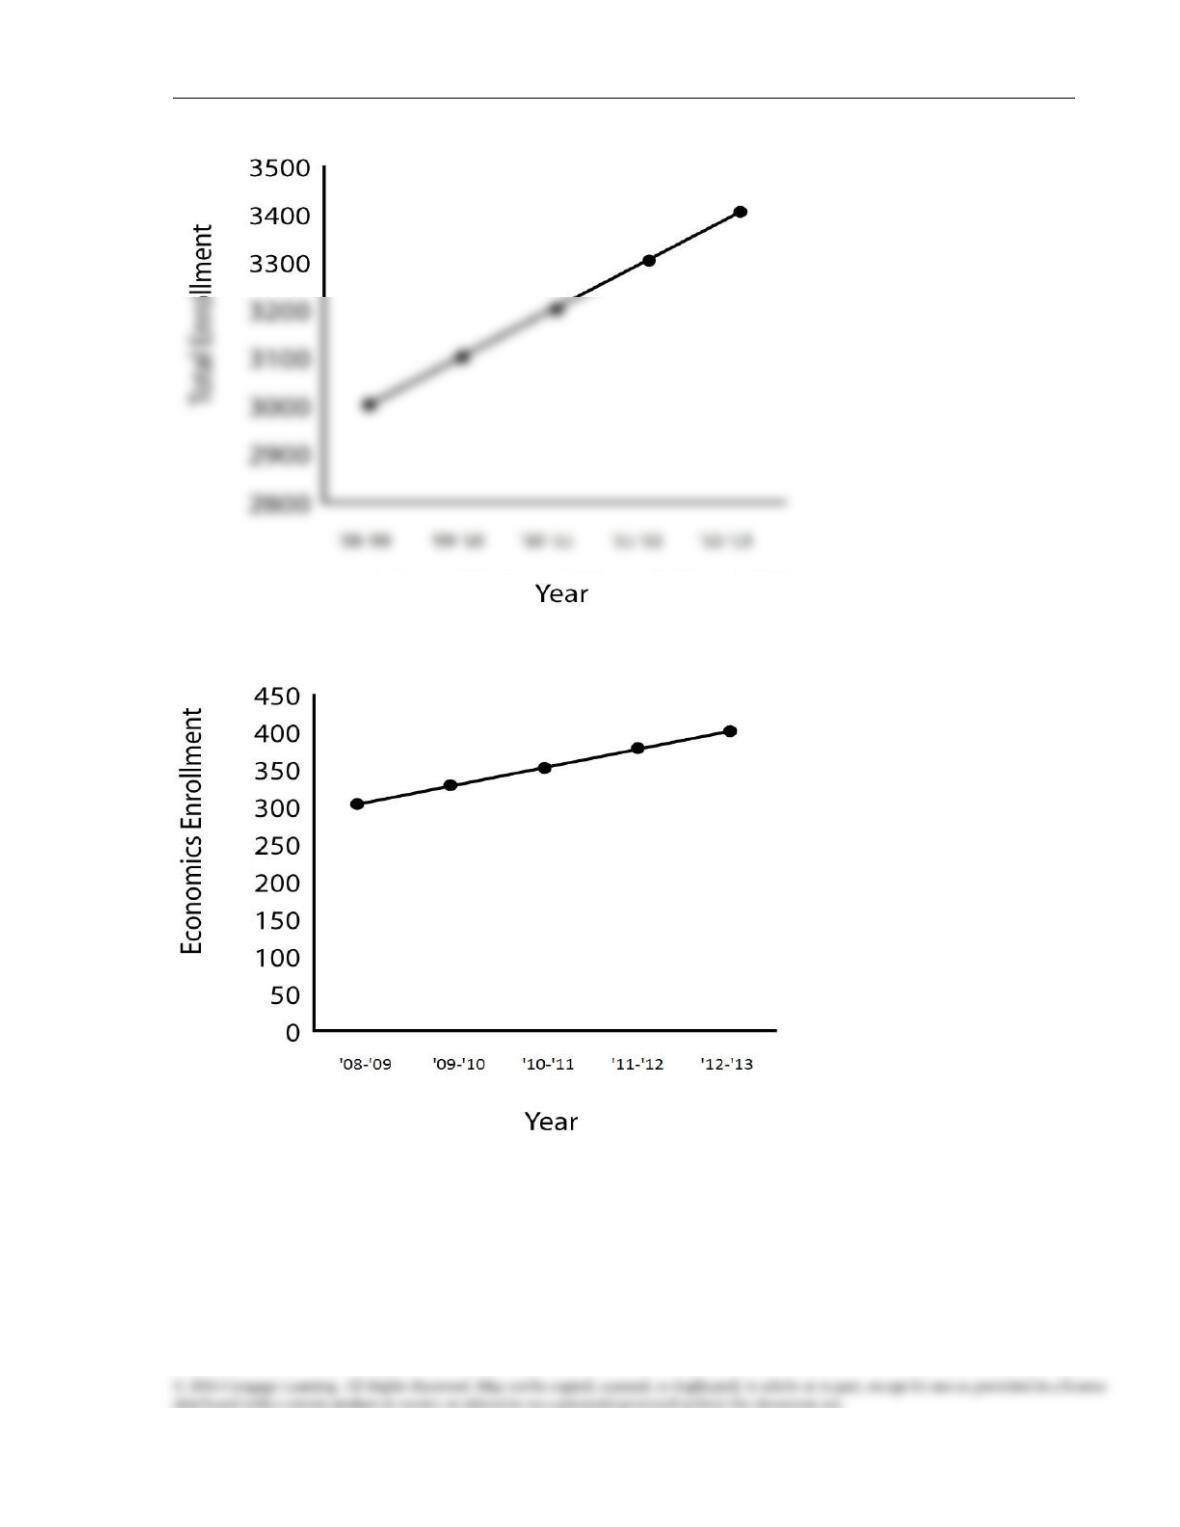
1. Portray the following hypothetical data on a two variable diagram:
Measure the slope of the resulting line, and explain what this number means
Slope is 100 interpreted as 100 new students each academic year.
Academic Year Total Enrollment Enrollment in
Economics Courses
2008–2009 3,000 300
2009–2010 3,100 325
2010–2011 3,200 350
2011–2012 3,300 375
2012–2013 3,400 400
Chapter 1/What Is Economics?
Slope is 25 interpreted as 25 new economics students each academic year.
2. From Figure 5, calculate the slope of the curve at point M.
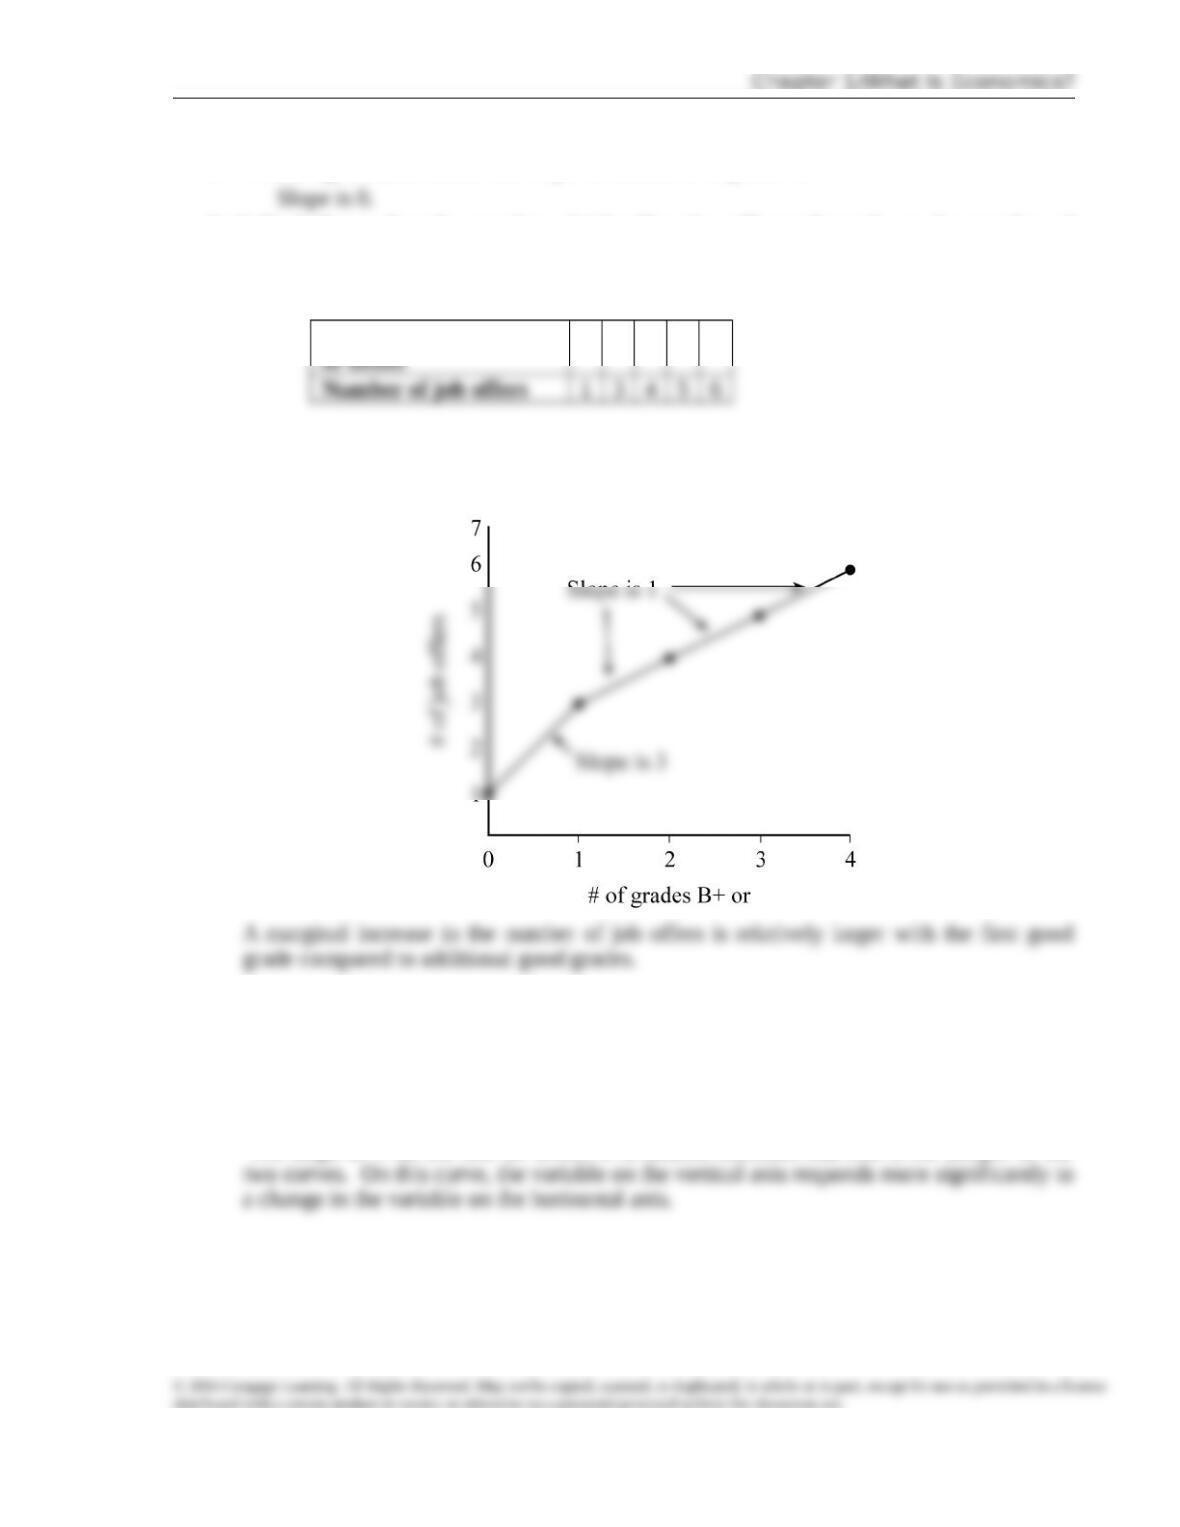
3. Colin believes that the number of job offers he will get depends on the number of
courses in which his grade is B+ or better. He concludes from observation that the
following figures are typical:
Number of grades of B+
01234
Put these numbers into a graph like Figure 1(a). Measure and interpret the slopes between
adjacent dots.
4. In Figure 6, determine the values of X and Y at point K and at point E . What do you
conclude about the slopes of the lines on which K and E are located?
K = (2,2); E = (2,1)
The slope of 1 for the line on which K is located indicates that this is the steeper of the
5. In Figure 8, interpret the economic meaning of points A and B. What do the two
points have in common? What is the difference in their economic interpretation?
A => 30 hours labor and 40 yds. cloth = 20 units of output.

Chapter 1/What Is Economics?