Chapter 4
Contemporary Models of Development
and Underdevelopment
Key Concepts
The chapter retains the models of economic development that are more sophisticated versions of the older
models from the previous edition including the Hausmann-Rodrick-Velasco growth diagnostic framework.
These new models relax many assumptions such as diminishing returns, constant returns to scale, and
perfect competition. Major topics in the chapter include:
Coordination failure as an explanation for underdevelopment
The existence and implication of multiple equilibria
Kremer’s O-Ring Theory
Hausmann-Rodrick-Velsco growth diagnostic framework
Section 4.1 discusses underdevelopment as a coordination failure and introduces the concepts of coordination
failure and multiple equilibria. Some interesting non-technical examples are presented.
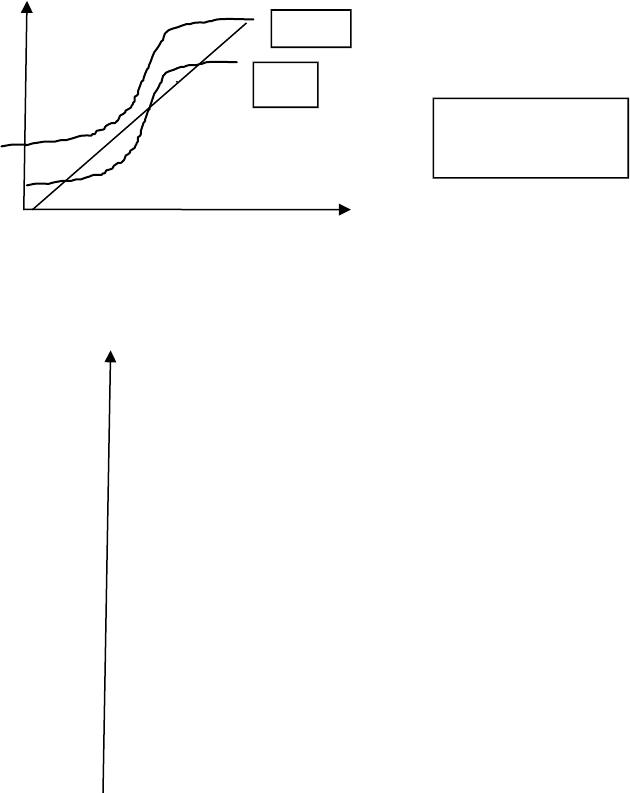
The existence of multiple equilibria is illustrated graphically using an S-shaped curve to reflect the benefits
of some action. Stable and unstable equilibria are discussed. It is noted that markets cannot be expected
to arrive at the best equilibrium point, and furthermore, that some help from the government may be necessary.
Section 4.3 reviews the original “Big Push” model and describes an updated version of this model. The
six key assumptions are explained, followed by a graphical explanation of how multiple equilibria are
possible, depending on the wage level in the modern sector. A big push might be required to achieve the
desired equilibrium point. Other cases in which a big push might be required are mentioned, and include
the existence of intertemporal effects, urbanization effects, infrastructure effects, and training effects.
Section 4.5 introduces the Kremer’s O-ring theory to explain the existence of poverty traps. The model is
presented in some detail and its implications are discussed. This model assumes strong complementarities
between the inputs.
Section 4.6 discusses the concept of economic development as a process of self-discovery regarding the
discovery of one’s comparative advantage and the associated market failures in this self-discovery process.
Section 4.7 presents the Hausmann-Rodrick-Velsco growth diagnostic framework and focuses on identifying
a country’s binding constraints on economic growth and alleviating the most pressing constraints. The
HRV framework highlights that there is no “one size fits all” in development policy. Particular economic
development strategies are most effective depending on the social and private rates of return on economic
activities and the constraints facing the economy.
Box 4.1 discusses efforts in Ecuador to change the culture of arriving late for public events, business meetings
etc. This is by way of illustrating the idea of multiple equilibria and Ecuador is seen as attempting to move
from an inferior to a superior one. Box 4.2 presents another example of efforts to address coordination
failure in health care delivery in Uganda. The end of the chapter includes a case study on the sources of
economic growth in China during the last two decades. Several explanations for the exceptional Chinese
economic performance are offered as a means to illustrating the different approaches to economic
development discussed in this chapter. The authors conclude that while the record of Chinese economic
performance has much to teach us, it would be almost impossible for other countries to emulate the Chinese
example. In addition challenges faced by China are also revisited including the growing environmental
crisis and product safety standards.
Lecture Suggestions
Chapter 4 is a very technical chapter and covers a tremendous amount of material. However, as a chapter
devoted to contemporary models of development it needs to be covered. Certainly sections 4.1, 4.2,4.4,
4.6, 4.7, and 4.8 should be covered in their entirety Section 4.3 up to the authors’ discussion of Krugman’s
model and the subsection of 4.5 where the results of Kremer’s O-rung theory are discussed should be
covered as well.
The S curve and 450 line model of section 4.2 can easily be used to discuss the “deep interventions”
covered in section 4.1 as well as the idea of a “big push” discussed in section 4.3.
Say that we call the equilibrium point in Figure 4.1 (page 169) corresponding to D1 a trap equilibrium, the
next equilibrium point (corresponding to D2) a threshold equilibrium, and the final equilibrium point
(corresponding to D3) a preferred equilibrium. Now imagine a temporary tax cut that promotes investment
that it rational for an individual entrepreneur to carry out even if she did not believe others would invest.
The S curve shifts upward –thanks to this deep intervention- from S to S’ below (Figure 4.1b). Assuming
that initially equilibrium was D1, the shift in S to S’ clearly pushes the economy beyond the trap, past the
threshold and to a higher point than even the initial preferred equilibrium.
Once this support is removed and the tax cut expires, while the S curve shifts back down from S’ to S note
that rather than returning to the pre-cut trap equilibrium investors settle at an equilibrium level of
investment corresponding to the initial preferred equilibrium. Note that there is little chance of returning
to the trap equilibrium once it has been escaped, the threshold crossed and the higher level equilibrium
expectations have been established.
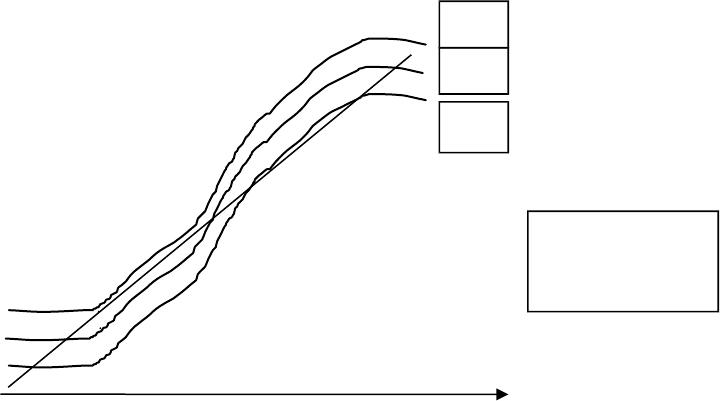
Similarly, Figure 4.1 can be used to describe the idea of a big push. Here imagine that policies are
followed that do relatively little to shift the S curve higher. The S curve shifts from only S to S” below in
Figure 4.1c. It is only if S is shifted to a point beyond S”’ that there will have been a big enough change to
materially affect expectations and individuals’ willingness to invest
S
S’
Figure 4.1b
It would be helpful to take such examples and connect them to discussion of the :where to meet dilemma”
of section 4.1. The examples given in Box 4.1 and 4.2 can be supplemented with examples such as those
found in Samuel Bowles’ Microeconomics: Behavior, Institutions, and Evolution Following Bowles the
difference between games that result in the where to meet dilemma (variously referred to as assurance
games, trust games, frequency dependent games, and coordination games) and prisoners’ dilemmas can be
shown using simple graphs. Also, Bowles’ example of the trap small farmers in India face in choosing less
risky but lower-yielding planting times over higher-yielding bur riskier ones complements nicely the
examples given in the text and examples students might generate on their own (see Discussion Topics
below)
The Hausmann-Rodrick-Velsco growth diagnostic framework makes a fairly compelling argument that
development economist need to focus on specific country circumstances while formulating
development policy for the nation.
Discussion Topics
Have students think of as many examples of coordination failures or complementarities as they can
and make a list on the board. Discuss how some of them could be solved.
S
S”
S”’
Figure 4.1c
Sample Questions
Short Answer
1. What three factors distinguish models of endogenous growth from their neoclassical counterparts?
Answer: There are increasing returns to capital investment (as opposed to decreasing), there are
2. What is meant by the term technological spillover?
Answer: Technological spillovers are present when investment generates external economies. The
3. Explain what is meant by the term coordination failure and provide an example.
Answer: This is a state of affairs in which agents are unable to coordinate their efforts, and hence
end up in an equilibrium that leaves them worse off than they would be if they were able to
4. Suppose that a developing country devotes extensive resources towards improving the education and
skill level of the labor force. How might this help the country avoid a coordination failure? Is this
strategy likely to be successful? Why or why not?
Answer: See page 166 for an answer to the first part. The answer to the second part is more open
5. Show in a diagram an S-curve and a 45-degree line. Are all three points of intersection stable
equilibrium points? Explain.
Answer: Explained in the text.
6. Explain how the S-curve reflects the typical nature of complementarities?
Answer: See pages 168-171 for a good explanation.
7. Explain how the government can help the economy avoid a coordination failure.
Answer: Discussed in the chapter.
8. Is a coordination failure a type of market failure? Explain.
9. Explain the basic idea behind the Big Push model?
Answer: What you expect for an answer depends on what you cover in lecture.
10. Explain how relatively high wages in the modern sector, as compared to the traditional sector, can
lead to a coordination failure.
11.Is it possible for a super-entrepreneur to solve all of the coordination failure problems within
a developing economy? Discuss.
Answer: Open ended essay.
12. How can the O-ring theory help explain the existence of a low-level equilibrium that an economy
may find itself in?
13. According to the HRV growth diagnostic framework why is there no “one size fits all”
development policy?
Answer: Explained on page 194.
14. Based on the HRV growth diagnostic framework and the case study in Box 4.2, what are the
binding constraints faced by Brazil, El Salvador and the Dominican Republic and how can these
constraints be overcome?
Multiple Choice
1. The Solow residual helps explain growth that derives from
(a) increasing the size of the labor force.
(b) increasing the size of the capital stock.
(c) increasing the capital-labor ratio.
(d) anything except increases in the size of the labor force or the capital stock.
2. In endogenous growth models, it is assumed that
(a) there are external economies from public or private investments.
(b) there are diminishing marginal returns to capital.
(c) growth is explained by forces outside the model.
(d) the capital-labor ratio is constant.
3. In contrast to the earlier neoclassical models of economic growth, in endogenous growth models,
there is more emphasis on
(a) human capital.
(b) externalities.
(c) increasing returns to scale.
(d) all of the above.
4. The new growth theory attempts to explain
(a) the rate of population growth within a country.
(b) the rate of capital accumulation within a country.
(c) the factors that determine the size of the Solow residual.
(d) why there are diminishing returns to capital.
5. The S-curve is used to illustrate
(a) the typical path taken by the current account over time.
(b) economic fluctuations in the economy.
(c) the typical growth path of a developing economy.
(d) the existence of multiple equilibria.
6. The big-push theory argues that coordination failures may arise because of
(a) pecuniary externalities.
(b) technological externalities.
(c) lack of human capital.
(d) all of the above.
7. The O-ring theory places emphasis on
(a) education of the labor force.
(b) skill complementarities.
(c) purchases of machinery and equipment by firms.
(d) none of the above.