BankUSA Credit Card Division Exhibit 3.9
Wait times for 500 Customers
26 137 415 68 66 87 67 174 108
358 30 325 195 63 54 72 280 65
218 43 58 61 265 119 135 118 667
71 70 68 253 159 97 9 16 28
190 233 62 557 78 186 76 138 23
36 185 303 94 66 143 166 61 52
45 128 314 66 94 147 333 89 69
68 113 40 10 69 187 80 23 406
45 79 9 149 109 155 114 78 23
66 182 18 89 61 91 79 61 77
132 83 30 253 162 68 392 53 81
372 81 95 189 190 317 429 234 62
125 87 315 20 35 79 109 111 93
16 61 141 75 53 47 66 37 201
37 105 26 102 68 245 67 38 39
116 66 189 46 98 82 174 70 134
145 46 43 60 38 55 112 112 69
160 139 132 277 202 70 118 52 201
276 141 19 65 15 65 83 350 316
132 78 29 169 65 64 203 295 18
124 265 273 122 86 67 147 78 46
180 66 167 186 876 450 614 69 71
111 194 98 87 127 323 128 21 51
119 93 98 24 139 249 88 84 33
75 82 92 197 87 173 122 116 144
164 156 36 59 66 90 200 134 139
39 115 64 203 146 208 30 54 54
698 50 81 86 66 77 376 82 83
46 262 67 132 197 41 153 70 70
172 130 52 311 156 148 227 57 48
151 73 47 175 49 272 233 211 158
83 82 163 69 46 76 106 124 77
166 107 61 191 66 371 129 44 33
78 83 88 248 75 55 461 88 260
68 64 182 67 117 31 315 117 45
502 156 149 357 47 69 164 250 237
83 81 83 136 65 193 142 89 87
139 204 17 49 189 136 73 57 72
19 76 85 315 268 143 96 98 40
44 148 466 41 40 72 25 182 24
117 426 139 141 88 143 87 125 195
38 102 87 96 70 255 305 128 191
176 65 116 12 67 79 53 295 99
128 131 97 111 133 100 60 88 118
18 518 98 30 85 51 62 60 80
427 329 15 118 268 72 74 84 236
72 714 77 57 37 391 82 209 106
145 203 97 66 49 27 83 43 48
185 14 204 74 74 63 206 31 209
74 131 19 79 223 143 220 108 320
35
216
68
40
70
128
138
44
89
118
292
475
215
149
224
61
62
65
62
108
289
35
72
86
94
134
45
55
29
268
31
232
64
205
137
16
425
158
159
74
61
379
147
60
62
40
248
145
176
141
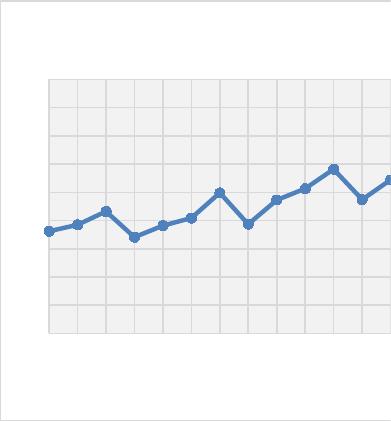
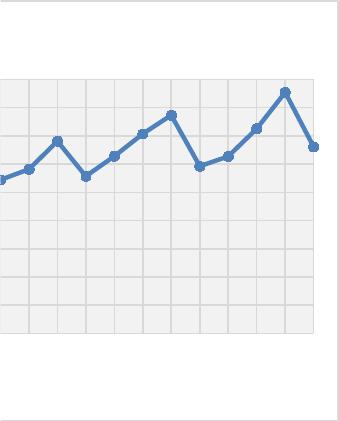
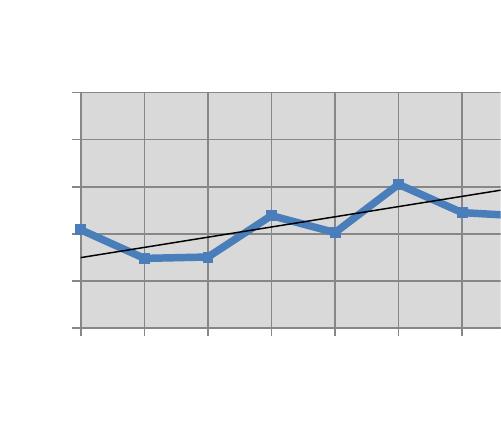
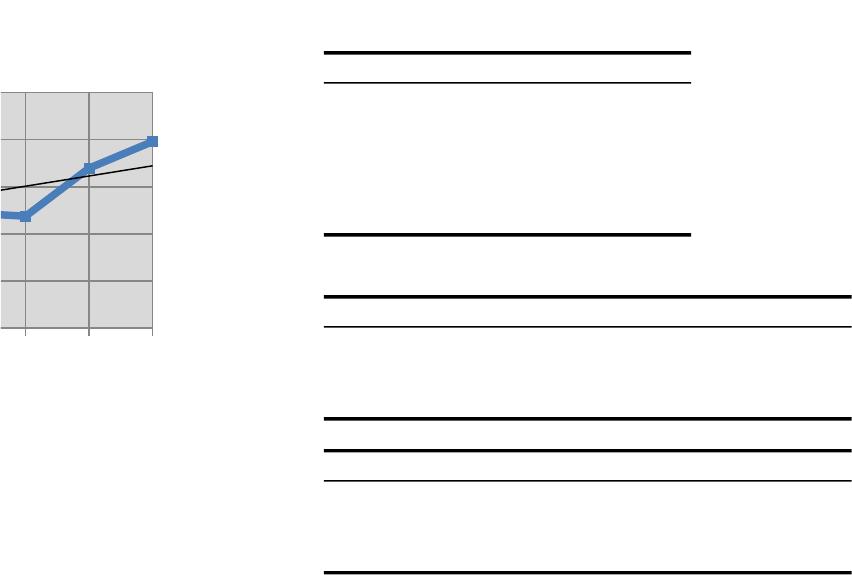
Call Center Volume
Period Year Quarter Call Volume
1 1 1 362
2 1 2 385
3 1 3 432
4 1 4 341
5 2 1 382
6 2 2 409
7 2 3 498
8 2 4 387
9 3 1 473
10 3 2 513
11 3 3 582
12 3 4 474
13 4 1 544
14 4 2 582
15 4 3 681
16 4 4 557
17 5 1 628
18 5 2 707
19 5 3 773
20 5 4 592
21 6 1 627
22 6 2 725
23 6 3 854
24 6 4 661
1 2 3 4 5 6 7 8 9 10 11 12 13 14 15 16 17 18 19 20 21 22 23 24
0
100
200
300
400
500
600
700
800
900
Call Volume
Quarter
1 2 3 4 5 6 7 8 9 10 11 12 13 14 15 16 17 18 19 20 21 22 23 24
0
100
200
300
400
500
600
700
800
900
Call Volume
Quarter

Forecast Error of Example Time-Series Data
Period Year Quarter Call Volume
1 1 1 362 343.8 18.20 331.24
2 1 2 385 361.6 23.40 547.56
3 1 3 432 379.4 52.60 2766.76
4 1 4 341 397.2 -56.20 3158.44
5 2 1 382 415 -33.00 1089.00
6 2 2 409 432.8 -23.80 566.44
7 2 3 498 450.6 47.40 2246.76
8 2 4 387 468.4 -81.40 6625.96
9 3 1 473 486.2 -13.20 174.24
10 3 2 513 504 9.00 81.00
11 3 3 582 521.8 60.20 3624.04
12 3 4 474 539.6 -65.60 4303.36
13 4 1 544 557.4 -13.40 179.56
14 4 2 582 575.2 6.80 46.24
15 4 3 681 593 88.00 7744.00
16 4 4 557 610.8 -53.80 2894.44
17 5 1 628 628.6 -0.60 0.36
18 5 2 707 646.4 60.60 3672.36
19 5 3 773 664.2 108.80 11837.44
20 5 4 592 682 -90.00 8100.00
21 6 1 627 699.8 -72.80 5299.84
22 6 2 725 717.6 7.40 54.76
23 6 3 854 735.4 118.60 14065.96
24 6 4 661 753.2 -92.20 8500.84
Sum 87910.60 Sum
MSE 3662.94 MAD
Forecast
Ft
Error
(At – Ft)
Squared
Error

18.2 5.03%
23.4 6.08%
52.6 12.18%
56.2 16.48%
33 8.64%
23.8 5.82%
47.4 9.52%
81.4 21.03%
13.2 2.79%
9 1.75%
60.2 10.34%
65.6 13.84%
13.4 2.46%
6.8 1.17%
88 12.92%
53.8 9.66%
0.6 0.10%
60.6 8.57%
108.8 14.08%
90 15.20%
72.8 11.61%
7.4 1.02%
118.6 13.89%
92.2 13.95%
1197 Sum 218.13%
49.88 MAPE 9.09%
Absolute
Deviation
Percentage
Error

Gas-Mart Monthly Milk Sales
Month Sales 2-Month MA Error 3-Month MA Error 4-Month MA Error
1172
2217
3190 194.5 -4.50
4233 203.5 29.50 193.00 40.00
5179 211.5 -32.50 213.33 -34.33 203.00 -24.00
6162 206 -44.00 200.67 -38.67 204.75 -42.75
7204 170.5 33.50 191.33 12.67 191.00 13.00
8180 183 -3.00 181.67 -1.67 194.50 -14.50
9225 192 33.00 182.00 43.00 181.25 43.75
10 250 202.5 47.50 203.00 47.00 192.75 57.25
11 151 237.5 -86.50 218.33 -67.33 214.75 -63.75
12 218 200.5 17.50 208.67 9.33 201.50 16.50
Sum
MSE

Squared Errors
2-Month MA 3-Month MA 4-Month MA
20.25
870.25 1600.00
1056.25 1178.78 576.00
1936.00 1495.11 1827.56
1122.25 160.44 169.00
9.00 2.78 210.25
1089.00 1849.00 1914.06
2256.25 2209.00 3277.56
7482.25 4533.78 4064.06
306.25 87.11 272.25
16147.75 13116.00 12310.75
1614.78 1457.33 1538.84
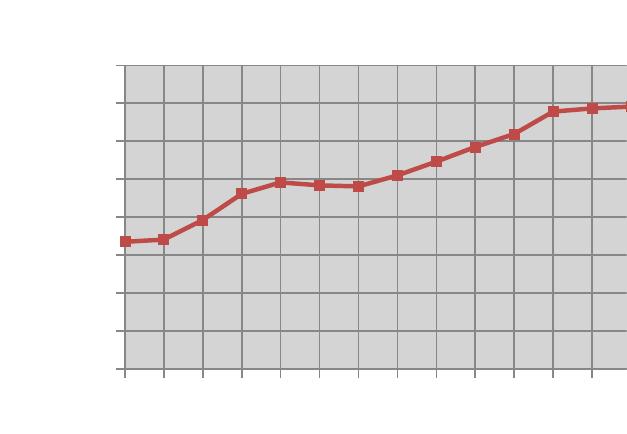
Factory Energy Costs
Year Energy Costs
1 $15,355.38
2 $15,412.91
3 $15,926.64
4 $16,614.18
5 $16,918.69
6 $16,837.14
7 $16,812.51
8 $17,102.45
9 $17,461.89
10 $17,846.76
11 $18,187.93
12 $18,782.19
13 $18,863.18
14 $18,914.00
15 $19,319.15
1 2 3 4 5 6 7 8 9 10 11 12 13 14 15
12000
13000
14000
15000
16000
17000
18000
19000
20000 Energy Costs
Year
1 2 3 4 5 6 7 8 9 10 11 12 13 14 15
12000
13000
14000
15000
16000
17000
18000
19000
20000 Energy Costs
Year
Gasoline Sales
Gallons Sold Week Price/Gallon
10420 1 $1.95
7388 2 $2.20
7529 3 $2.12
11932 4 $1.98
10125 5 $2.01
15240 6 $1.92
12246 7 $2.03
11852 8 $1.98
16967 9 $1.82
19782 10 $1.90
11 $1.80
1 2 3 4 5 6 7 8 9 10
0
5000
10000
15000
20000
25000
f(x) = 1084.7454545455x + 6382
R² = 0.6842280944
Gallons Sold
We ek
Multiple Regression Results (Exhibit 11.16)
Regression Statistics
Mul%ple R 0.9257350673
R Square 0.8569854149
Adjusted R Square 0.8161241048
Standard Error 1702.53287775
observation 10
ANOVA
df SS
Regression 2 121585603.501
Residual 7 20290327.3986
Total 9 141875930.9
Coefficients Standard Error
Intercept
47766.6537881
14279.3230844
Week 640.246251632 241.869697792
Price/Gallon -19557.964928 6725.84072703
1 2 3 4 5 6 7 8 9 10
0
5000
10000
15000
20000
25000
f(x) = 1084.7454545455x + 6382
R² = 0.6842280944
Gallons Sold
We ek

MS F Signiticance F
60792801.7507 20.973028374 0.0011061936
2898618.1998
t Stat P-value Lower 95% Upper 95% Lower 95.0% Upper 95.0%
3.3451623376 0.0123321616 14001.4201264
81531.8874498
14001.4201264
81531.8874498
2.6470709538 0.0330820572 68.3152985083 1212.17720475 68.3152985083 1212.17720475
-2.9078840433 0.022728987 -35462.051024 -3653.8788327 -35462.051024 -3653.8788327

Chapter 11 Problem 6
Time period Observation
1 1486
2 1345
3 1455
4 1386
5 1209
6 1178
7 1581
8 1332
9 1245
10 1521
11 1544
12 1502
13 1656
14 1701
15 1532

Chapter 11 Problem 9
Year Quarter Sales
114
1 2 2
131
145
2 1 6
2 2 4
2 3 4
2 4 14
3 1 10
3 2 3
335
3 4 16
4 1 12
4 2 9
437
4 4 22
5 1 18
5 2 10
5 3 13
5 4 35

Chapter 11 Problem 14
Week Actual Demand Manager’s Forecast
1 4,000 4,500
2 4,200 5,000
3 4,200 4,000
4 3,000 3,800
5 3,800 3,600
6 5,000 4,000
7 5,600 5,000
8 4,400 4,800
9 5,000 4,000
10 4,800 5,000
Chapter 11 Case Data
Day Call Volume
1 288
2 336
3 295
4 251
5 280
6 300
7 398
8 418
9 422
10 471
11 522
12 502
13 449
14 452
15 420
16 423

Chapter 12 Problem 3
SKU Item Cost Annual Demand
WC007 $0.90 225
WC008 $1.20 22,500
WC219 $0.15 13,000
WC397 $4.65 12,300
WC419 $0.45 6,500
WC654 $2.10 350
WC713 $9.45 1,500
WC887 $0.41 6,200
WC916 $3.25 400
WC971 $7.50 2,950
WC532 $1.32 4,650
WC413 $0.86 16,500
WC759 $8.53 900

Chapter 12 Problem 4
Annual Unit
Item Usage Value
1 8800 $68.12
2 9800 $58.25
3 23600 $75.25
4 40000 $53.14
5 60000 $26.33
6 165000 $4.52
7 112000 $7.59
8 198000 $3.19
9 210000 $2.98
10 168000 $4.27
11 100000 $9.00
12 7000 $13.57

Chapter 12 Problem 5
Annual Unit
Item Usage Cost
1 1000 $125.00
2 5000 $67.00
3 1350 $25.30
4 1600 $42.90
5 2700 $51.75
6 4750 $17.30
7 6300 $35.80
8 2400 $14.60
9 2000 $15.40
10 500 $40.50
11 820 $82.60
12 5800 $35.62
13 9000 $44.90
14 8200 $3.60
15 750 $55.70
16 6000 $4.50
17 3200 $6.80
18 8500 $10.20
19 6200 $32.60
20 2400 $19.51
Chapter 13 Case Data (Exhibit 13.22)
Number of Number of
Abandon Busy Signal
Number of Calls by Calls
Time Period Calls Taken Customer Not Taken Total Calls
6:30 15 0 0 15
7:00 16 0 0 16
7:30 45 4 0 49
8:00 60 5 0 65
8:30 62 6 2 70
9:00 71 4 1 76
9:30 77 5 0 82
10:00 84 11 4 99
10:30 75 8 3 86
11:00 81 4 3 88
11:30 69 6 1 76
12:00 79 2 0 81
12:30 66 3 2 71
1:00 80 4 3 87
1:30 76 8 6 90
2:00 92 6 7 105
2:30 85 7 5 97
3:00 73 4 3 80
3:30 78 2 3 83
4:00 67 4 4 75
4:30 62 2 0 64
5:00 54 1 0 55
5:30 51 1 1 53
6:00 37 0 0 37
6:30 48 3 2 53
7:00 42 0 0 42
7:30 32 0 0 32
8:00 26 2 0 28
8:30 22 1 0 23
9:00 19 0 0 19
Totals 1744 103 50 1897
Average 58.1 3.4 1.7 63.2
Std Deviation 22.9 2.8 2.0 26.6
Minimum 15 0 0 15
Maximum 92 11 7 105
Service Rep 6:30 7:00 7:30 8:00 8:30 9:00 9:30 10:00 10:30 11:00
1X——— ————— ————— ————— —————– (—-)——- ————— ————— (Lunch) (Lunch)
2X——— ————— ————— ————— —————– —–(—-) ————— ————— ————— (Lunch)
3X——— ————— —————– ————— (—-)——- ————— ————— —————
4X——— —————– ————— —–(—-) ————— ————— —————
5X——— —————– ————— ————— ————— ————— —————
6X——— ————— ————— ————— —————
7X——— —————
8X——— —————
9X———
10
11
12
13
Avail CSR (Min) 60 60 90 150 150 150 150 180 210 210
Current # CSRs 2 2 3 5 5 5 5 6 7 7
Target # CSRs
Short/Excess (-/+)
11:30 12:00 12:30 PM 1:00 1:30 2:00
————— ————— ————— —–(—-) ————— ———–
(Lunch) ————— ————— ————— (—-)——- ———–
(Lunch) (Lunch) ————— ————— (—-)——- —————
————— (Lunch) (Lunch) ————— —–(—-) —————
(—-)——- ————— (Lunch) (Lunch) ————— (—-)—–
—–(—-) ————— (Lunch) (Lunch) ————— —–(—-)
————— (—-)——- ————— (Lunch) (Lunch) —————
————— —–(—-) ————— ————— (Lunch) (Lunch)
————— ————— ————— (—-)—– (Lunch) (Lunch)
180 180 180 150 135 180
6 6 6 5 4.5 6
Bill & Becky Travel
Customer Number NPS Rating
1 9
2 9
3 7
4 8
5 6
6 7
7 7
8 7
9 6
10 8
11 7
12 9
13 6
14 8
15 9
16 3
17 10
18 10
19 10
20 8
21 8
22 6
23 6
24 9
25 10
26 10
27 9
28 10
29 9
30 7
31 9
32 10
33 8
34 10
35 10
36 6
37 6
38 5
39 9
40 7
41 7
42 8
43 6
44 5
45 10
46 7
47 9
48 10
49 9
50 10
51 8
52 10
53 10
54 7
55 8
56 9
57 9
58 10
59 6
60 6
61 2
62 9
63 10
64 7
65 8
66 9
67 10
68 6
69 7
70 10
71 10
72 7
73 8
74 8
75 10
76 10
77 10
78 6
79 5
80 10
81 8
82 7
83 8
84 6
85 9
86 7
87 10
88 10
89 8
90 9
91 9
92 4
93 10
94 7
95 10
96 9
97 10
98 5
99 9
100 10
101 9
102 10
103 9
104 4
105 10
106 9
107 9
108 10
109 9
110 5
111 10
112 7
113 9
114 10
115 6
116 8
117 7
118 9
119 10
120 10
121 6
122 10
123 9
124 10
125 7
126 5
127 7
128 9
129 9
130 6
131 1
132 10
133 10
134 7
135 8
136 10
137 2
138 10
139 7
140 5
141 9
142 6
143 4
144 9
145 10
146 9
147 7
148 10
149 9
150 10
151 3
152 9
153 10
154 9
155 7
156 9
157 9
158 7
159 10
160 8
161 10
162 5
163 9
164 6
165 6
166 3
167 9
168 10
169 5
170 10
171 8
172 10
173 9
174 9
175 8
176 4
177 9
178 10
179 6
180 7
181 8
182 10
183 8
184 9
185 10
186 9
187 4
188 9
189 6
190 9
191 9
192 10
193 9
194 8
195 8
196 9
197 10
198 6
199 10
200 8
Chapter 16 Problem 4
Sample
1 2 3 4 5 6 7 8 9 10 11 12
Observations 3.55 3.61 3.61 4.13 4.06 3.48 3.25 4.25 4.35 3.62 4.09 3.38
3.64 3.42 3.36 3.50 3.28 4.32 3.58 3.38 3.64 3.61 3.28 3.15
2.98 3.12 4.34 3.61 3.07 3.71 3.51 3.00 3.20 3.43 3.12 3.09
13 14 15 16 17 18 19 20 21 22 23 24 25 26 27 28 29
3.85 3.59 3.60 4.10 3.07 2.86 3.68 2.90 3.57 3.82 3.82 4.14 3.97 3.77 4.12 3.92 3.50
3.44 3.61 4.01 3.57 3.18 3.69 3.59 3.41 3.63 3.55 4.91 3.83 4.34 3.60 3.38 4.60 4.08
4.06 3.34 2.84 3.28 3.11 3.05 3.93 3.37 4.33 3.56 3.80 3.80 3.65 3.81 3.37 3.54 4.09
30
4.23
3.62
3.00

Chapter 16 Problem 5
Day Branch 1 Branch 2 Branch 3 Branch 4
1 16 13 24 21
2 14 15 21 16
3 24 19 21 10
4 21 16 29 8
5 12 16 24 14
6 25 12 27 11
7 14 21 23 10
8 10 27 39 23
9 23 15 31 20
10 23 8 23 8
11 17 10 26 21
12 24 24 26 24
13 13 14 19 19
14 9 21 24 13
15 12 9 28 22
16 26 11 14 24
17 20 13 18 23
18 5 20 30 7
19 8 13 22 7
20 28 23 35 12
21 25 14 14 20
22 12 11 31 17
23 21 13 17 23
24 20 23 33 20
25 8 12 43 5

Chapter 16 Problem 7
Day Number Nonconforming
1 2
2 1
3 0
4 3
5 0
6 1
7 0
8 2
9 0
10 1
11 3
12 0
13 10
14 2
15 1
16 4
17 0
18 3
19 8
20 1
21 0
22 2
23 0
24 2
25 2

Chapter 16 Problem 8
Day Busy signals
1 20
2 32
3 23
4 18
5 24
6 21
7 35
8 23
9 21
10 25
11 22
12 29
13 22
14 28
15 21
16 34
17 30
18 35
19 42
20 36
21 39
22 32
23 35
24 29
25 31
26 41
27 31
28 38
29 31
30 35

Chapter 16 Problem 10
Sample Number of Errors
1 7
2 15
3 13
4 8
5 17
6 12
7 28
8 17
9 20
10 14
11 9
12 16
13 22
14 6
15 12
16 24
17 19
18 15
19 13
20 6

Chapter 16 Problem 11
Order Errors
1 0
2 0
3 2
4 0
5 1
6 0
7 0
8 0
9 1
10 0
11 0
12 2
13 0
14 0
15 1
16 0
17 0
18 1
19 0
20 0
21 0
22 0
23 1
24 0
25 0
26 1
27 0
28 0
29 2
30 0
31 1
32 1
33 0
34 0
35 0
36 0
37 1
38 0
39 2
40 1
Chapter 16 Problem 12
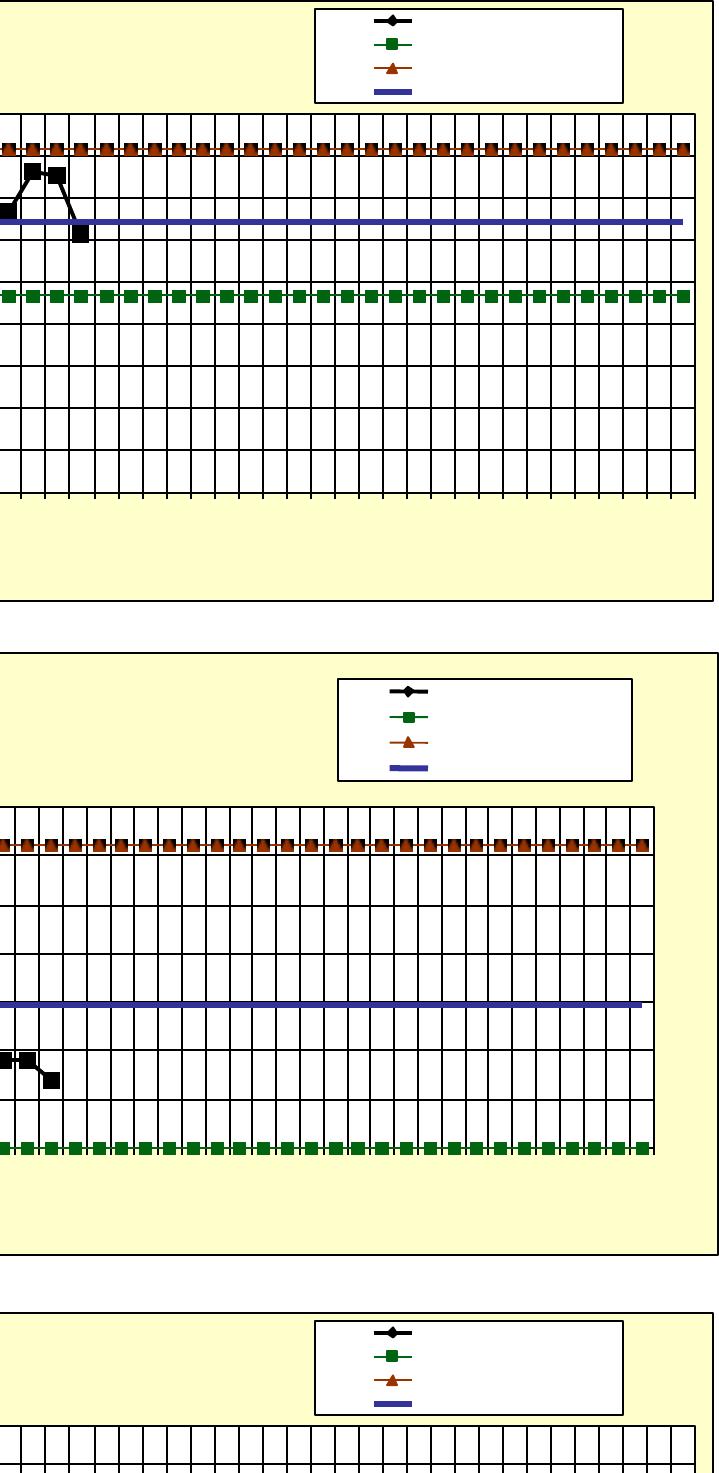
Chart 1
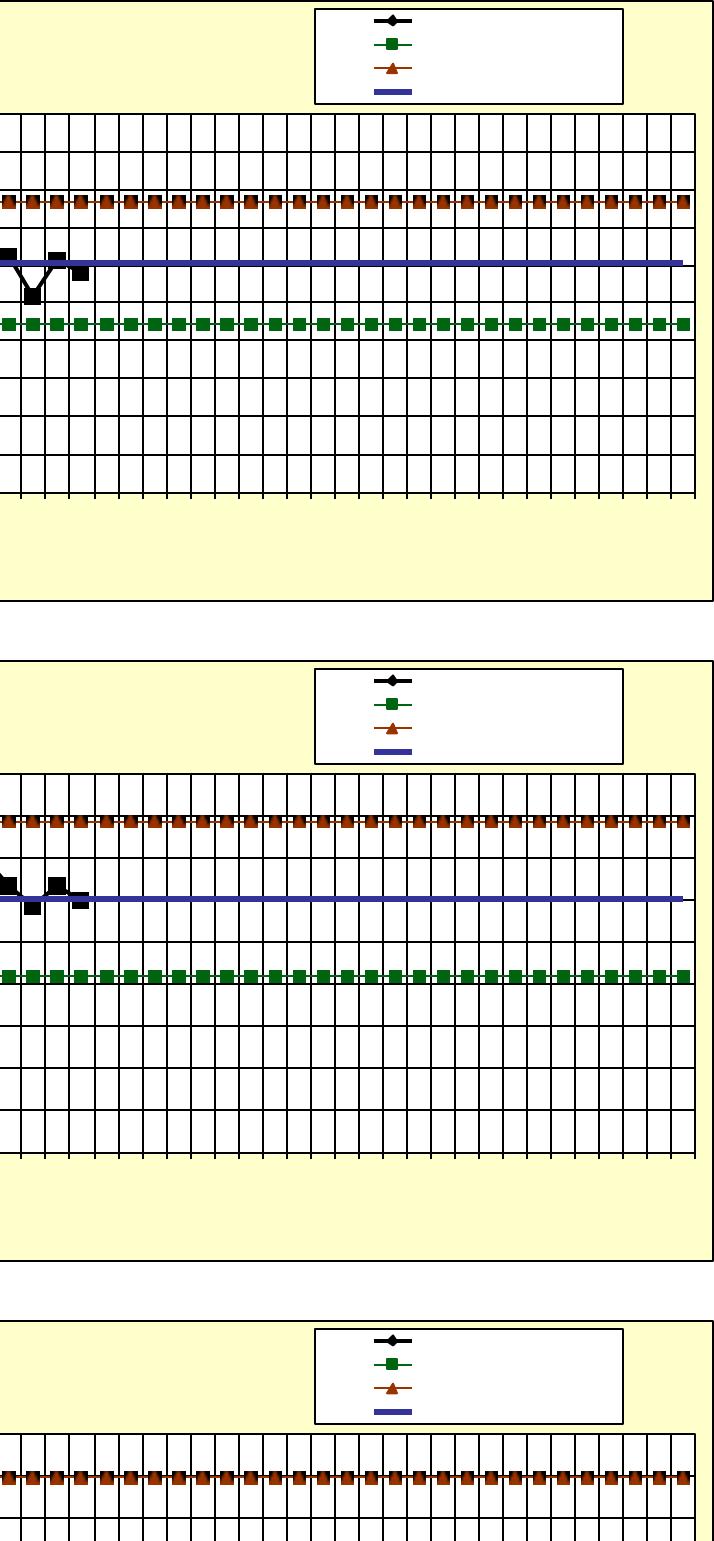
Chart 2
3
3.5
4
4.5
5
5.5
6
6.5
7
7.5
1 3 5 7 9 11 13 15 17 19 21 23 25 27 29 31 33 35 37 39 41 43 45 47 49
Averages
Sample number
X–bar Chart
Averages
Lower control limit
Upper control limit
Center line
0
0.5
1
1.5
2
2.5
3
3.5
1 3 5 7 9 11 13 15 17 19 21 23 25 27 29 31 33 35 37 39 41 43 45 47 49
Ranges
Sample number
R–Chart Ranges
Lower control limit
Upper control limit
Center line
3
3.5
4
4.5
5
5.5
6
6.5
7
7.5
8
1 3 5 7 9 11 13 15 17 19 21 23 25 27 29 31 33 35 37 39 41 43 45 47 49
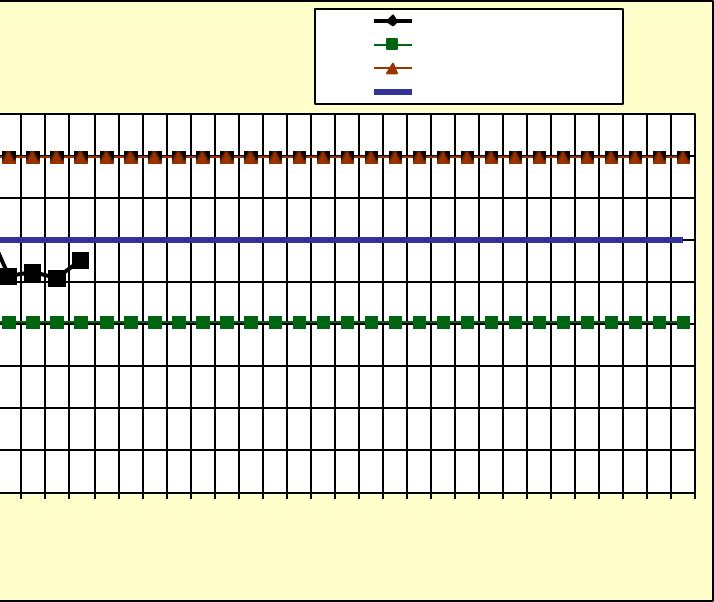
Averages
Sample number
X–bar Chart
Averages
Lower control limit
Upper control limit
Center line
Chart 3
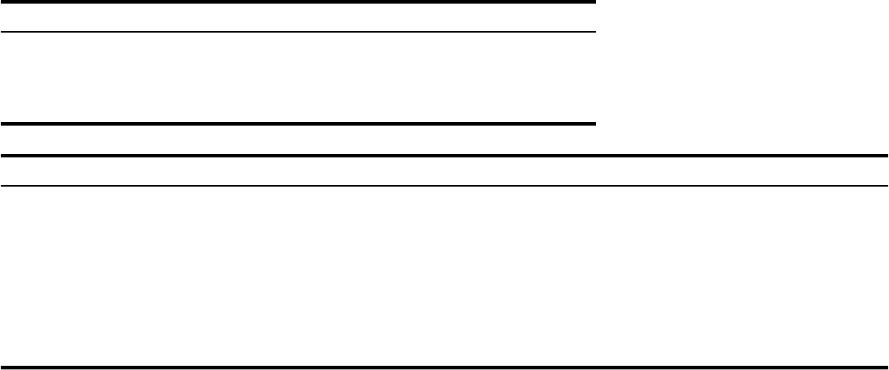
Chart 4
Chart 5
3
3.5
4
4.5
5
5.5
6
6.5
7
7.5
1 3 5 7 9 11 13 15 17 19 21 23 25 27 29 31 33 35 37 39 41 43 45 47 49
Averages
Sample number
X–bar Chart
Averages
Lower control limit
Upper control limit
Center line
3
3.5
4
4.5
5
5.5
6
6.5
7
7.5
8
1 3 5 7 9 11 13 15 17 19 21 23 25 27 29 31 33 35 37 39 41 43 45 47 49
Averages
Sample number
X–bar Chart
Averages
Lower control limit
Upper control limit
Center line
3
3.5
4
4.5
5
5.5
6
6.5
7
7.5
1 3 5 7 9 11 13 15 17 19 21 23 25 27 29 31 33 35 37 39 41 43 45 47 49
Averages
Sample number
X–bar Chart
Averages
Lower control limit
Upper control limit
Center line
3
3.5
4
4.5
5
5.5
6
6.5
7
7.5
1 3 5 7 9 11 13 15 17 19 21 23 25 27 29 31 33 35 37 39 41 43 45 47 49
Averages
Sample number
X–bar Chart
Averages
Lower control limit
Upper control limit
Center line
3
3.5
4
4.5
5
5.5
6
6.5
7
7.5
1 3 5 7 9 11 13 15 17 19 21 23 25 27 29 31 33 35 37 39 41 43 45 47 49
Averages
Sample number
X–bar Chart
Averages
Lower control limit
Upper control limit
Center line
0
0.5
1
1.5
2
2.5
3
3.5
1 3 5 7 9 11 13 15 17 19 21 23 25 27 29 31 33 35 37 39 41 43 45 47 49
Ranges
Sample number
R–Chart Ranges
Lower control limit
Upper control limit
Center line
3
3.5
4
4.5
5
5.5
6
6.5
7
7.5
8
1 3 5 7 9 11 13 15 17 19 21 23 25 27 29 31 33 35 37 39 41 43 45 47 49
Averages
Sample number
X–bar Chart
Averages
Lower control limit
Upper control limit
Center line
3
3.5
4
4.5
5
5.5
6
6.5
7
7.5
1 3 5 7 9 11 13 15 17 19 21 23 25 27 29 31 33 35 37 39 41 43 45 47 49
Averages
Sample number
X–bar Chart
Averages
Lower control limit
Upper control limit
Center line
3
3.5
4
4.5
5
5.5
6
6.5
7
7.5
1 3 5 7 9 11 13 15 17 19 21 23 25 27 29 31 33 35 37 39 41 43 45 47 49
Averages
Sample number
X–bar Chart
Averages
Lower control limit
Upper control limit
Center line
Chapter 16 Problem 15
2.7 1.8 2.3 1.1 2.8 3.3 3.3
3.3 3.1 3.5 2.8 3.8 3.5 1.0
3.2 0.7 1.9 0.5 2.6 3.2 1.2
2.2 3.5 1.0 1.5 3.2 1.5 2.8
1.4 1.7 3.1 3.3 2.2 1.0 2.7
1.9 3.3 3.9 2.8 1.0 1.5 0.9
3.3 3.4 1.1 0.8 3.3 3.9 2.6
2.9 1.8 3.2 1.5 0.9 1.3 1.4
1.5 2.8 3.5 2.8 2.4 3.1 1.2
3.4 2.0 2.0 0.8 3.6 2.3 3.5
3.6 2.1 1.0 1.4 2.2
1.9 1.6 3.5 3.2 3.6
1.5 3.6 3.2 2.4 0.7
0.8 3.7 3.4 1.9 2.3
3.5 0.7 1.2 2.5 2.7
3.1 1.2 3.7 3.2 1.6
3.8 3.1 3.5 3.6 2.1
0.8 1.1 2.7 1.0 3.4
3.3 1.4 2.3 0.8 3.1
1.9 1.9 3.7 3.3 1.6

Chapter 16 Case Data
Note: Each sample consists of 275 packing slips.
Number of Errors in Each Error Category
Sample Total Errors A B C D E
1 15 6 3 4 1 1
2 13 4 3 3 0 3
3 15 6 4 2 3 0
4 3 01101
5 7 2 3 1 1 0
6 11 4 3 2 1 1
7 8 3 2 1 2 0
8 8 4 2 1 0 1
9 11 5 4 0 1 1
10 12 5 3 2 1 1
11 12 4 4 1 2 1
12 6 2 1 2 0 1
13 11 4 4 1 2 0
14 8 2 3 1 1 1
15 4 1 0 1 2 0
16 10 4 3 2 0 1
17 8 4 1 2 1 0
18 8 3 2 1 2 0
19 3 2 0 1 0 0
20 8 3 2 2 1 0
21 13 6 1 1 2 3
22 13 5 3 2 3 0
23 7 3 2 1 0 1
24 4 1 1 2 0 0
25 7 4 1 1 0 1
26 4 2 1 0 1 0
27 5 2 2 1 0 0
28 8 3 3 1 1 0
29 8 1 4 2 0 1
30 5 2 1 1 1 0
31 3 0 2 0 0 1
32 8 5 2 0 1 0
33 13 5 4 3 0 1
34 6 2 1 2 1 0
35 13 4 3 3 2 1
36 5 2 1 1 0 1
37 5 1 2 0 1 1
38 3 1 0 1 0 1
39 8 4 1 2 1 0
40 4 0 3 0 1 0
41 6 2 3 1 0 0
42 7 3 2 0 1 1
43 4 1 1 1 0 1
44 11 3 4 3 1 0
45 13 5 2 3 2 1
46 6 2 2 1 1 0
47 6 2 1 2 0 1
48 8 3 2 1 1 1
49 9 4 3 1 1 0
50 3 1 1 0 1 0

Time Poles Wire Cross arms Insulators Guy wires SUMMARY OUTPUT
8 1 4 1 2 1
14 2 10 2 4 0 Regression Statistics
17.5 3 6 3 6 1 Mul%ple R 0.999883766
7 1 2.5 2 3 0 R Square 0.999767546
16 2 10 4 6 0 Adjusted R Square 0.999622263
37.5 4 24 8 12 2 Standard Error 0.199955077
39.5 4 33 7 11 1 observation 14
10.5 1 3 2 4 2
17 2 8 4 8 1 ANOVA
23.5 3 12 6 12 0 df
16.5 2 12 2 4 1 Regression 5
22 3 18 3 6 0 Residual 8
8.5 1 5 2 3 0 Total 13
28.5 4 12 8 12 0
Coefficients
Intercept 0.237091444
Poles 2.804085742
Wire 0.513567216
Cross arms 1.090405281
Insulators 0.170334993
Guy wires 1.500986653
SS MS F Signiticance F
1375.68014374 275.1360287 6881.491748 2.63388E-014
0.3198562624 0.039982033
1376
Standard Error t Stat P-value Lower 95% Upper 95% Lower 95.0%
0.1428122526 1.660161786 0.135462338 -0.092234201 0.566417089 -0.092234201
0.1280230029 21.90298367 1.99219E-008 2.5088641681 3.099307316 2.5088641681
0.0111680942 45.98521515 5.52546E-011 0.4878135442 0.539320887 0.4878135442
0.096996889 11.24165209 3.52015E-006 0.8667300535 1.314080508 0.8667300535
0.0650235664 2.619588596 0.030670058 0.02039038 0.320279606 0.02039038
0.0763610547 19.65644214 4.66801E-008 1.3248977455 1.677075561 1.3248977455
Upper 95.0%
0.566417089
3.099307316
0.539320887
1.314080508
0.320279606
1.677075561
SCC – SoDwater
Page 52
Softwater, Inc. Linear Program
Problem Data
Product 40-lb bag 80-lb bag Right-hand
Profit/unit $ 2.00 $ 4.00 side
Packaging line 1.2 3 <= 1,500
Materials availability 6 10 <= 6,000
Agg. production 40 80 >= 16,000
Decision Variables
Product 40-lb bag 80-lb bag
Amount produced 0 0
Constraints
Packaging line 0
Materials availability 0
Agg. production 0
Profit $ –
SCC – transportation
Page 53
Transportation Model
Problem Data
Fairport Mendon Penfield Supply
Corning 16 10 14 600
Geneva 12 12 20 300
Demand 300 200 300
Decision variables and Constraints
Fairport Mendon Penfield Amount Shipped
Corning 0 200 300 500
Geneva 300 0 0 300
Amount Shipped 300 200 300
Total cost ($000) $ 9,800.00
A B C D E
1
2
3
4
5
6
7
8
9
10
11
12
13
14
15
16
17