
OM5 C3 IM
9. Customers call a call center to make room reservations for a small chain of 42 motels
located throughout the southwestern part of the United States. Business analytics is
used to determine how and if the following performance metrics are related: time by
quarter, average time on hold (seconds) before a customer reaches a company
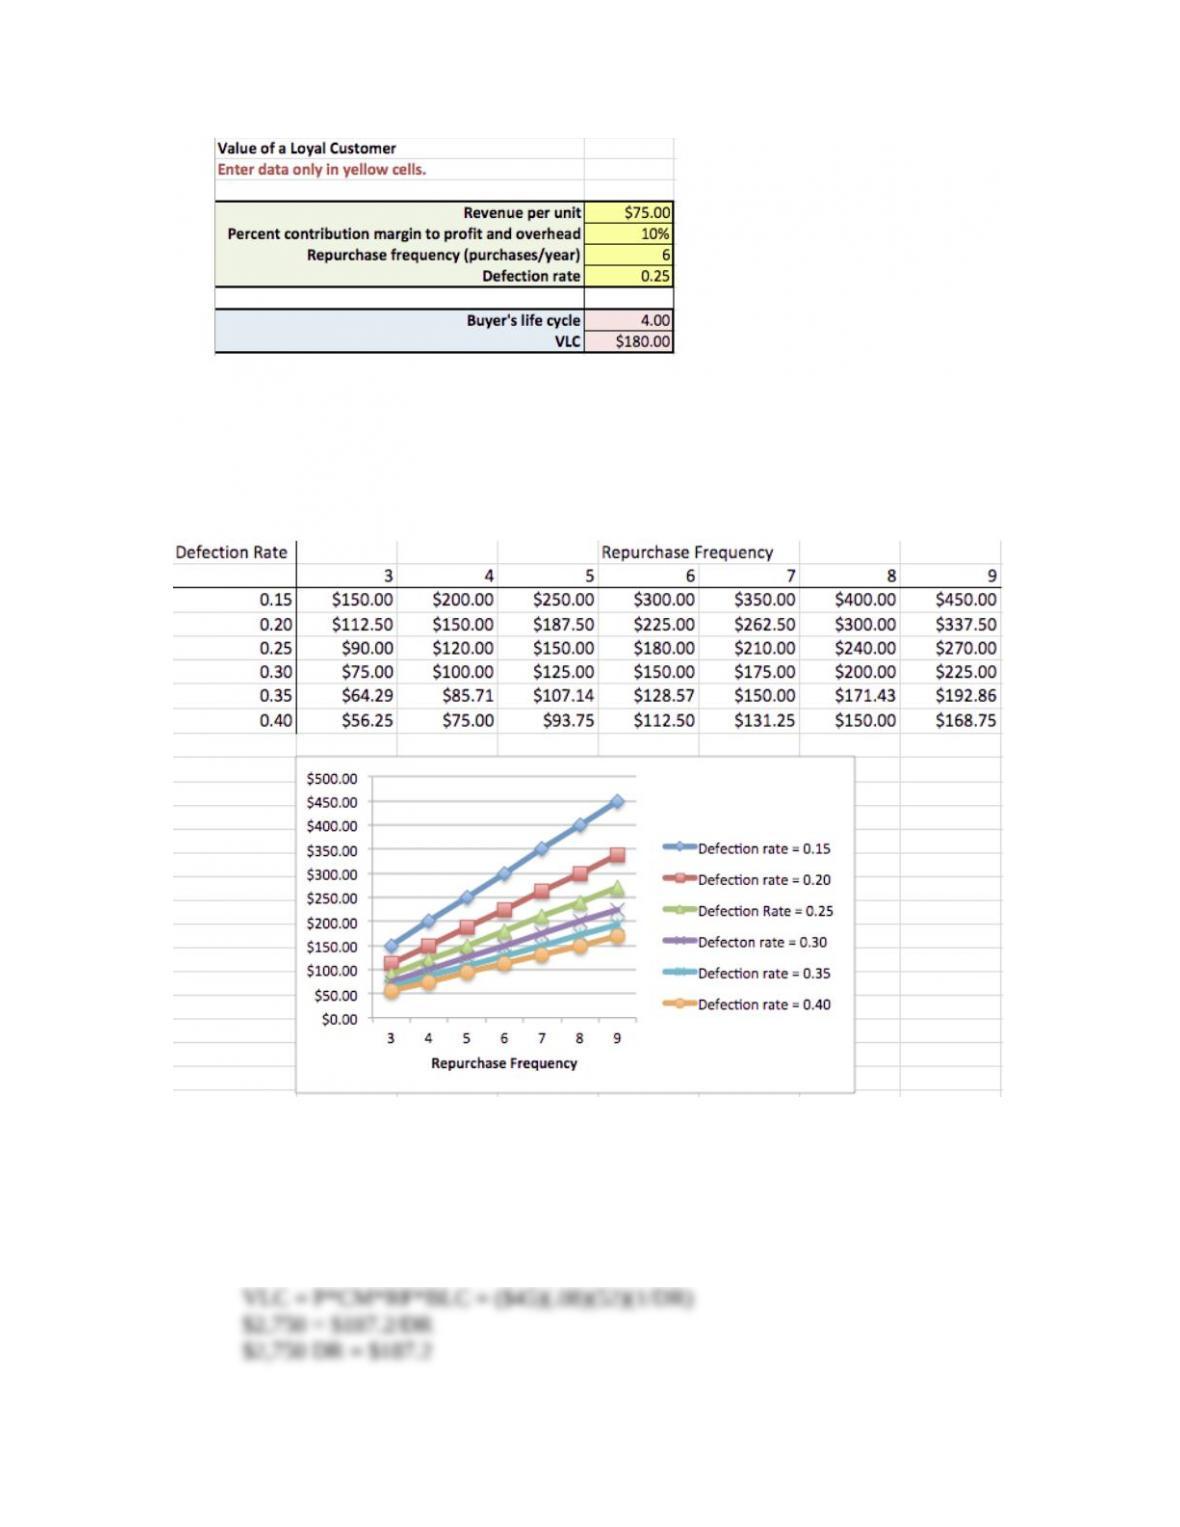
customer service representative, percent of time the customer inquiry is solved the
first time (called first pass quality) and customer satisfaction with the overall call
center experience.
Average Percent Solved Overall Customer
Quarter Hold Time First Time Satisfaction Percent
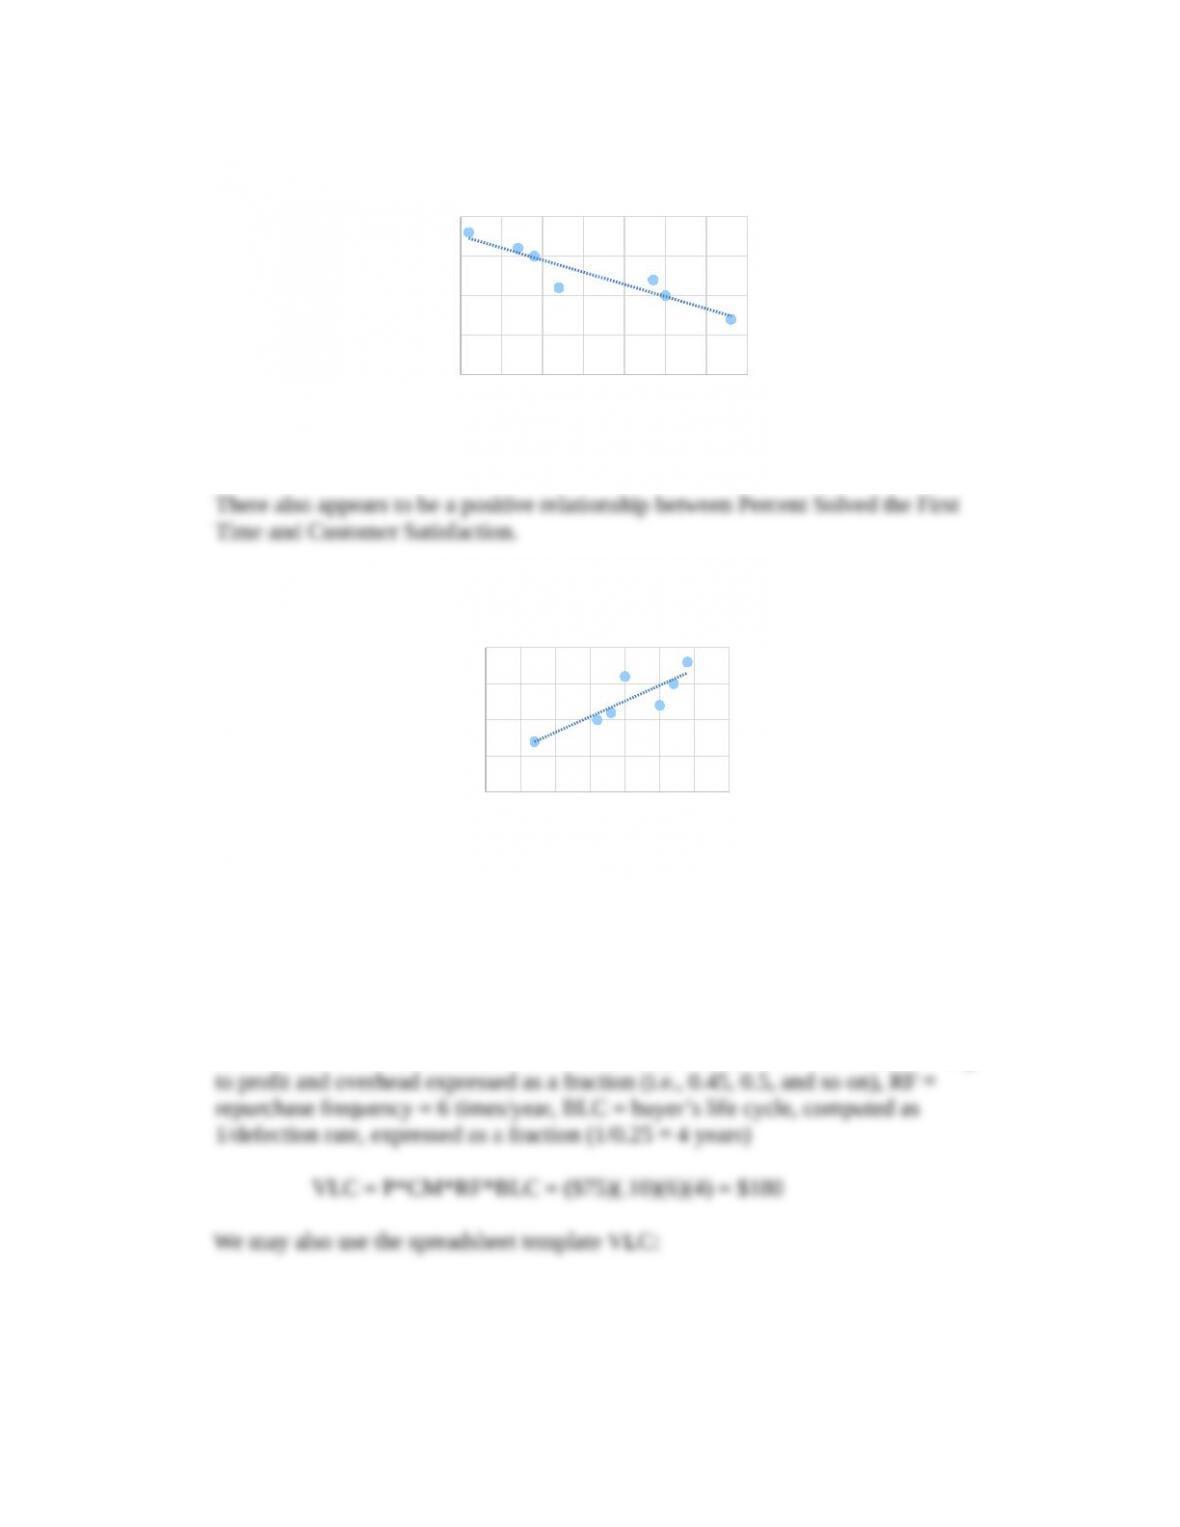
Develop a graphical interlinking model by constructing scatter charts showing the
The charts below suggest that as the average hold time increases, both the percent
Instructors might wish to illustrate how to add a trendline to a scatter chart (right
10 20 30 40 50 60 70 80 90
60%
65%
70%
75%
80%
85%
90%
95%
Percent Solved vs Hold Time
Average Hold Time
Percent Solved First Time
1
OM5 C3 IM
20 30 40 50 60 70 80 90
60%
70%
80%
90%
100%
Customer Satisfaction vs Hold TIme
Average Hold Time
Overall Satisfaction
60%65%70%75%80%85%90%95%
60%
70%
80%
90%
100%
Customer Satisfaction vs Percent Solved First TIme
Percent Solved First Time
Customer Satisfaction
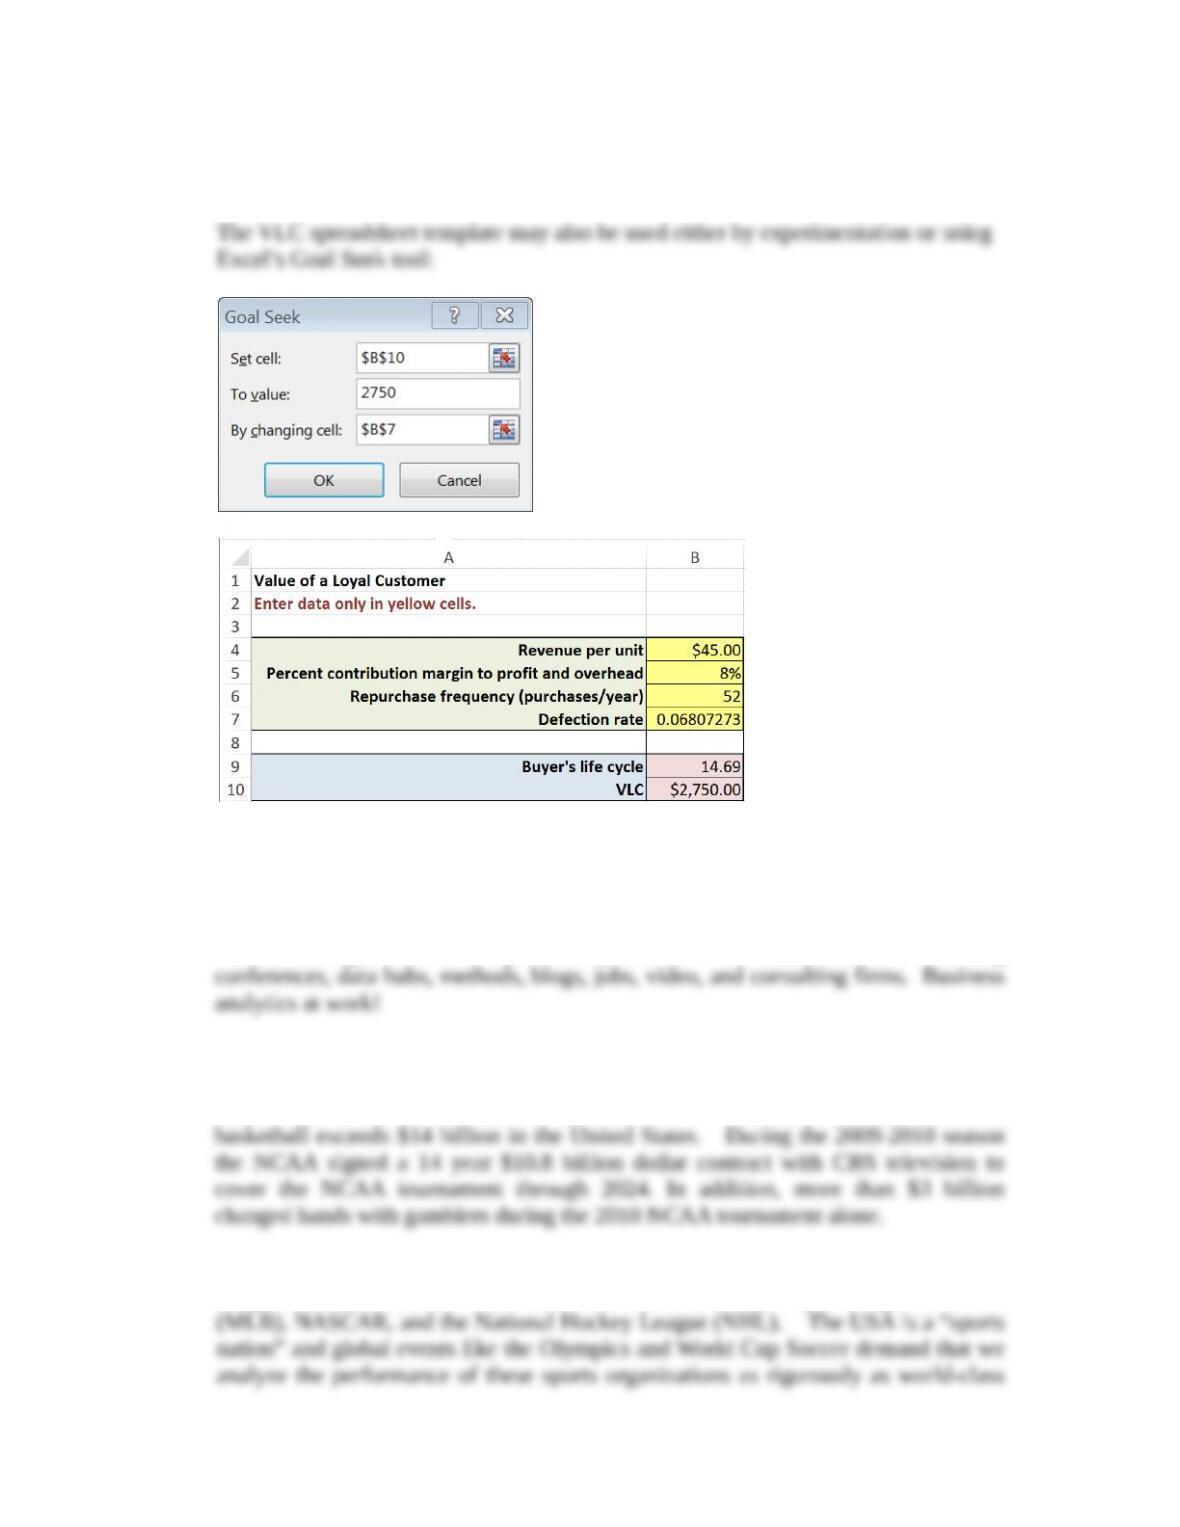
10.* What is the average value of a loyal customer (VLC) in a target market segment if
the average purchase price is $75 per visit, the frequency of repurchase is six times
per year, the contribution margin is 10 percent, and the average customer defection
rate is 25 percent?
VLC = P*CM*RF*BLC, where P = the revenue per unit, CM = contribution margin
2
OM5 C3 IM
11.* Using the base case data in question 10, analyze how the value of a loyal customer
(VLC) will change if the average customer defection rate varies between 15 and 40
percent (in increments of 5 percent) and the frequency of repurchase varies between
3 and 9 times per year (in increments of 1 year). Sketch graphs (or use Excel charts)
to illustrate the impact of these assumptions on the VLC.
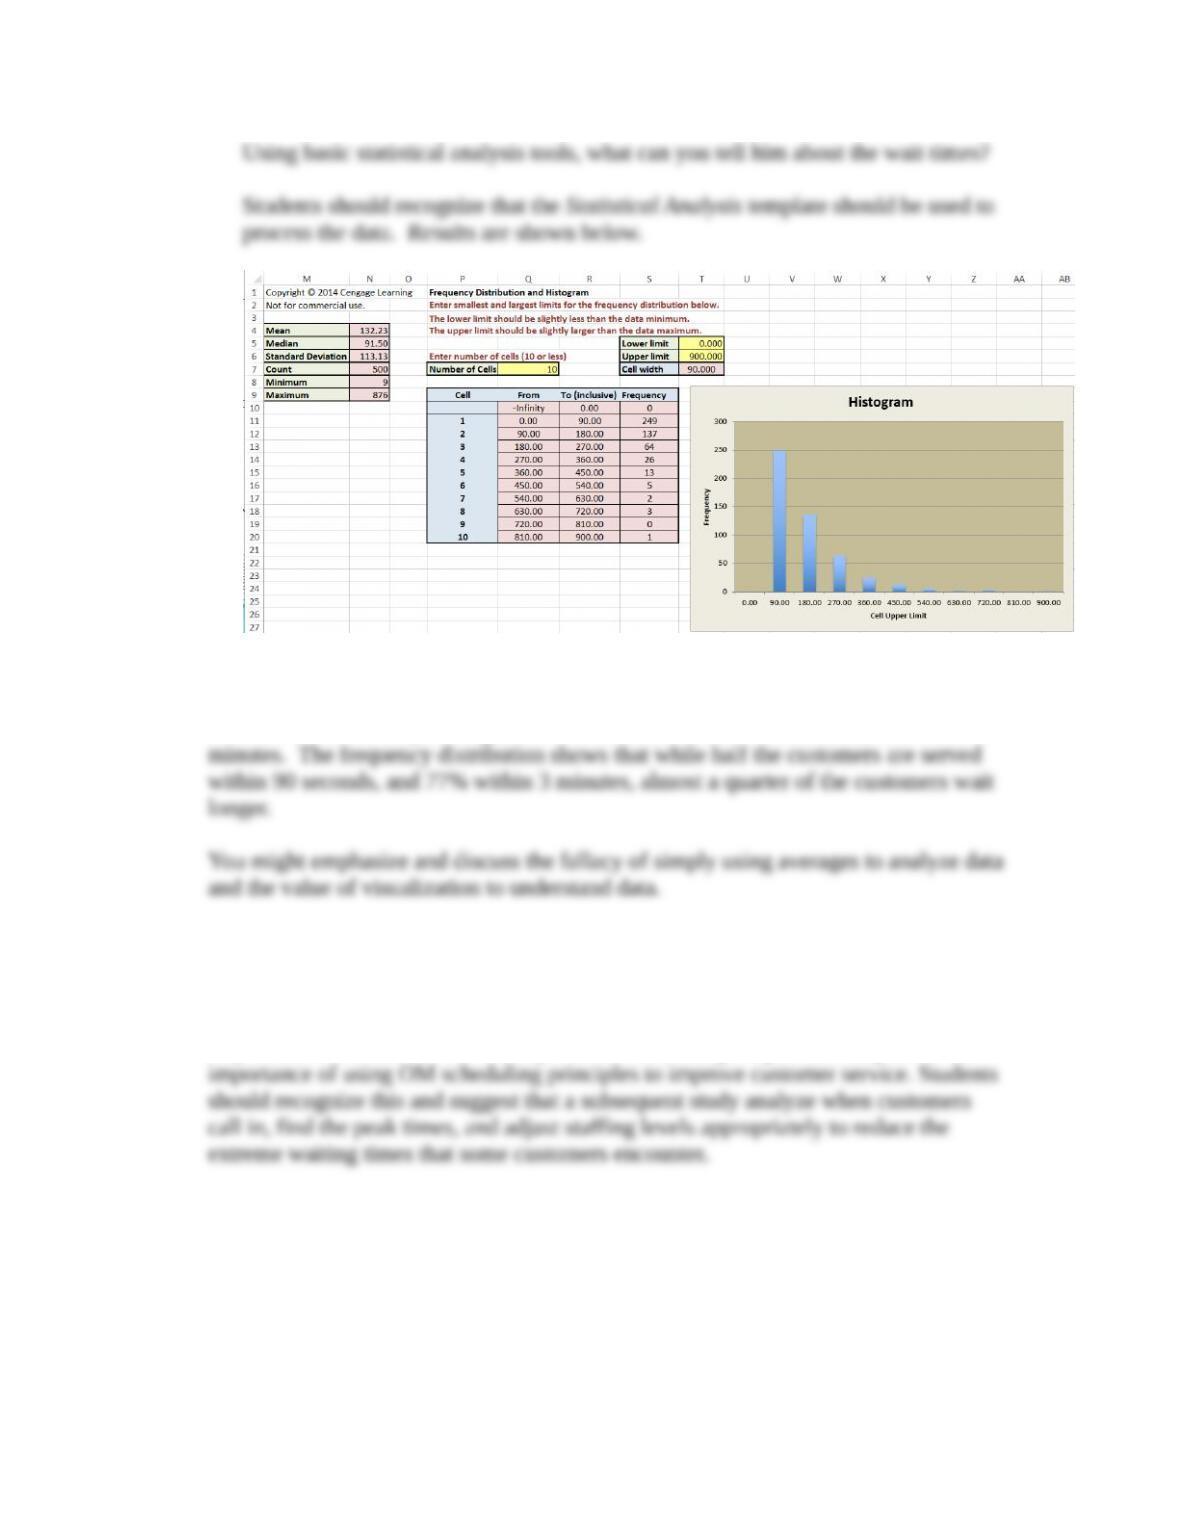
12.* What is the average defection rate for grocery store shoppers in a local area of a
large city if they spend $45 per visit, shop 52 weeks per year, the grocery store has a
8 percent gross margin, and the value of a loyal customer is estimated at $2,750 per
year?
3
OM5 C3 IM
DR = 0.068 (The average customer defection rate is 6.8%.)
13. Research and write a short paper on how sports analytics is used by some
professional team.
A recent Google search on “sports analytics” results in 57,700,000 hits including
Today, coaches, players, investors, and owners need to take full advantage of modern
analytical methods and digital video software capabilities to make the most efficient
use of a team’s resources. For example, the economic impact of Division I NCAA
Similar economic statistics document the importance of the National Football
League (NFL), National Basketball Association (NBA), Major League Baseball
4

OM5 C3 IM
14. Go to the Baldrige Web site and find the links to the most recent award recipients.
Review one of the application summaries and describe the types of performance
measures that these companies use.
The Baldrige application summaries are excellent sources of information to learn
about best practices. Categories 4 and 7 provide good examples of the types of
15. The balanced scorecard was originally developed by Arthur M. Schneiderman at
Analog Devices. Visit his Web site, www.schneiderman.com, and read the articles to
answer the following questions:
a. How was the first balanced scorecard developed? (Click The Scorecard link
b. What steps should an organization follow to build a good balanced scorecard?
c. Why do balanced scorecards fail? (Find “Why Balanced Scorecards Fail”)
This Web site provides interesting history about the balanced scorecard and a host
Case Teaching Notes: BankUSA Credit Card Division
Overview
The Credit Card Division is a profit center and has experienced a 20 percent annual
growth rate over the last five years. The Credit Card Division processes two types of
credit (bank) cards – a traditional individual credit and a corporate card. These credit
card services include producing and mailing the plastic credit cards to customers,
preparing and mailing monthly statements to customers, handling all customer requests
such as stop payments and customer complaints, and preparation and distribution of
summary reports to all internal and external customers. In response to complaints about
excessive wait times, the call center manager collected a sample of 500 customer wait
times, but did not know how to analyze the data.
Case Questions and Brief Answers
1. You have been called in to assist Mr. Jackson in analyzing the data he collected.
5
OM5 C3 IM
Although the mean waiting time is about 2 minutes (132 seconds), we see that the
standard deviation is quite large, and one customer waited 876 seconds, or almost 15
2. How should Mr. Jackson respond to Ms. Sutherland at their next meeting? What
should he tell her, and what steps might you suggest he do next?
It appears that long wait times are most like related to staffing issues. This is a good
way to introduce some of the concepts in the scheduling chapter and emphasize the
Teaching Plan
(1) What are the major problems?
(2) How should the data be analyzed?
(3) What do the data tell us?
(3) What might cause excessive waiting?
(4) What should the firm do next?
6
OM5 C3 IM
(5) Summarize the value of data business analytics in OM.
7