OM5 Chapter 3: Measuring Performance in Operations
Discussion Questions
1. What types of performance measurements might be used to evaluate a fraternity or student
organization?
Metrics might include attendance at key events, total membership each academic term, gains
and losses in membership, fundraising amounts, operations costs, number of professional or
2. What information would you need to fully answer the questions that IBM Rochester uses for
selecting measures and indicators that are listed in Section 3 of this chapter? Where would
you get this information?
IBM Rochester, for example, asks the following questions:
Does the measurement support our mission? (Need a mission statement and an
Will the measurement be used to manage change? (Who “owns” the measurement? Does
Is it important to our customers? (What are the customer needs for goods and services?
Is it effective in measuring performance? (Is it actionable? Actionable measures provide
Is it effective in forecasting results? (Does the measure predict something that will
Is it easy to understand/simple? (Will all employees or other stakeholders who use or are
Is the data easy/cost-efficient to collect? (How would the data be collected? Who
Does the measurement have validity, integrity, and timeliness? (Does it truly measure
Does the measurement have an owner? (Who will ensure that the data do get collected,
Good performance measures are actionable. Actionable measures provide the basis for
3. Discuss some analytical or graphical approaches that organizations can use for analyzing
performance data based on your experience and previous coursework.
These methods might include simple charts that you would find in Microsoft Excel, such as
bar charts, scatter plots, pie charts, and line charts for time series data. Other approaches
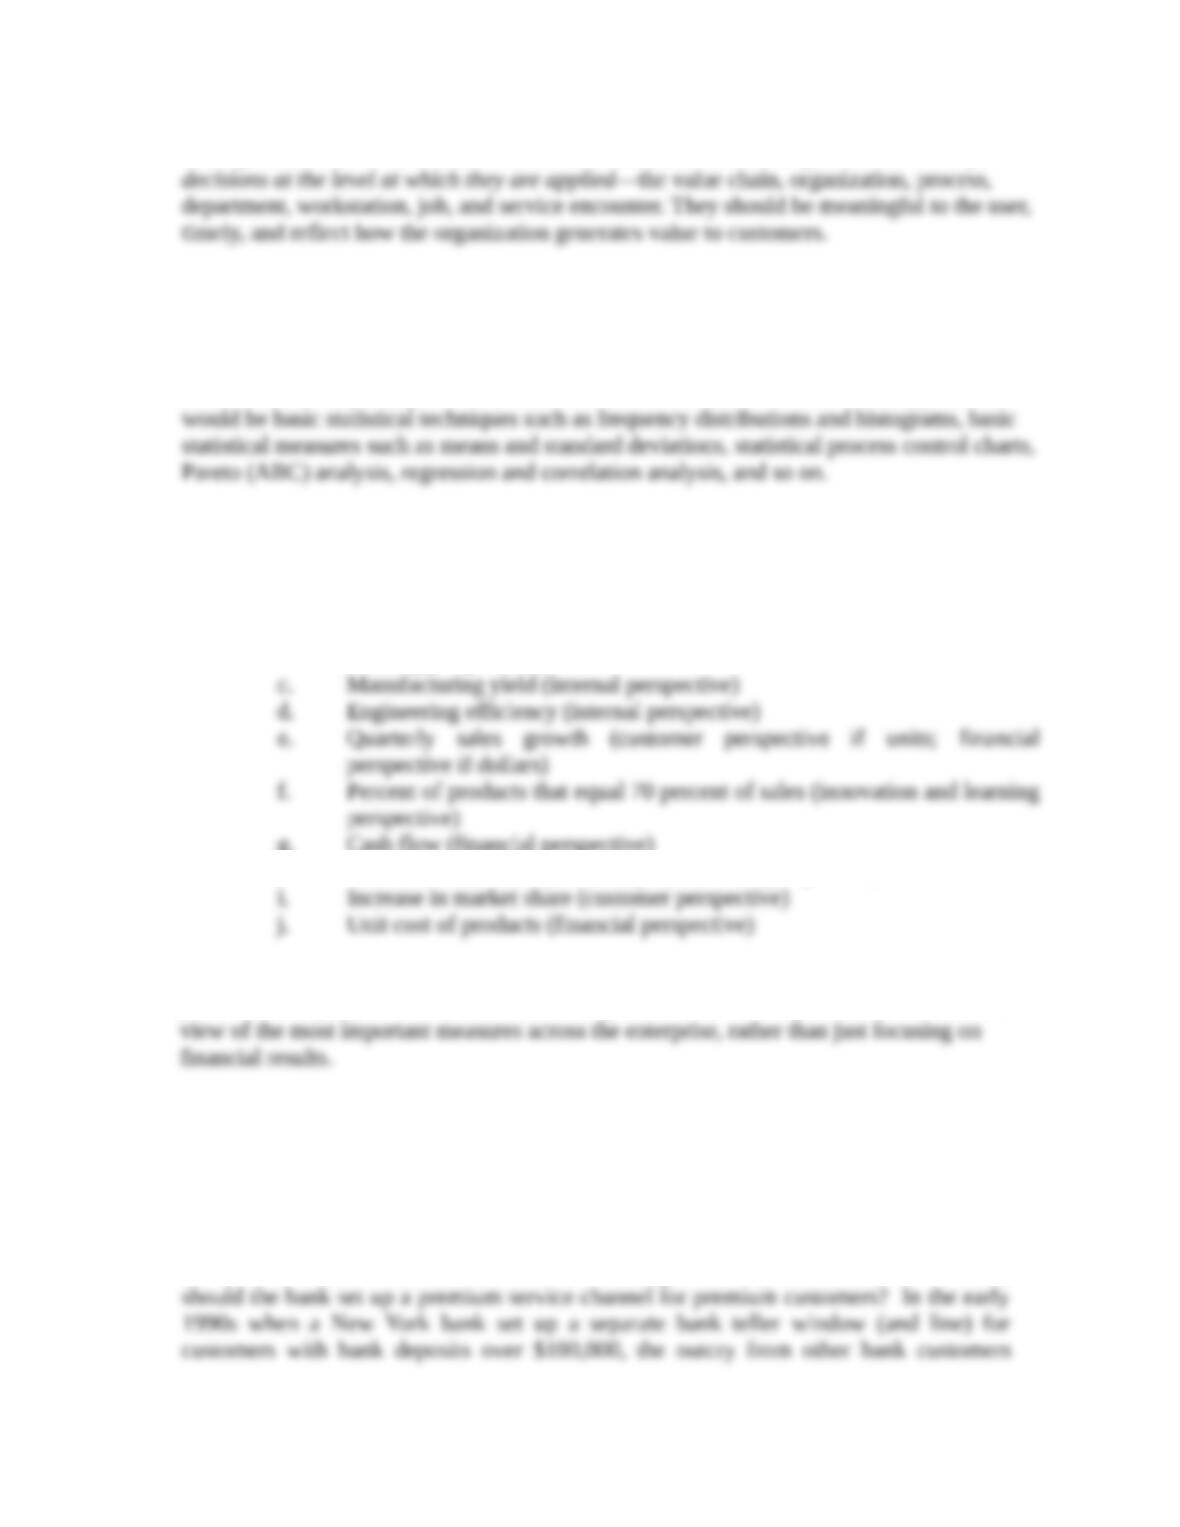
4. Under which perspective of the balanced scorecard would you classify each of the following
measurements?
a. On-time delivery to customers (customer perspective)
b. Time to develop the next generation of products (innovation and
learning perspective)
g. Cash flow (financial perspective)
h. Number of customer partnerships (customer, perspective)
Arguments can be made for other perspectives. Some measures may not clearly fall into a
particular category; however, what is more important is that the organization takes a broad
5. When the value of a loyal customer (VLC) market segment is high, should these customers
be given premium goods and services for premium prices? If the VLC is low, should they be
given less service? Explain.
This question can trigger significant differences in student opinions. For example,
should banking customers with average bank deposits of over $100,000 have to stand in
the same teller line as a bank customer with average bank deposits of $1,000? That is,
resulted in the bank closing the premium teller window for premium customers three
days after it opened. Yet, hotels have VIP and loyal customer suites and floors, airlines
give premium customers first choice at airline seats and flights plus VIP lounges and first
Problems and Activities
(Note: an asterisk denotes problems for which an Excel spreadsheet template on the CourseMate
Web site may be used.)
1. Interview managers at a local company to identify the key business measures (financial,
market, supplier, employee, process, information, innovation, etc.) for that company. What
quality indicators does that company measure? What cause and effect (interlinking)
performance relationships would be of interest to the organization?
It is always interesting to see what organizations really measure. In many cases, don’t be
surprised to see simply a heavy emphasis on financial results without a “balanced
scorecard” as such. Quality indicators are often the traditional ones (defects, yield).
2. Each day, a FedEx competitor processes approximately 85,000 shipments. Suppose that
they use the same Service Quality Index as FedEx and identified the following numbers of
errors during a 5-day week (see the “FedEx: Measuring Service Performance” box). These
values are hypothetical and do not reflect any real company’s actual performance.
Complaints reopened: 125
Damaged packages: 18
International: 102
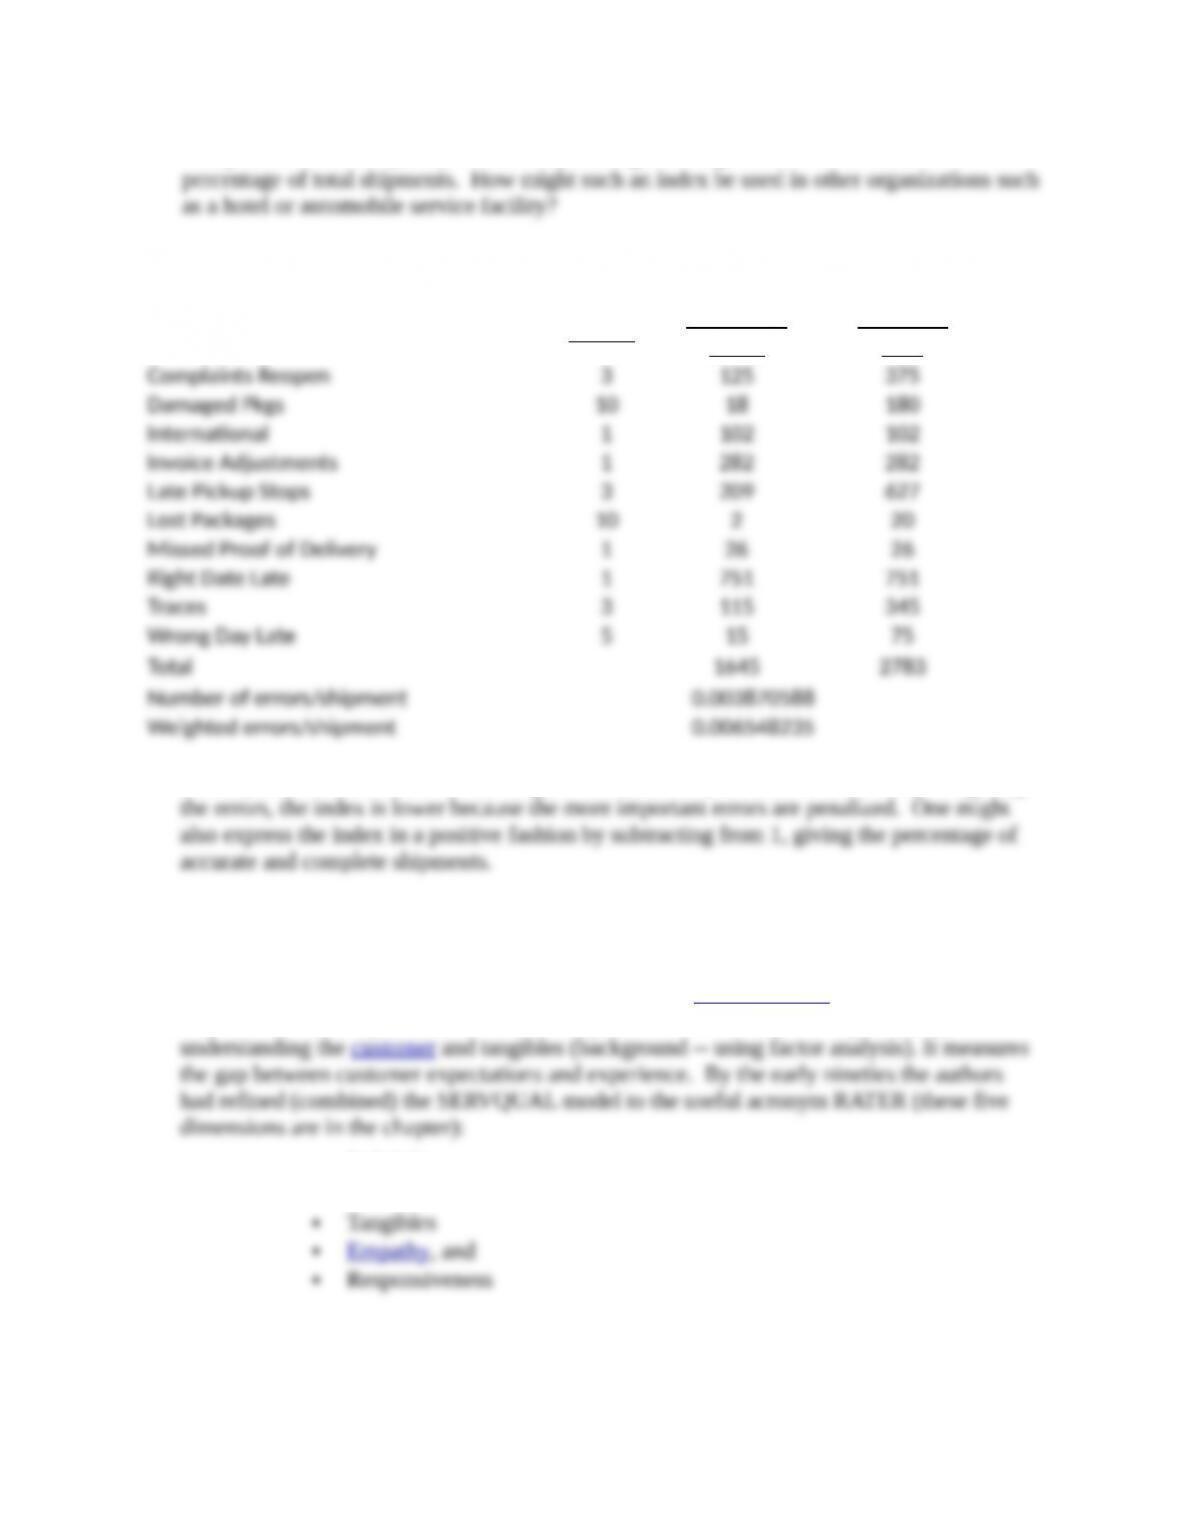
Compute the Service Quality Indicator by finding the weighted sum of errors as a
Number of Shipments = 5*85,000 =
425,000
Weight Number of
Errors
Weighted
Sum
The SQI is 0.65%. Note that if all weights were 1, the SQI would be 0.39%. By weighting
3. Research and write a short paper on how some organization applies the five dimensions of
service quality.
SERVQUAL was originally measured on 10 aspects of service quality: reliability,
responsiveness, competence, access, courtesy, communication, credibility, security,
▪ Reliability
▪ Assurance
If students search SEVQUAL and/or the GAP model (in OM4 C15) they will find many
applications. The SERVQUAL has been tested in banking, credit cards, repair and
http://www.ncbi.nlm.nih.gov/pmc/articles/PMC1069855/pdf/hsresearch00075-0070.pdf
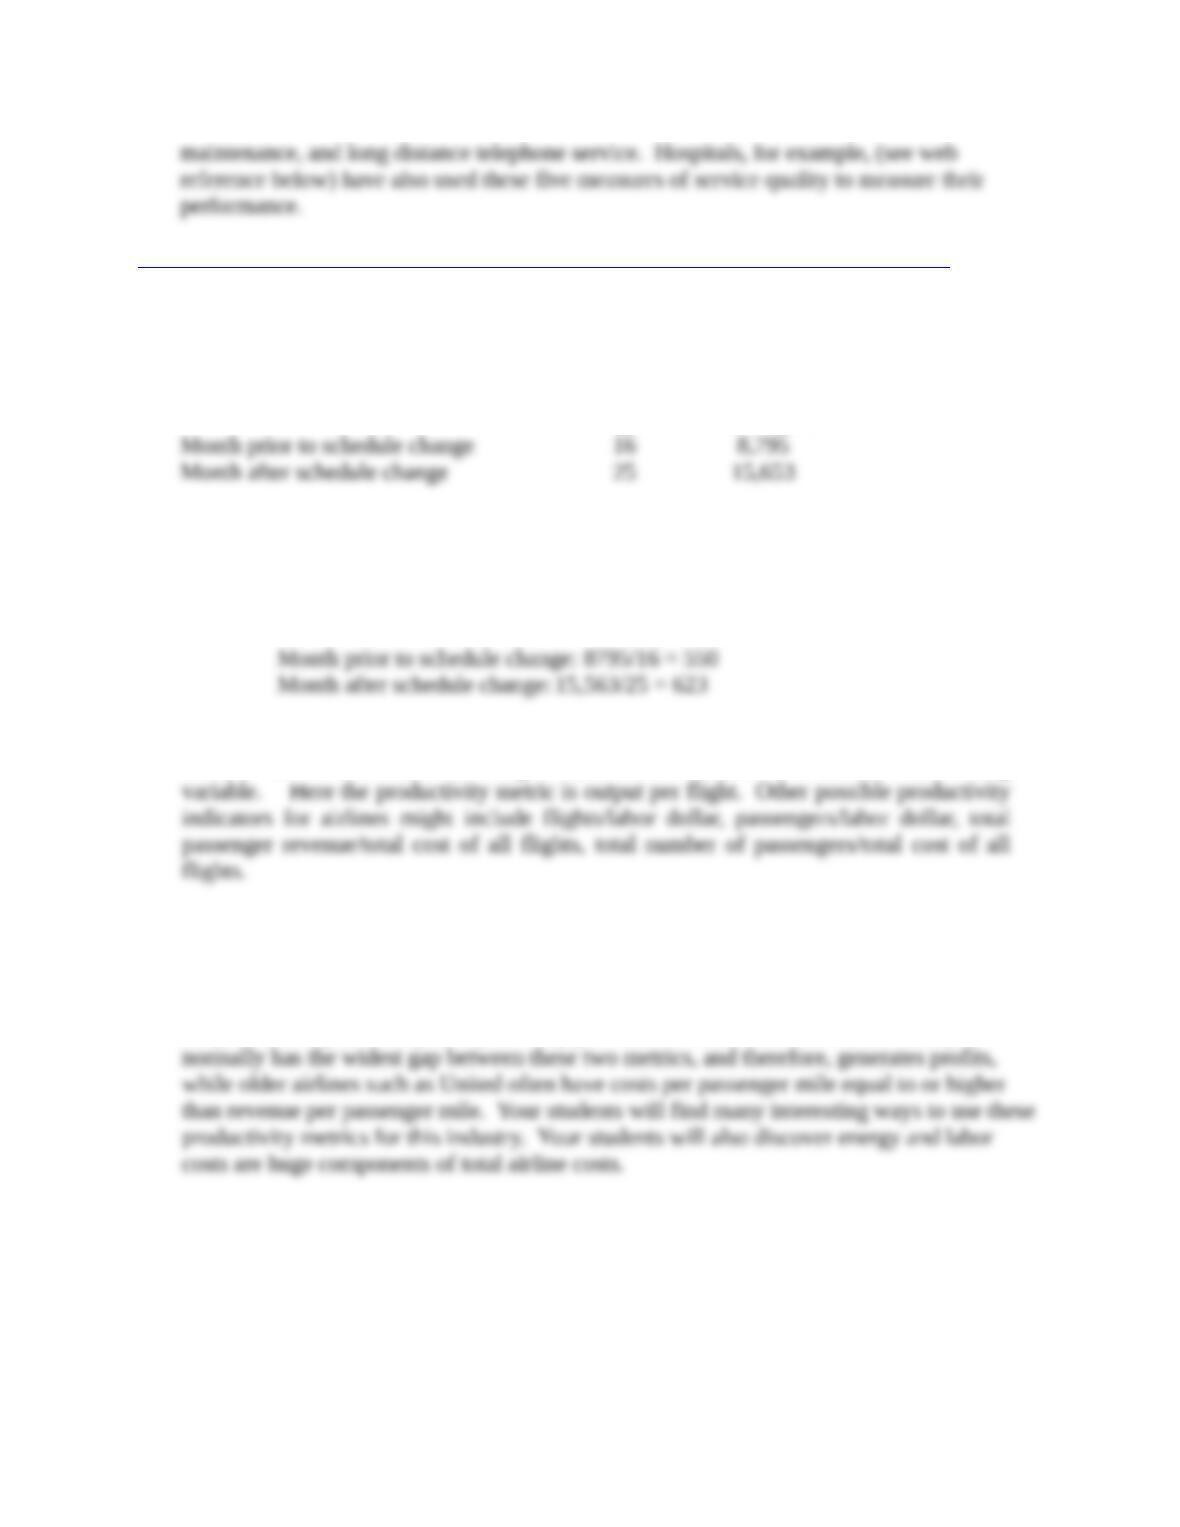
4. A major airline is attempting to evaluate the effect of recent changes it has made in
scheduling flights between New York City and Los Angeles. Data available are shown
below.
Number of Number of
Flights Passengers
Using passengers per flight as a productivity indicator, comment on the apparent effect of
the schedule change.
Computing passengers per flight, we obtain (after rounding)
Productivity increased by 13.27 percent (623/550 – 1) after the schedule change. This
could be due to more convenient flight times, better schedules or some other intervening
5. Revenue or costs per passenger mile are two key performance measures in the airline
industry. Research their use in this industry and prepare a one-page paper summarizing how
they are used and why they are so important.
These two metrics drive profitability in the airline industry. Few industries have so few and
simple summary metrics yet they are very powerful. Southwest Airlines, for example,
6. A hamburger factory produces 60,000 hamburgers each week. The equipment used costs
$10,000 and will remain productive for 4 years. The labor cost per year is $13,500.
a. What is the productivity measure of “units of output per dollar of input” averaged over
the four-year period?
b. We have the option of $13,000 equipment, with an operating life of 5 years. It would
reduce labor costs to $11,000 per year. Should we consider purchasing this equipment
(using productivity arguments alone)?
For the expensive machine, productivity = 60,000(52)(5)/[11,000(5) + 13,000] =
7. A fast-food restaurant has a drive-through window and during peak lunch times can handle a
maximum of 50 cars per hour with one person taking orders, assembling them, and acting as
cashier. The average sale per order is $9.00. A proposal has been made to add two workers
and divide the tasks among the three. One will take orders, the second will assemble them,
and the third will act as cashier. With this system it is estimated that 80 cars per hour can be
serviced. Use productivity arguments to recommend whether or not to change the current
system.
Productivity = revenue/labor dollar
For system 1, productivity = 50($9.00)/x = 450/x
advisable to change the current system (i.e., keep system1). System #2 simply uses
8. A key hospital outcome measure of clinical performance is length of stay (LOS); that is, the
number of days a patient is hospitalized. For patients at one hospital with acute myocardial
infarction (heart attack), the length of stay over the past four years has consistently
decreased. The hospital also has data for various treatment options such as the percentage of
patients who received aspirin upon arrival and cardiac medication for Left Ventricular
Systolic Dysfunction (LVSD). The data are shown below:
Year Average LOS Aspirin on arrival LVSD medication
Illustrate the interlinking relationships by constructing scatter using Excel showing the LOS
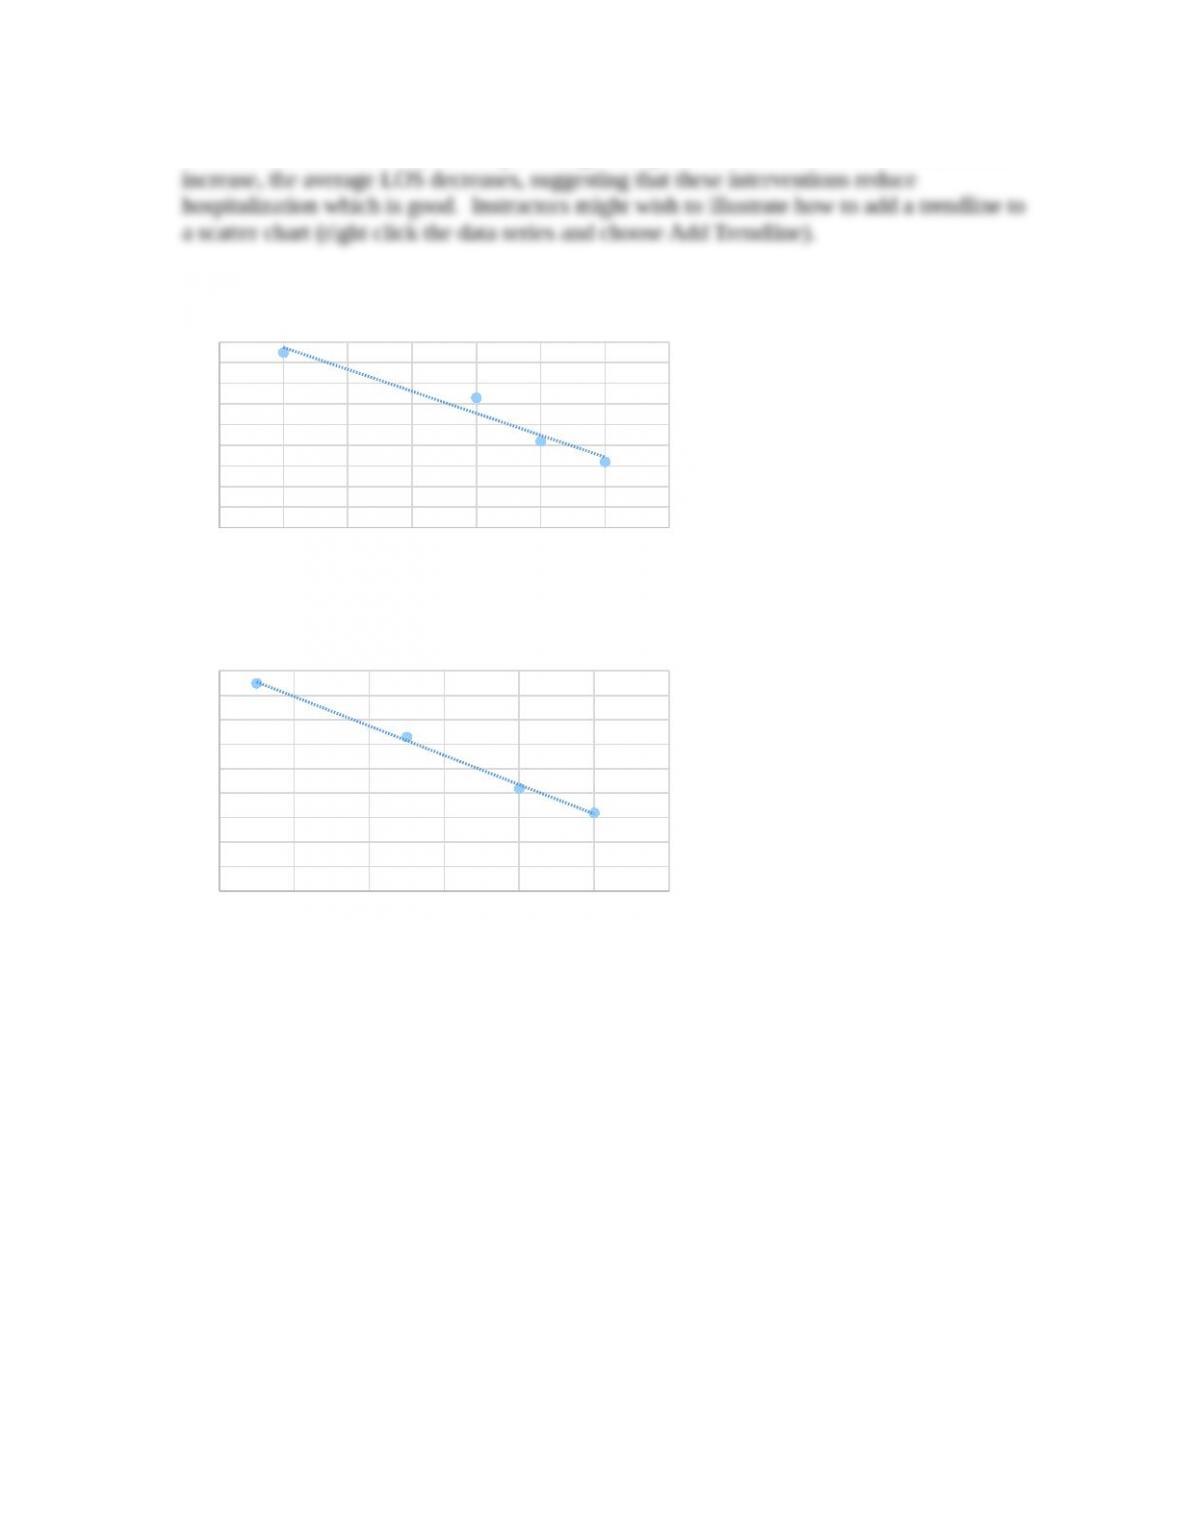
The charts below show that as the percentage of aspirin on arrival and LVSD medications
94% 95% 96% 97% 98% 99% 100% 101%
3.7
3.8
3.9
4
4.1
4.2
4.3
4.4
4.5
4.6
LOS vs Aspirin on Arrival
88% 90% 92% 94% 96% 98% 100%
3.7
3.8
3.9
4
4.1
4.2
4.3
4.4
4.5
4.6
LOS vs. LVSD Medica(on