OM5 C16 IM
© 2013 Cengage Learning. All Rights Reserved. May not be scanned, copied or duplicated, or posted to a publicly
accessible website, in whole or in part.
10
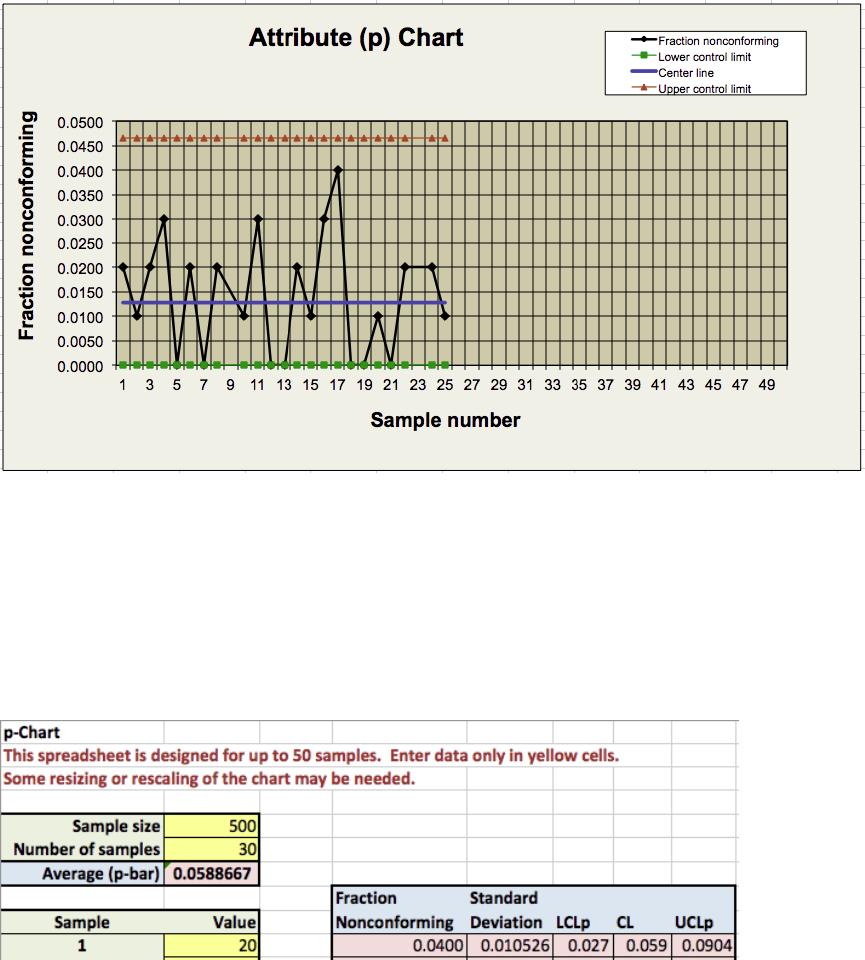
8.* An Internet service provider (ISP) measures the proportion of peak period time when
a customer is likely to receive busy signals. Data on the number of busy signals
received from samples of 500 calls over a 30-day period can be found in the
worksheet C16P8 in the OM4 Data Workbook. Construct and interpret a p-chart for
these data.
Portions of the Excel template are shown below:
OM5 C16 IM
© 2013 Cengage Learning. All Rights Reserved. May not be scanned, copied or duplicated, or posted to a publicly
accessible website, in whole or in part.
11
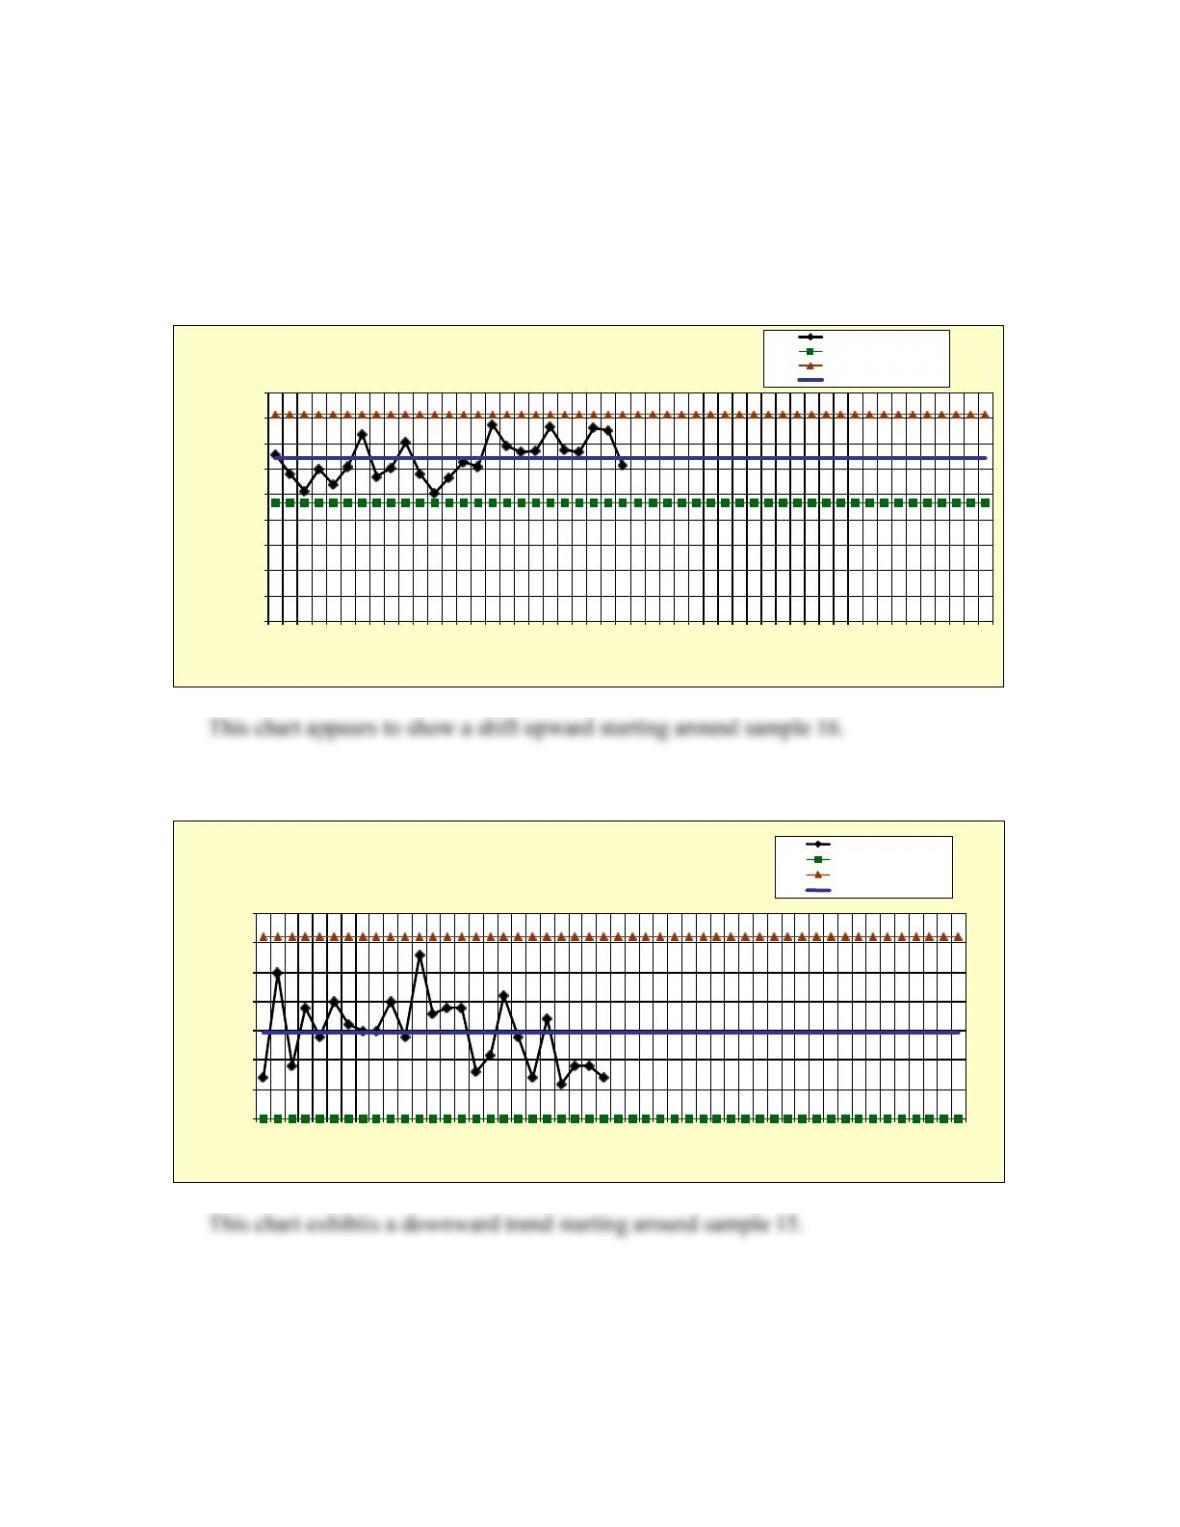
The process appears to have shifted around sample 16. This might represent a
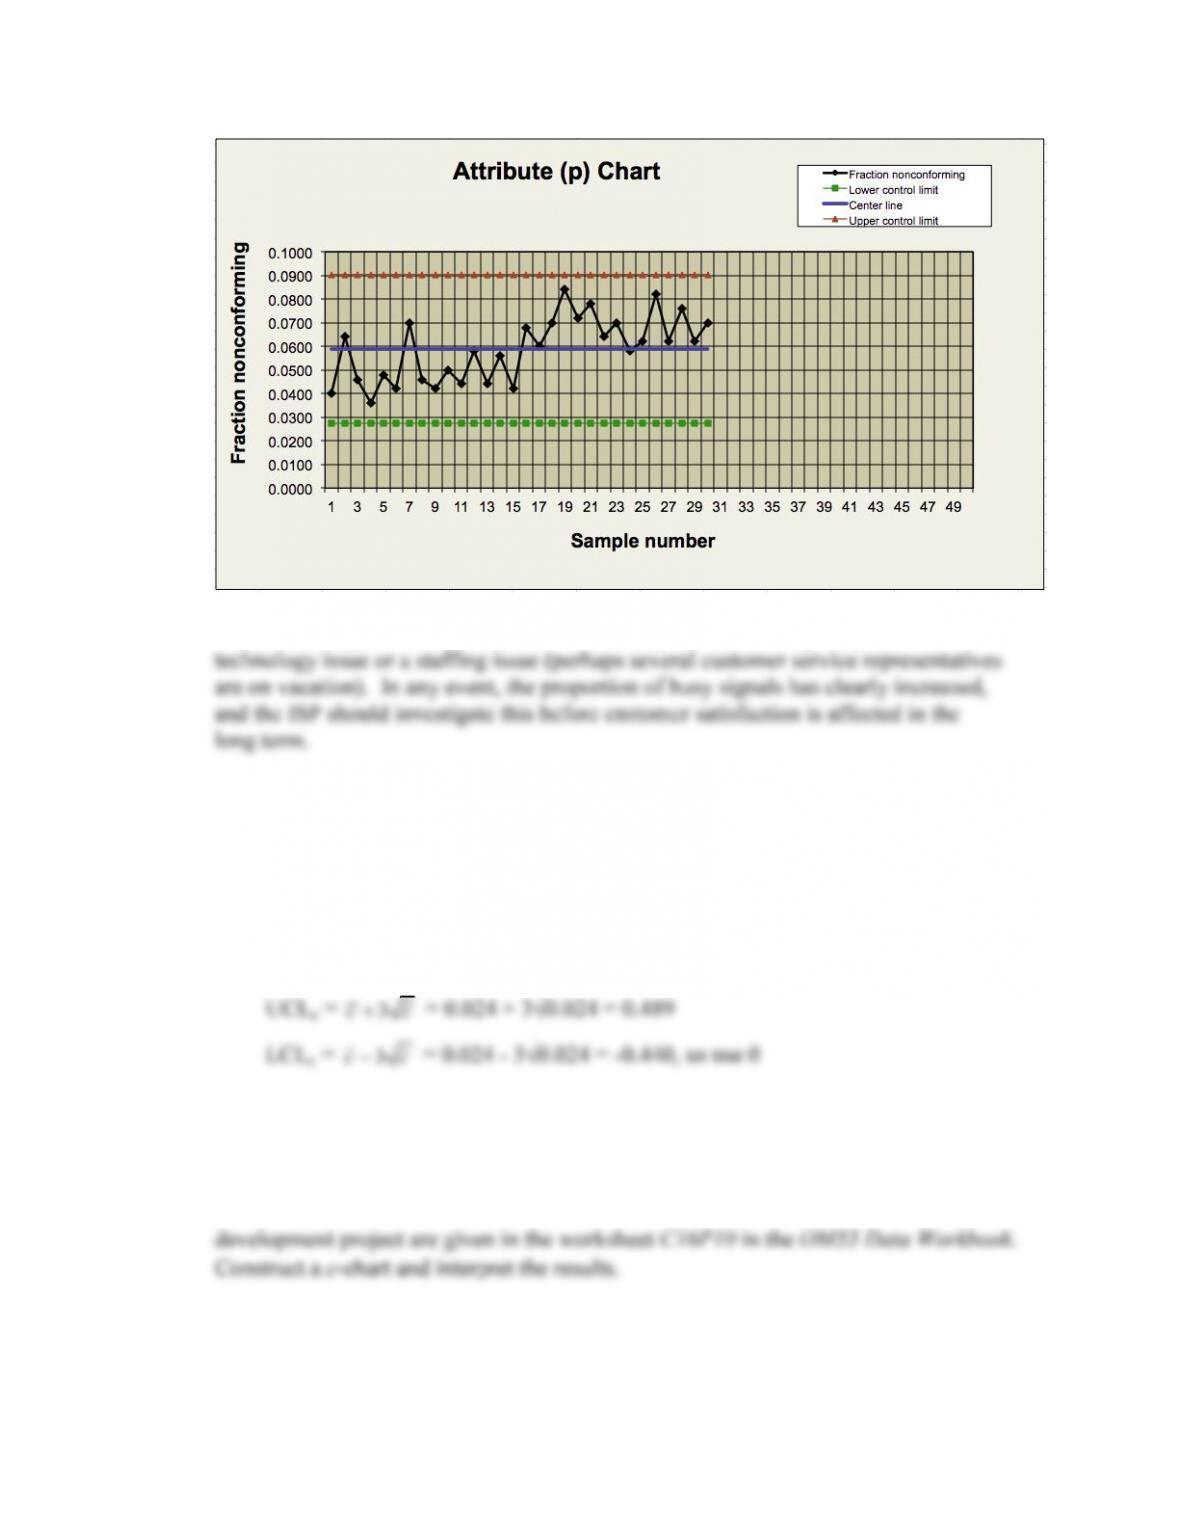
9. A fast food franchise tracked the number of errors that occurred in customers’
orders. These included wrong menu item, wrong size drink, lack of condiments,
wrong price total, and so on. Some orders may have more than one error. In one
week, 1250 orders were filled, and a total of 30 errors were discovered. Find the
control limits for a c-chart.
c-bar = average number of errors/order = 30/1250 = 0.024
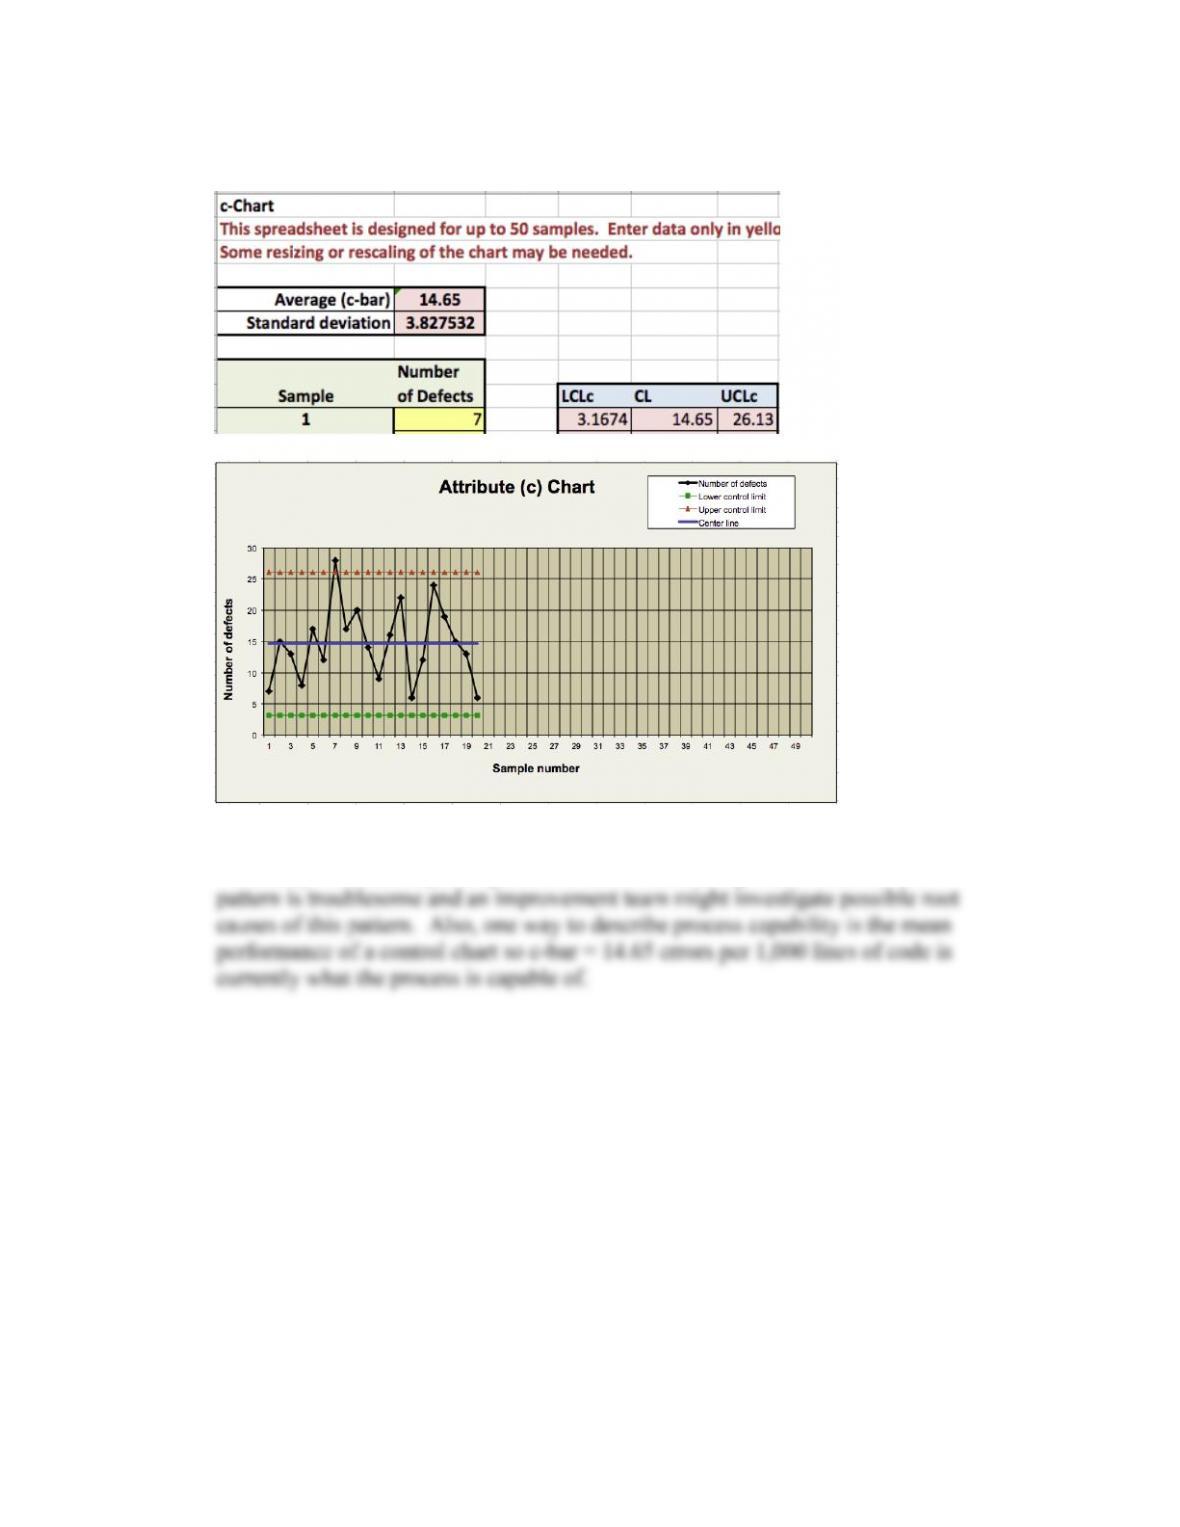
10.* Data showing the number of errors per thousand lines of code for a software
OM5 C16 IM
© 2013 Cengage Learning. All Rights Reserved. May not be scanned, copied or duplicated, or posted to a publicly
accessible website, in whole or in part.
12
Portions of the Excel template c-Chart are shown next.
Except for sample #7, the chart is in control, although there is a high amount of
variability. Technically, this process is not in statistical process control. This
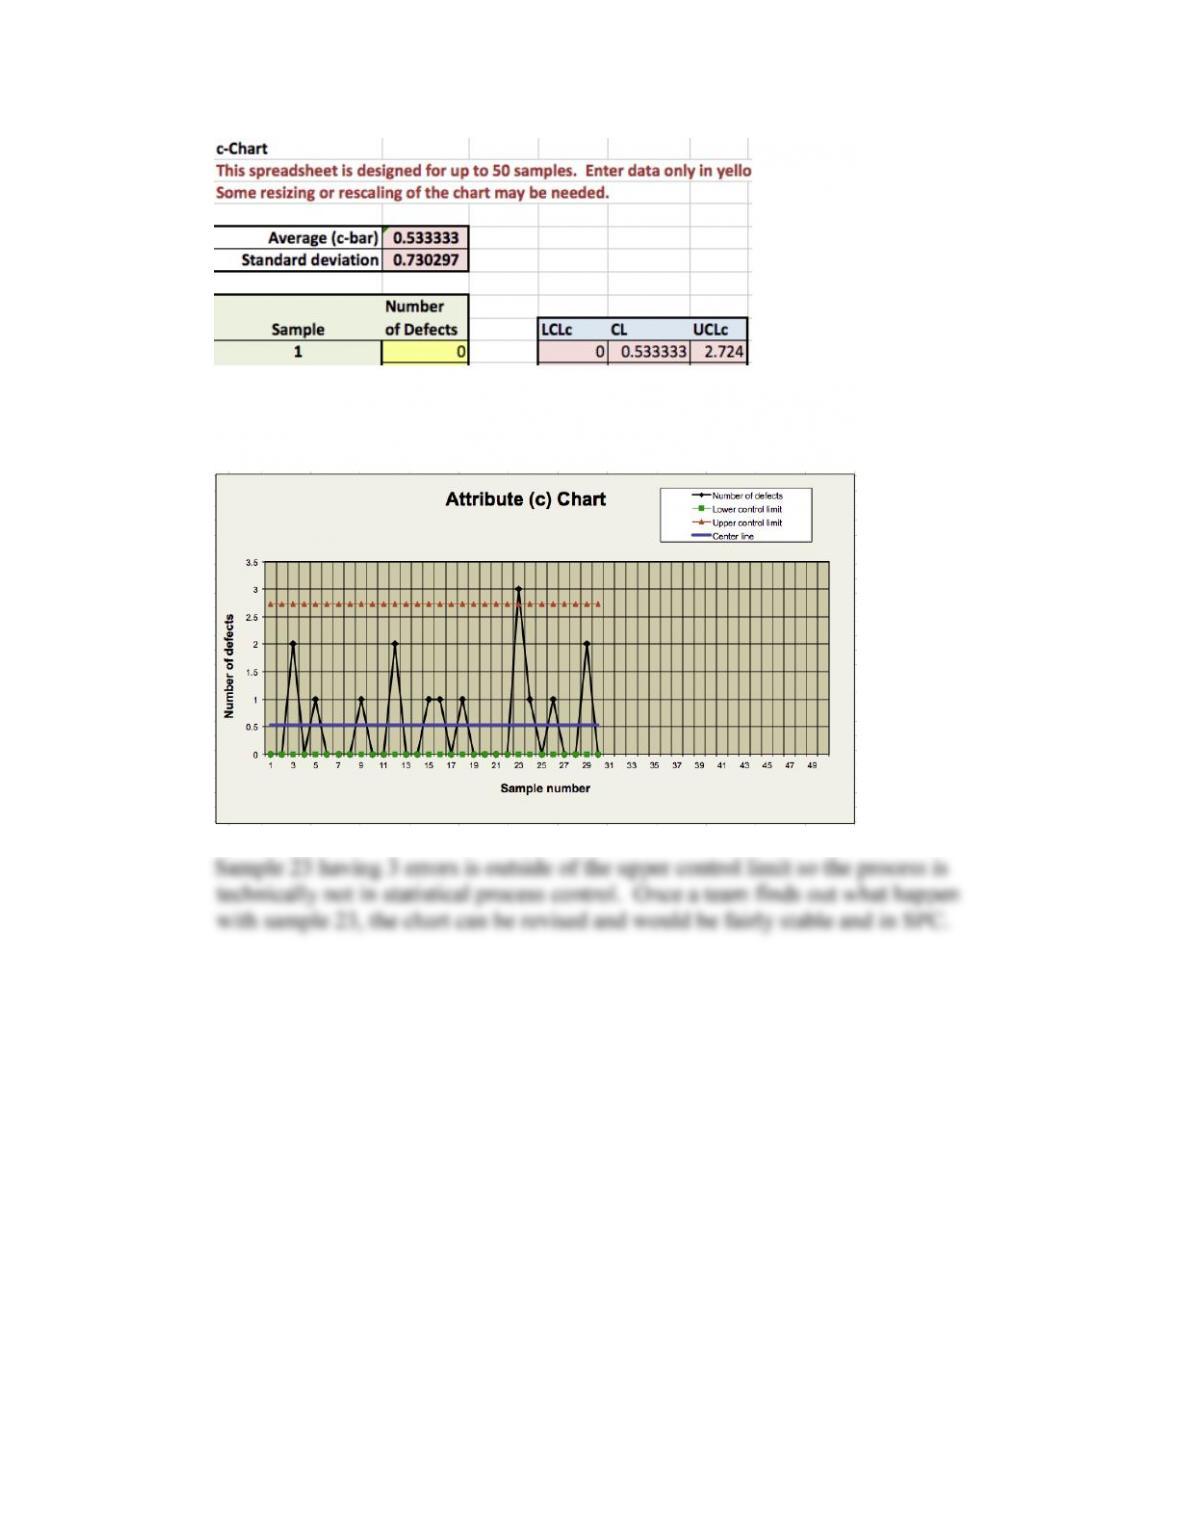
11.* A mail-order prescription drug vendor measured the number of errors per standard
order being picked in their distribution center. Data can be found in the worksheet
C16P11 in the OM5 Data Workbook. Construct a c-chart and interpret the results.
OM5 C16 IM
© 2013 Cengage Learning. All Rights Reserved. May not be scanned, copied or duplicated, or posted to a publicly
accessible website, in whole or in part.
13
Note that in calculating the lower control limit using the formula in the book, the
value turns out negative, so 0 is used.
OM5 C16 IM
© 2013 Cengage Learning. All Rights Reserved. May not be scanned, copied or duplicated, or posted to a publicly
accessible website, in whole or in part.
14
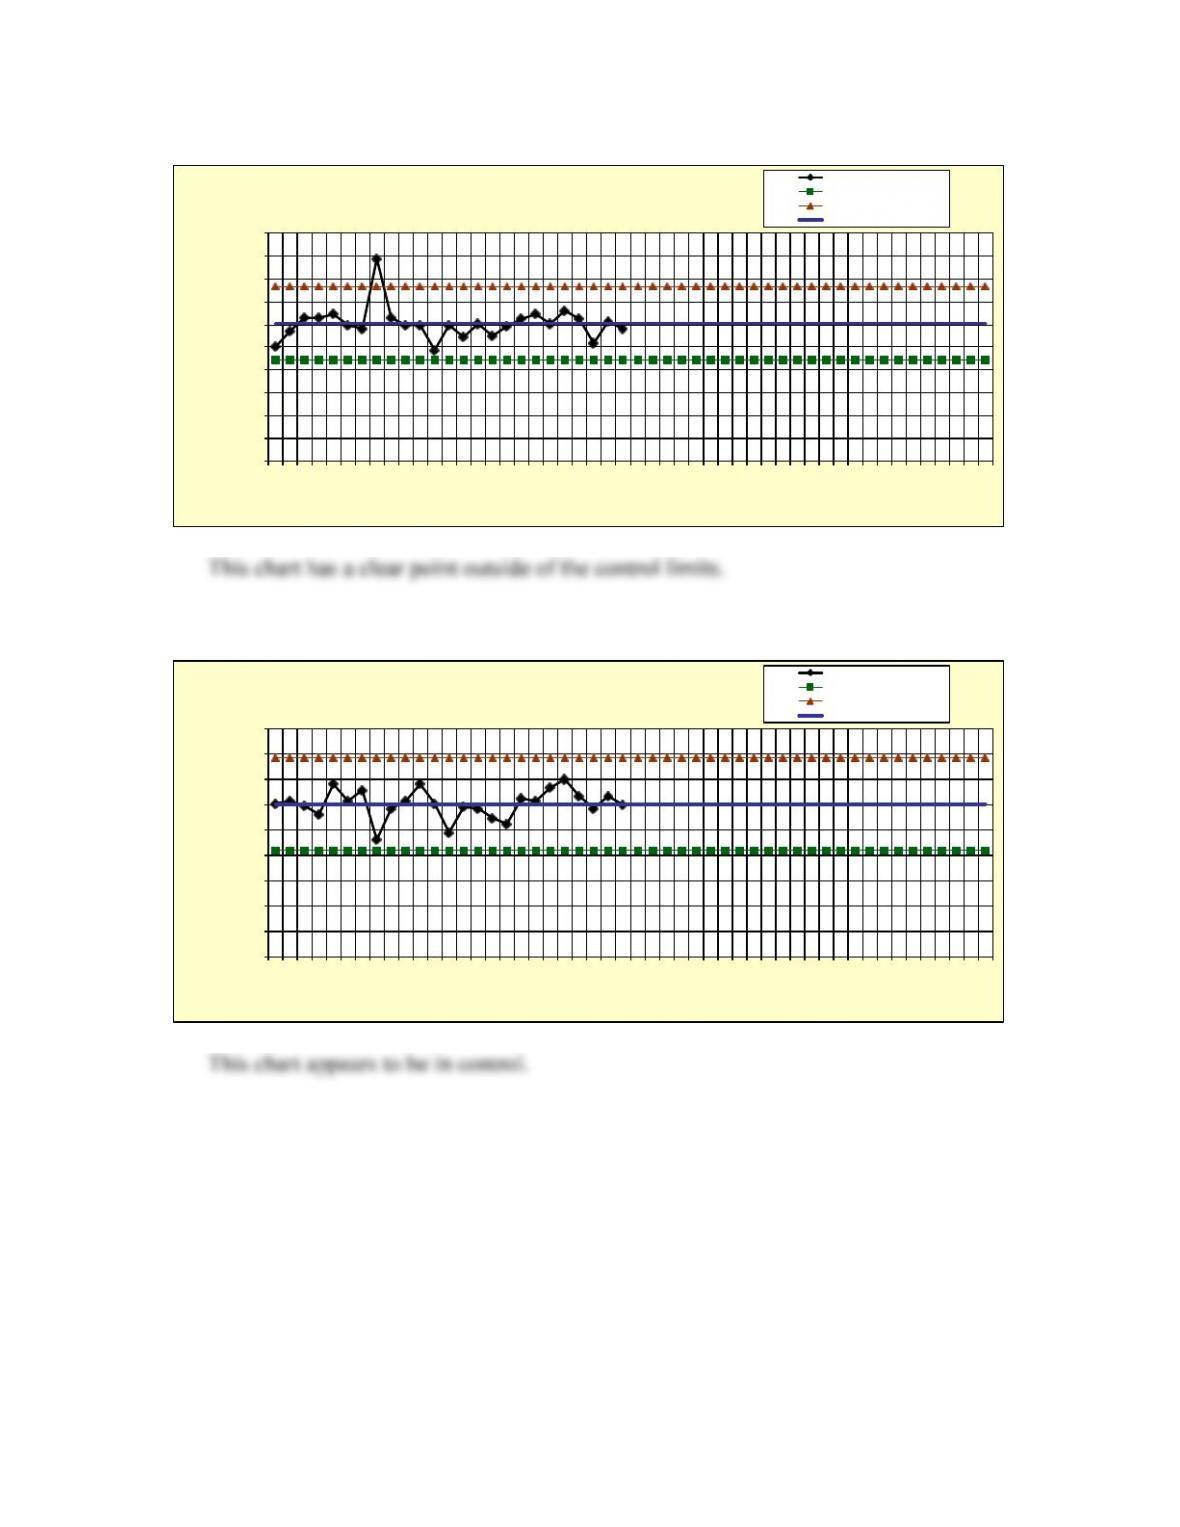
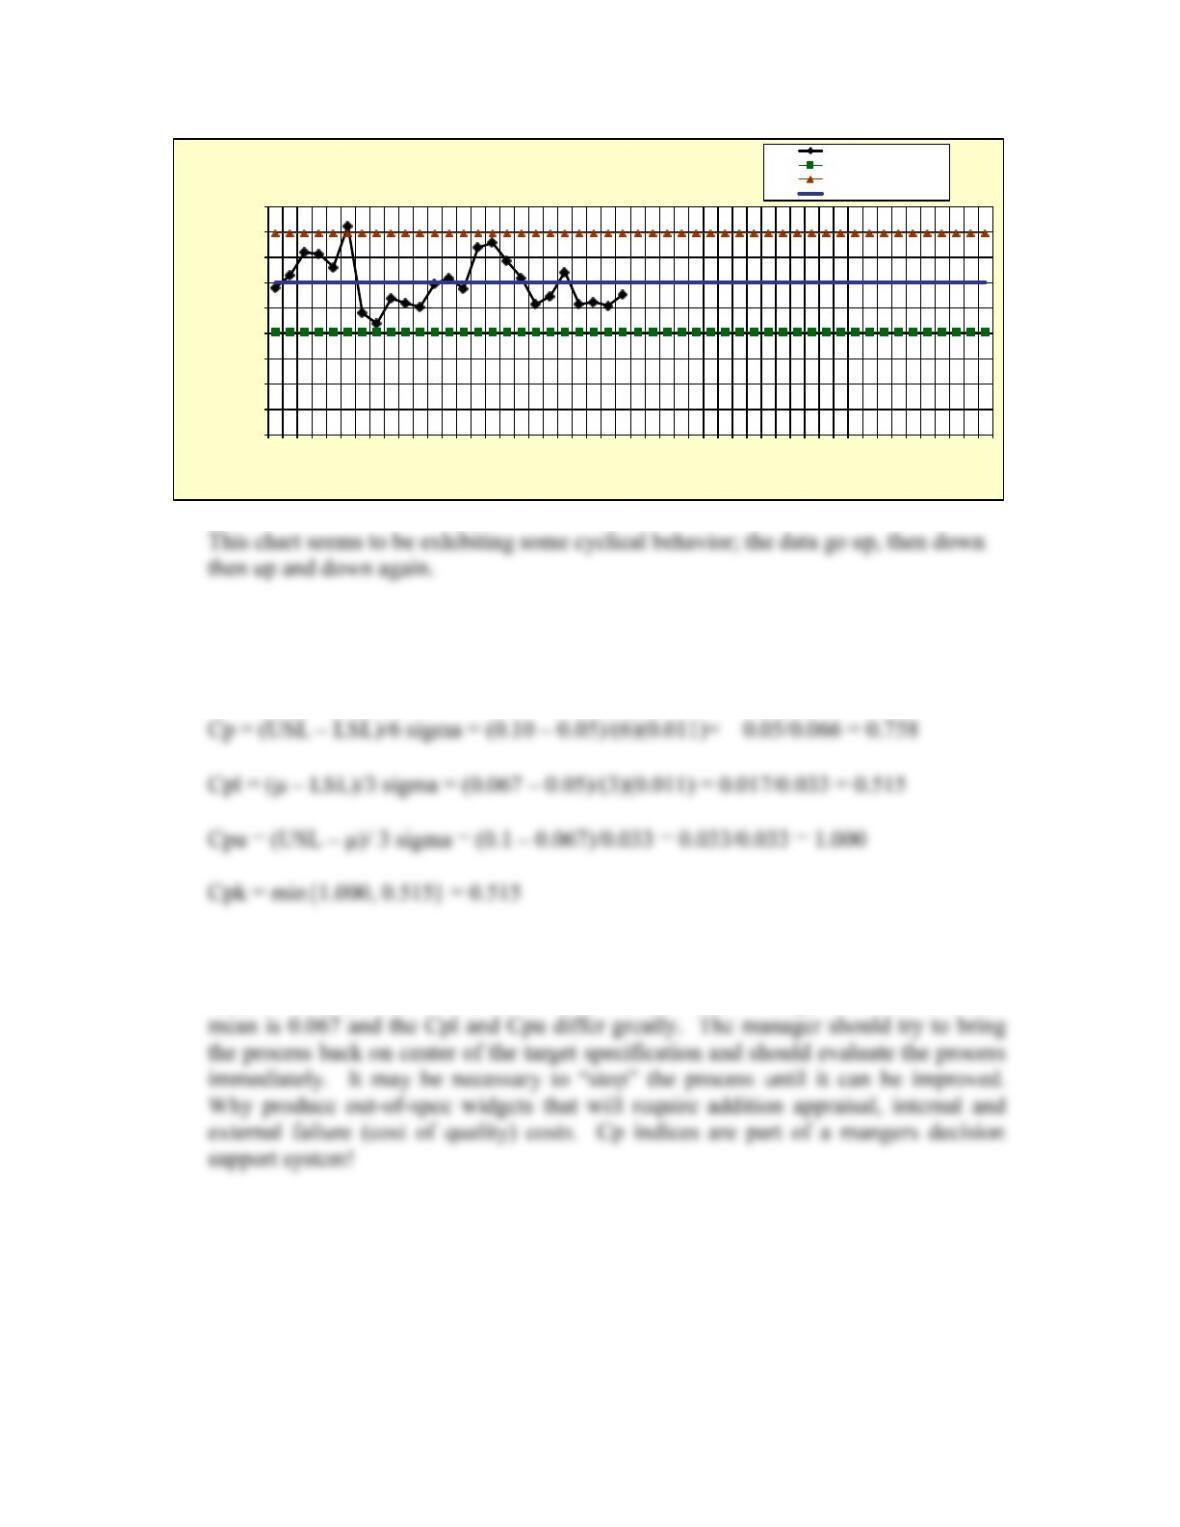
12. The worksheet C16P12 in the OM5 Data Workbook provides 5 examples of control
charts. Interpret the patterns in each and determine if the processes are in control. If
not, state the type of out-of-control condition that you identify (for example, points
outside of the control limits, shifts, trends, and so on.)
Chart 1
Chart 2
Chart 3
3
3.5
4
4.5
5
5.5
6
6.5
7
7.5
1 3 5 7 9 11 13 15 17 19 21 23 25 27 29 31 33 35 37 39 41 43 45 47 49
Averages
Sample number
X-bar Chart Averages
Lower control limit
Upper control limit
Center line
0
0.5
1
1.5
2
2.5
3
3.5
1 3 5 7 9 11 13 15 17 19 21 23 25 27 29 31 33 35 37 39 41 43 45 47 49
Ranges
Sample number
R-Chart Ranges
Lower control limit
Upper control limit
Center line
OM5 C16 IM
© 2013 Cengage Learning. All Rights Reserved. May not be scanned, copied or duplicated, or posted to a publicly
accessible website, in whole or in part.
15
Chart 4
Chart 5
3
3.5
4
4.5
5
5.5
6
6.5
7
7.5
8
1 3 5 7 9 11 13 15 17 19 21 23 25 27 29 31 33 35 37 39 41 43 45 47 49
Averages
Sample number
X-bar Chart Averages
Lower control limit
Upper control limit
Center line
3
3.5
4
4.5
5
5.5
6
6.5
7
7.5
1 3 5 7 9 11 13 15 17 19 21 23 25 27 29 31 33 35 37 39 41 43 45 47 49
Averages
Sample number
X-bar Chart Averages
Lower control limit
Upper control limit
Center line
OM5 C16 IM
© 2013 Cengage Learning. All Rights Reserved. May not be scanned, copied or duplicated, or posted to a publicly
accessible website, in whole or in part.
16
13. A specification for a spacer plate used in a machine tool has specifications LSL =
0.05 and USL = 0.10 cm in thickness. A sample of 100 parts found = 0.067 and =
0.011. Compute and interpret the process capability indexes Cp, Cpl, Cpu, and Cpk.
Reinforce the point that the Cp numerator is “design specifications” and the
dominator is “actual process” performance. Process capability (0.758) is poor and not
capable. The process is not centered on the specification target of 0.075 since the
3
3.5
4
4.5
5
5.5
6
6.5
7
7.5
1 3 5 7 9 11 13 15 17 19 21 23 25 27 29 31 33 35 37 39 41 43 45 47 49
Averages
Sample number
X-bar Chart Averages
Lower control limit
Upper control limit
Center line