OM5 C16 IM
© 2013 Cengage Learning. All Rights Reserved. May not be scanned, copied or duplicated, or posted to a publicly
accessible website, in whole or in part.
1
OM5 Chapter 16: Quality Control and SPC
Discussion Questions
1. Provide some examples in business or daily life in which a controlled process is
erroneously adjusted and an out-of-control process is ignored. What implications do
these errors have?
While it is clear that a truly out-of-control process must be corrected, many workers
mistakenly believe that whenever process output is off target, some adjustment must
be made. The stock market reacts to daily reports (often erroneously adjusting a
2. Discuss some examples of common and special causes of variation in your daily life
(for example, at school or at home).
Special (or assignable) cause variation arises from external sources that are not
inherent in the process, appear sporadically, and disrupt the random pattern of
common causes. Common cause variation is the inherent way the process is design
and what it is reasonably capable of. One example is commuting to and from school
3. Hospital administrators wanted to understand and better control the waiting time of
patients in the emergency room (ER) department. To do this, they constructed x-bar
and R-charts by sampling the waiting times of the first five patients admitted to the
ER at the beginning of each shift (7 a.m., 3 p.m., and 11 p.m.). What do you think of
this approach? Will it provide the information the hospital administrators seek? How
might the sampling process be improved, and what would you recommend?
This was an actual experience encountered by one of the authors. The purpose of
control charts is to understand the state of the process over time. Clearly 3 samples
OM5 C16 IM
© 2013 Cengage Learning. All Rights Reserved. May not be scanned, copied or duplicated, or posted to a publicly
accessible website, in whole or in part.
2
4. Suppose that you were monitoring the time it takes to complete order transactions at a
call center. Discuss what might cause such out-of-control conditions as a trend, shift
in the mean, or cycles in an x-bar chart in this situation.
An upward trend might occur as time passes during the day and more and more
people begin to call in. A shift in the average time might be the result of a new
5. Would it make sense to draw specification limits on an x-bar chart? Why or why not?
No, because specification limits relate to individual observations whereas an x-bar
chart monitors the average value of a sample. Instructors might refer to the sampling
Problems and Activities
Note: an asterisk denotes problems for which an Excel spreadsheet template on the
CourseMate Web site may be used.
Data sets for problems are also available on the CourseMate Website.
1. Develop a “personal quality checklist” on which you tally nonconformances in your
personal life (such as being late for work or school, not completing homework on
time, not getting enough exercise, and so on). What type of chart would you use to
monitor your performance?
This idea was promoted by an AT&T executive as a means of getting himself (and
OM5 C16 IM
© 2013 Cengage Learning. All Rights Reserved. May not be scanned, copied or duplicated, or posted to a publicly
accessible website, in whole or in part.
3
2. Examine the questions in the satisfaction survey in the box “Izzy’s: Measuring
Customer Satisfaction.” How do the questions relate to the five dimensions of
service quality introduced in Chapter 3? Discuss how the survey results could be
used to control quality. What types of quality control charts might be used?
Service quality is consistently meeting or exceeding customer expectations (external
focus) and service delivery system performance (internal focus) for all service
Service-quality measures are based primarily on human perceptions of service
collected from customer surveys, focus groups, and interviews. Chapter 3 introduced
1. Tangibles—Physical facilities, uniforms, equipment, vehicles, and appearance
of employees (i.e., the physical evidence).
Cleanliness
Restrooms clean & supplied?
2. Reliability—Ability to perform the promised service dependably and
accurately.
3. Responsiveness—Willingness to help customers and provide prompt recovery
to service upsets.
4. Assurance—Knowledge and courtesy of the service providers, and their
ability to inspire trust and confidence in customers.
5. Empathy—Caring attitude and individualized attention provided to its
customers.
OM5 C16 IM
© 2013 Cengage Learning. All Rights Reserved. May not be scanned, copied or duplicated, or posted to a publicly
accessible website, in whole or in part.
4
Employee attitude
Most questions deal with tangibles of the food and restaurant. There are no specific
3. Thirty samples of size 4 of the customer waiting time at a call center for a health
insurance company resulted in an overall mean of 10.4 minutes and average range of
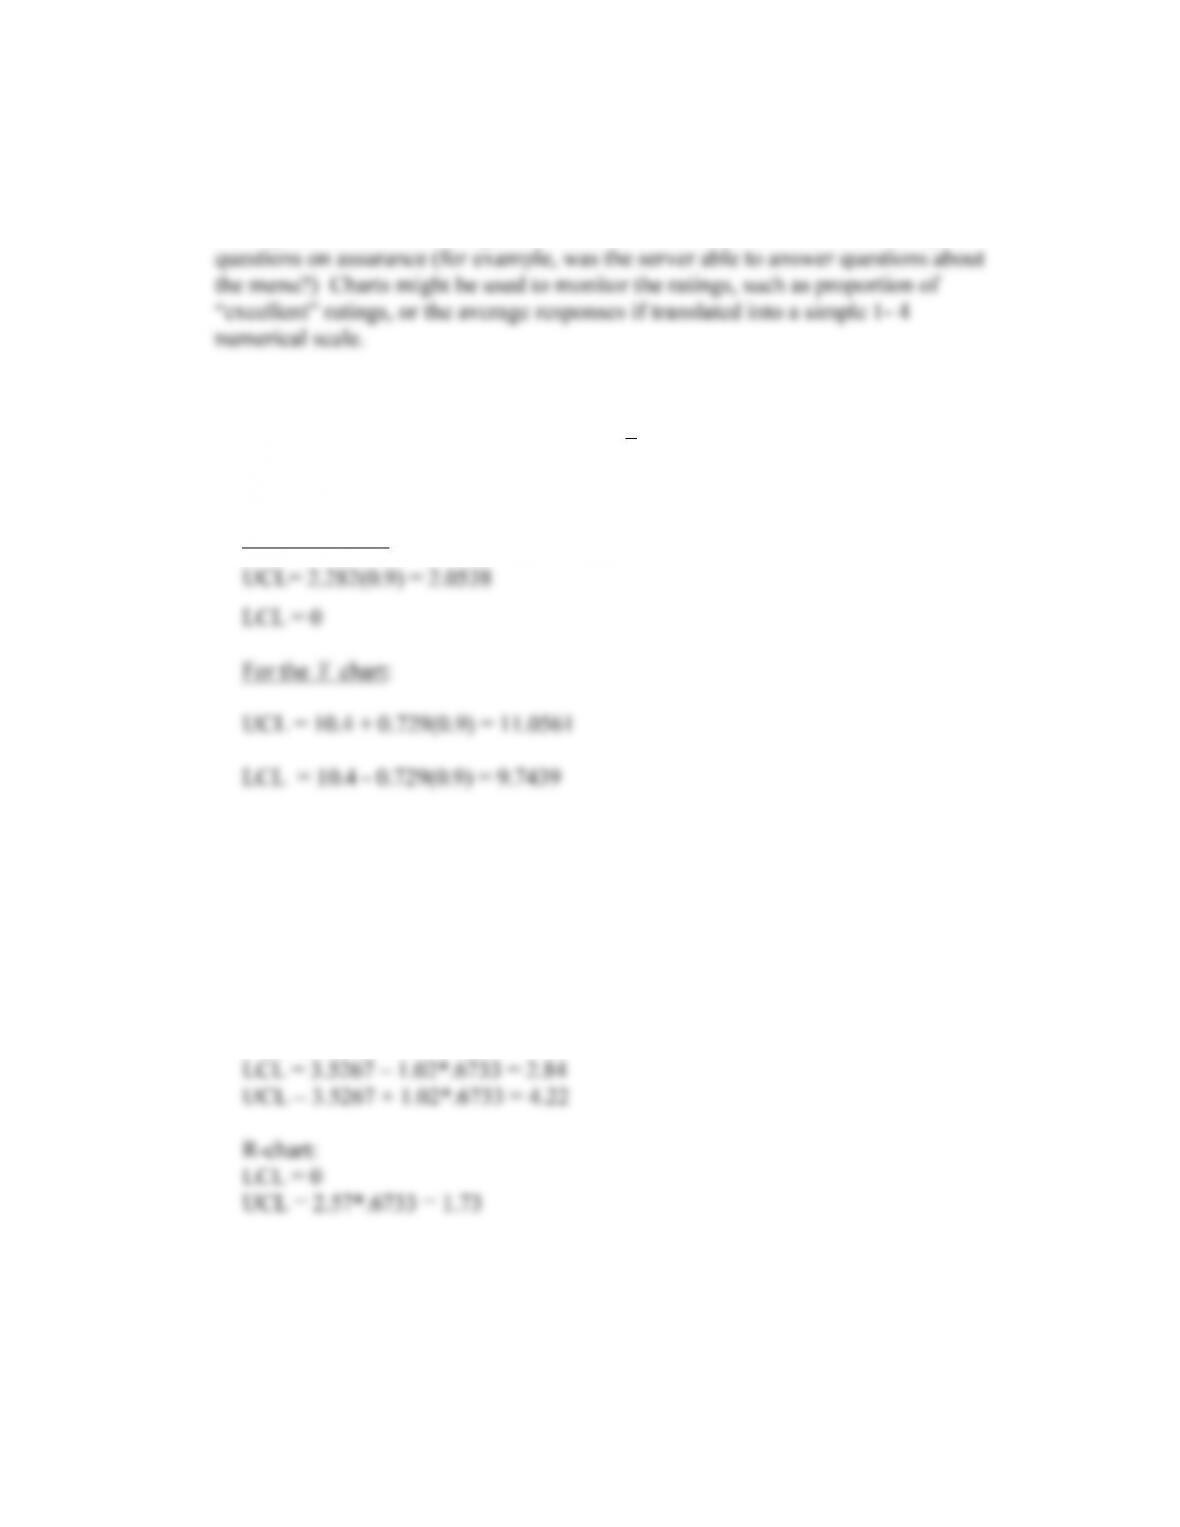
0.9 minutes. Compute the control limits for – and R-charts.
From Appendix B: With n = 4 then A2 = 0.729, D3 = 0, D4 = 2.282
For the R-chart:
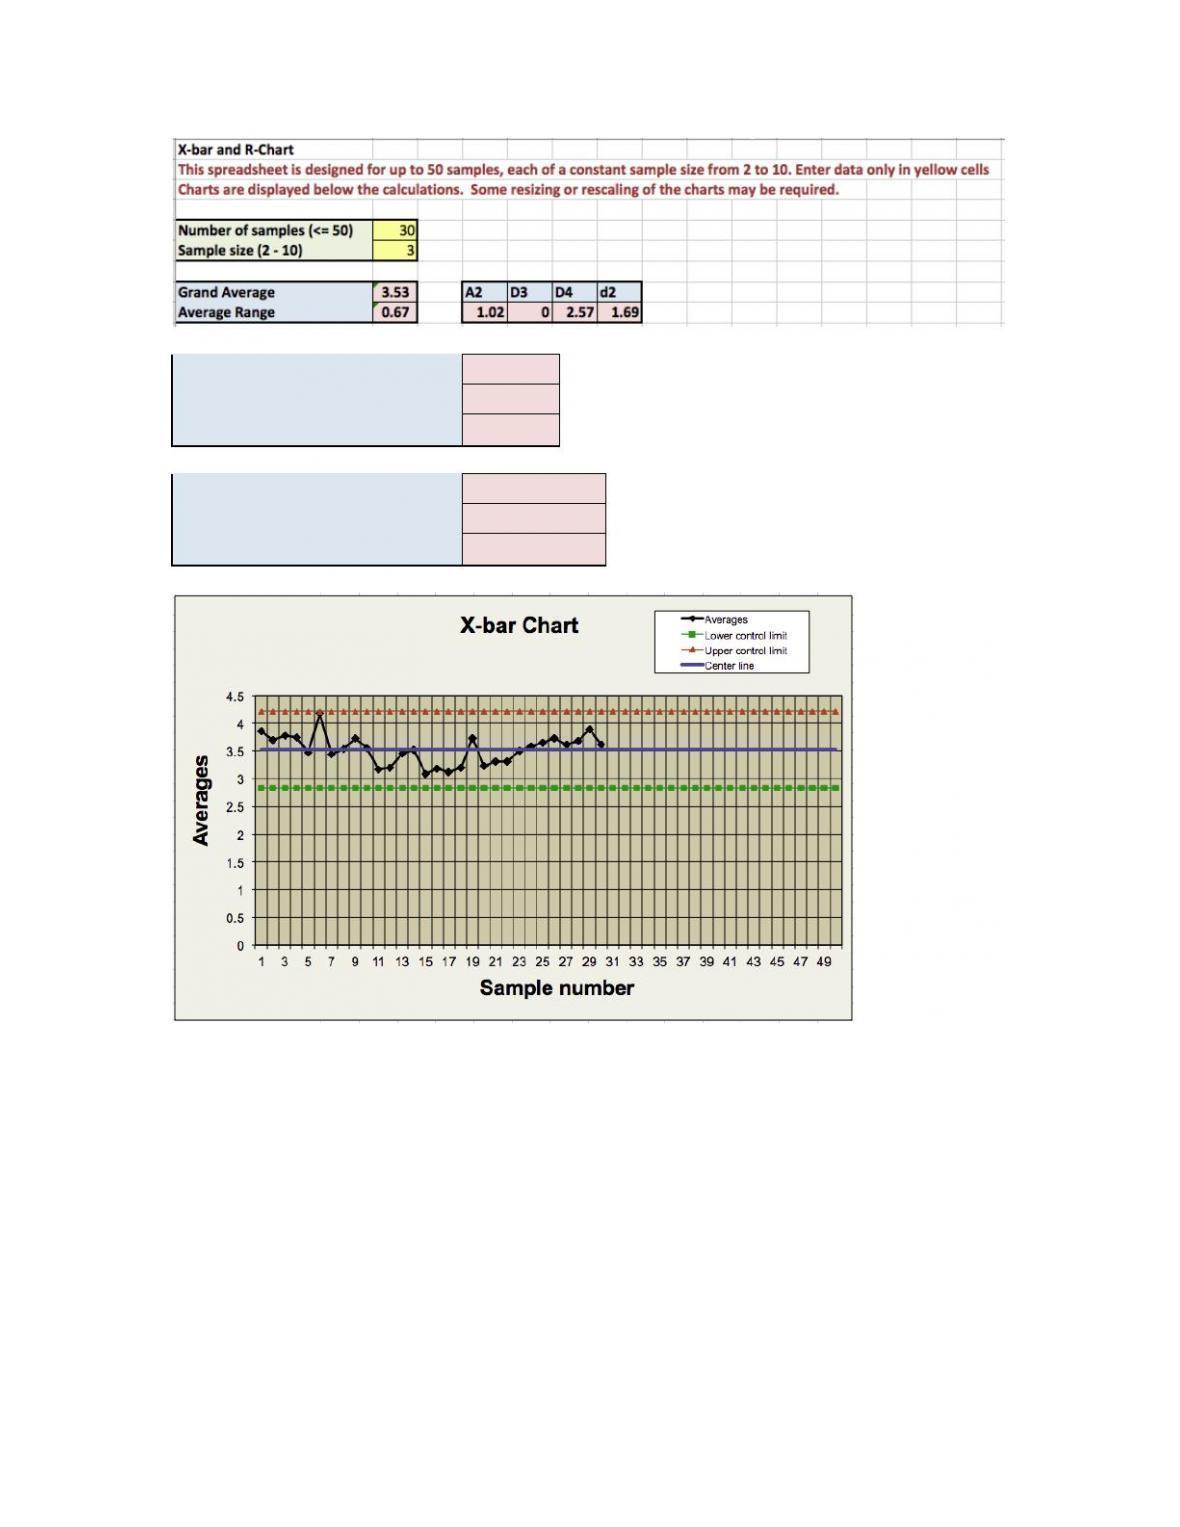
4.* Thirty samples of size 3, available in the worksheet C16P4 in the OM5 Data
Workbook were taken from a machining process over a 15-hour period. Construct
control charts using the Excel template xBar&R Chart. Verify the Excel calculations
of the control limits by hand using the formulas in the chapter. Does the process
appear to be in statistical control? Why or why not?
Mean = 3.526; Average range = 0.6733; A2 = 1.02; D4 = 2.57
x-bar chart:
Portions of the spreadsheet template are shown below:
x
OM5 C16 IM
© 2013 Cengage Learning. All Rights Reserved. May not be scanned, copied or duplicated, or posted to a publicly
accessible website, in whole or in part.
5
LCLx-bar
2.83718
Center
3.526
UCLx-bar
4.21482
LCLrange
0
Center
0.673333333
UCLrange
1.73316
OM5 C16 IM
© 2013 Cengage Learning. All Rights Reserved. May not be scanned, copied or duplicated, or posted to a publicly
accessible website, in whole or in part.
6
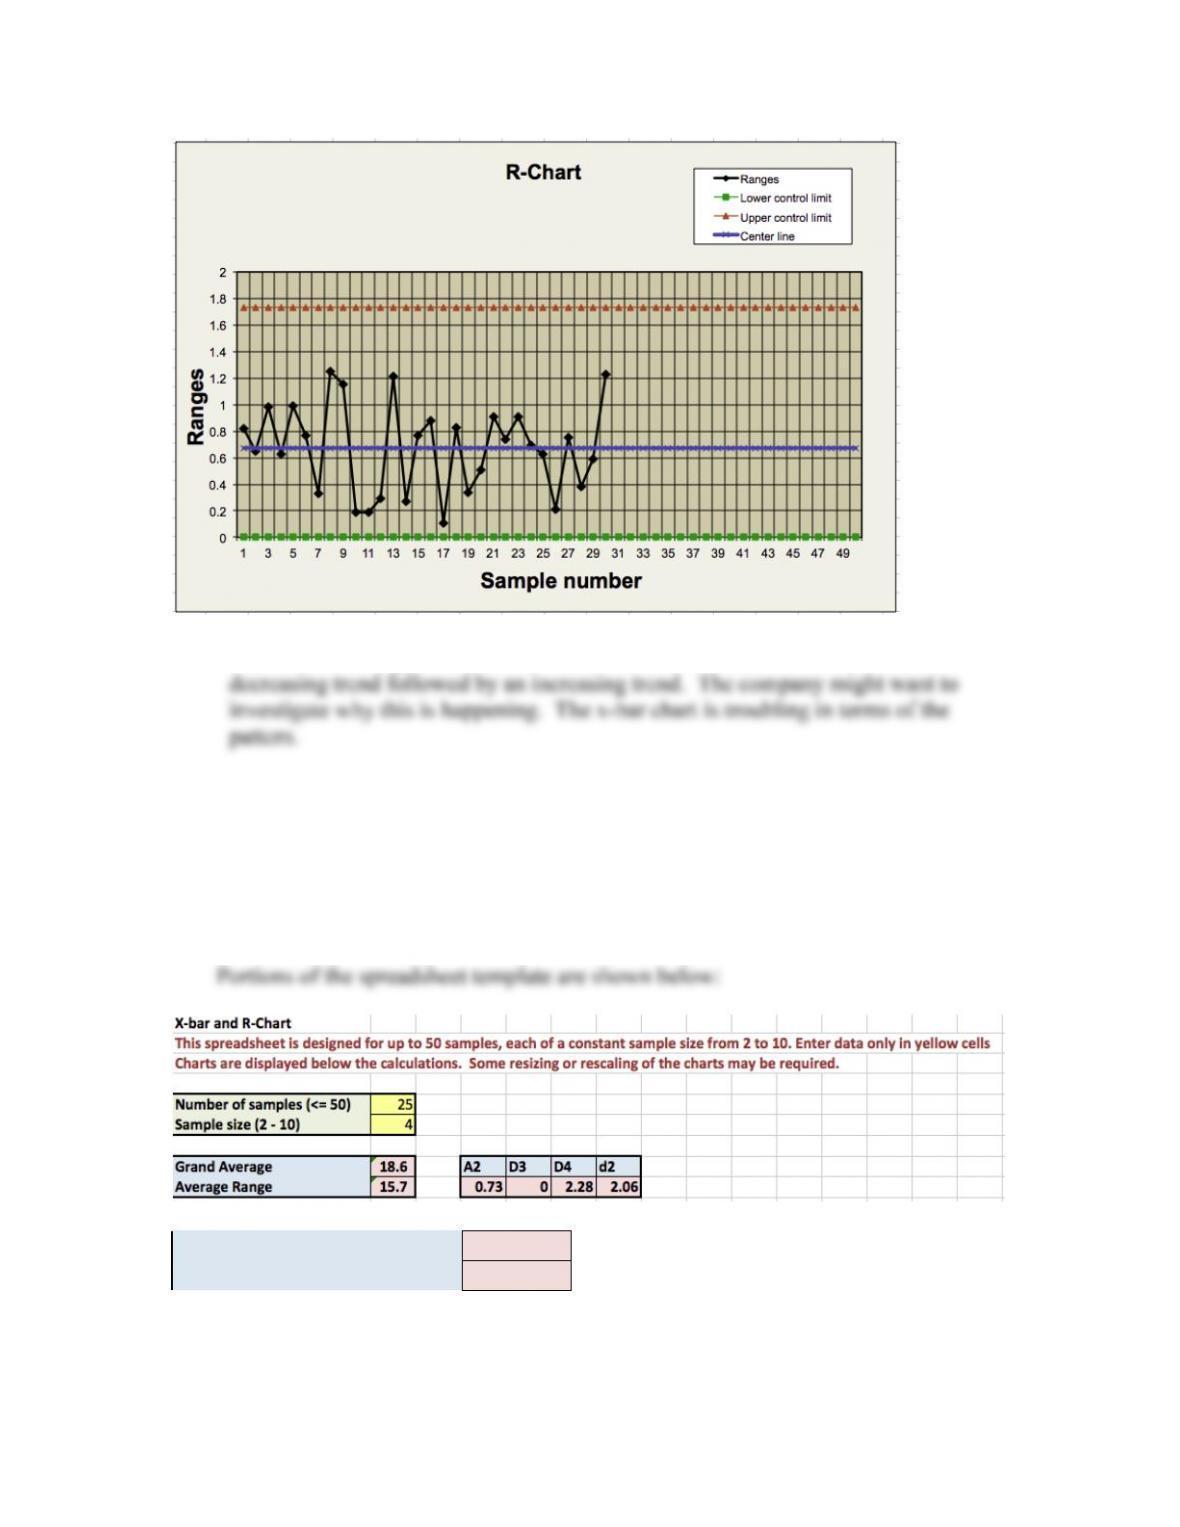
The R-bar chart appears to be in control but the x-bar chart seems to have a
5.* Tri-State Bank is investigating the processing time for loan applications. Samples
were taken for 25 random days from 4 branches. These data can be found in the
worksheet C16P5 in the OM5 Data Workbook. Construct control charts using the
Excel template xBar&R Chart. Verify the Excel calculations of the control limits
by hand using the formulas in the chapter. Does the process appear to be in
statistical control? Why or why not?
LCLx-bar
7.19928
Center
18.63
OM5 C16 IM
© 2013 Cengage Learning. All Rights Reserved. May not be scanned, copied or duplicated, or posted to a publicly
accessible website, in whole or in part.
7
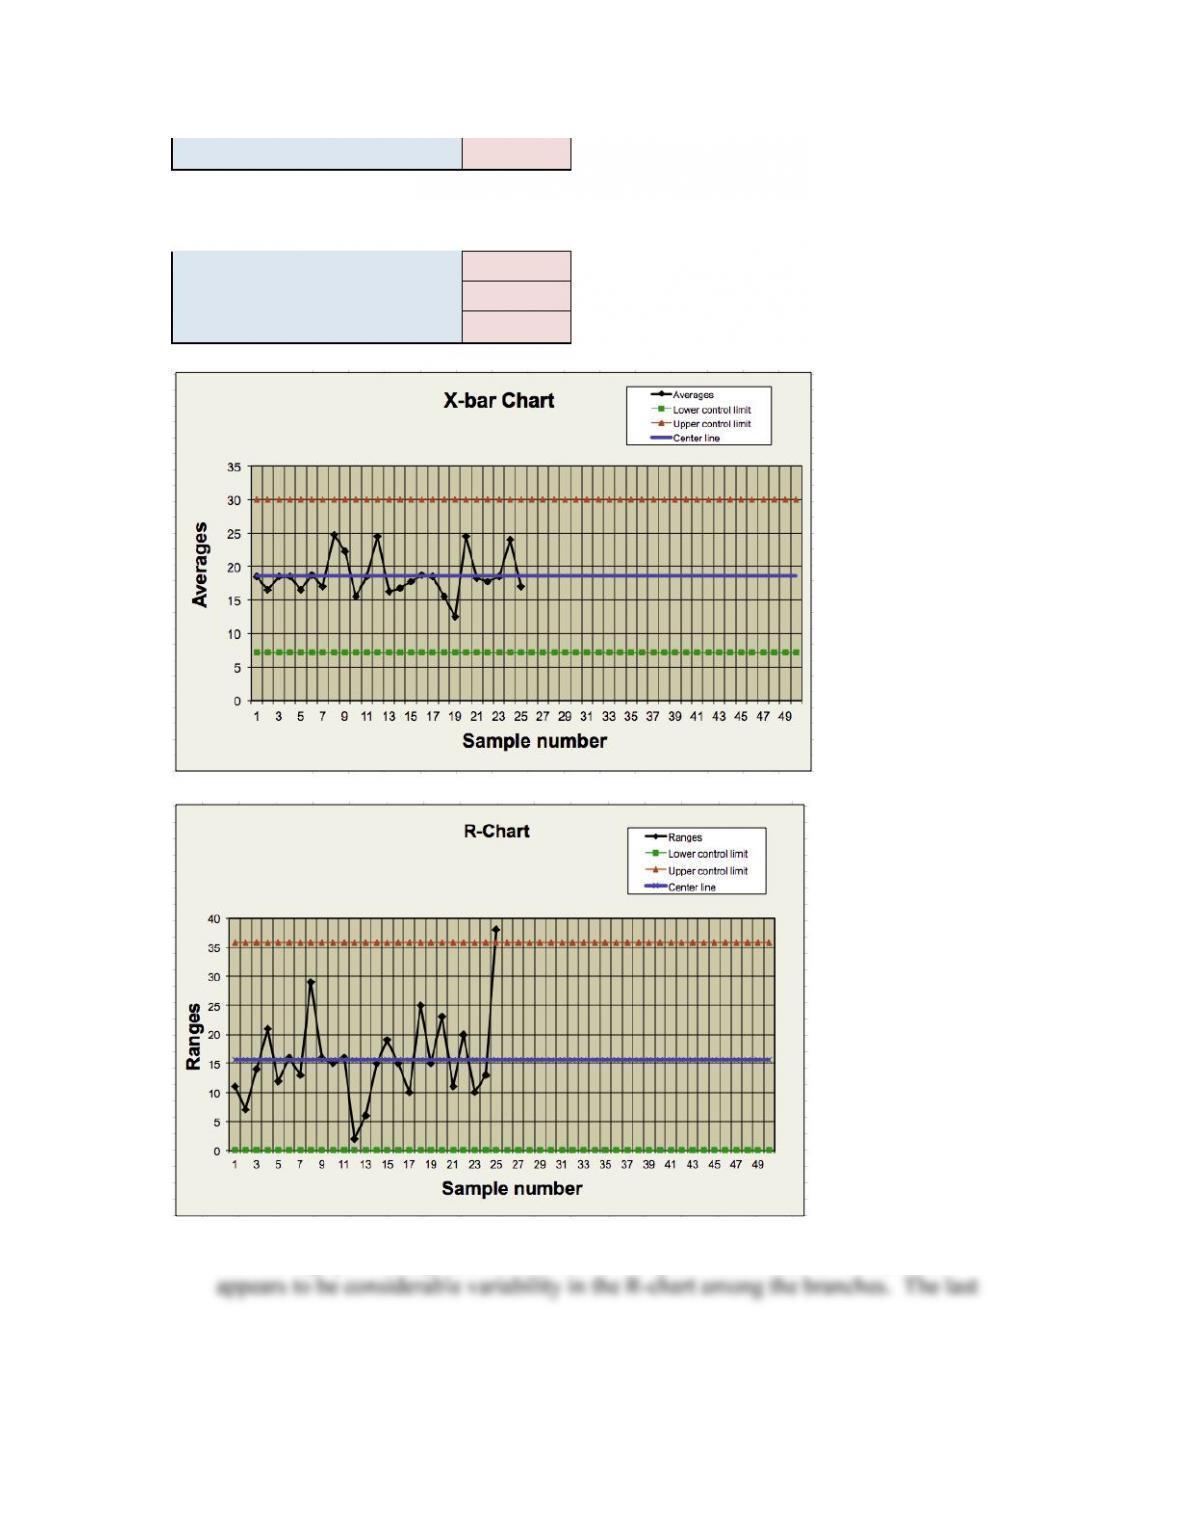
UCLx-bar
30.06072
LCLrange
0
Center
15.68
UCLrange
35.78176
The average processing times (x-bar chart) are quite consistent; however, there
OM5 C16 IM
© 2013 Cengage Learning. All Rights Reserved. May not be scanned, copied or duplicated, or posted to a publicly
accessible website, in whole or in part.
8
Ask your students “What might cause the R-chart variability?” Closer inspection of
6. Twenty-five samples of loan applications at a bank, each of size 150, resulted in a
total of 22 errors. Compute the control limits for a p-chart.
p-bar = 22/[(25)(150)] = 22/3,750 = 0.00587
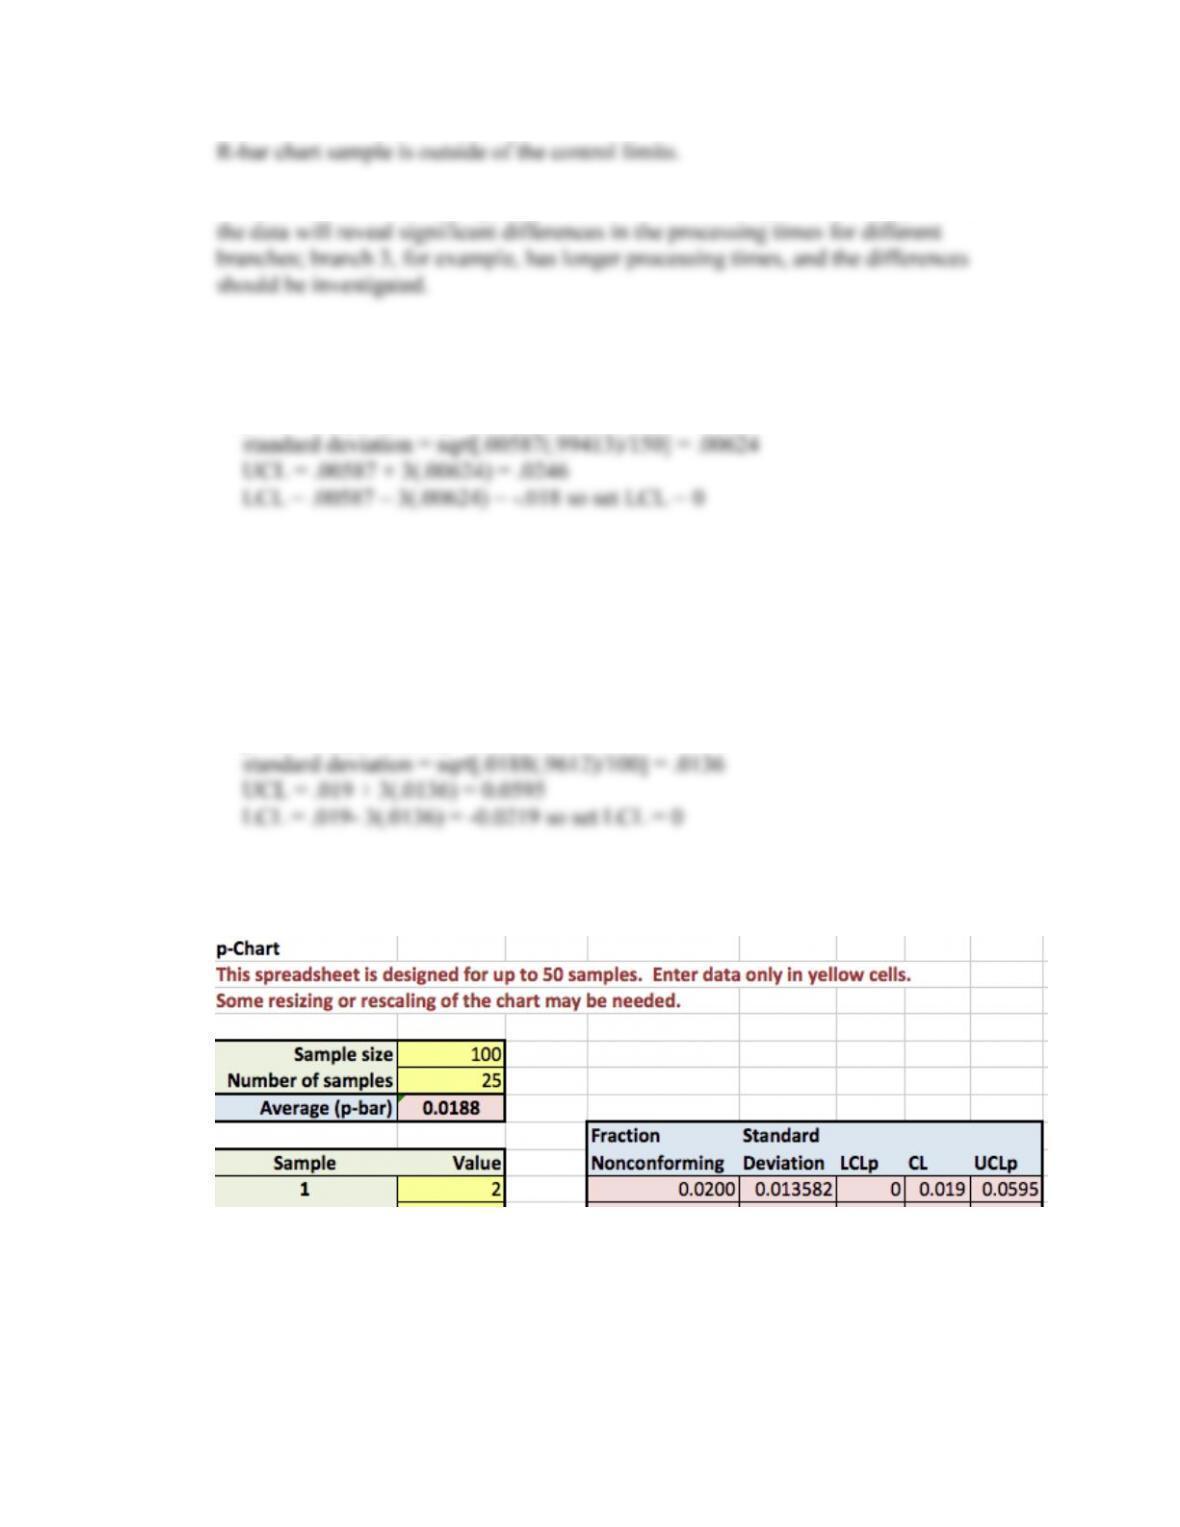
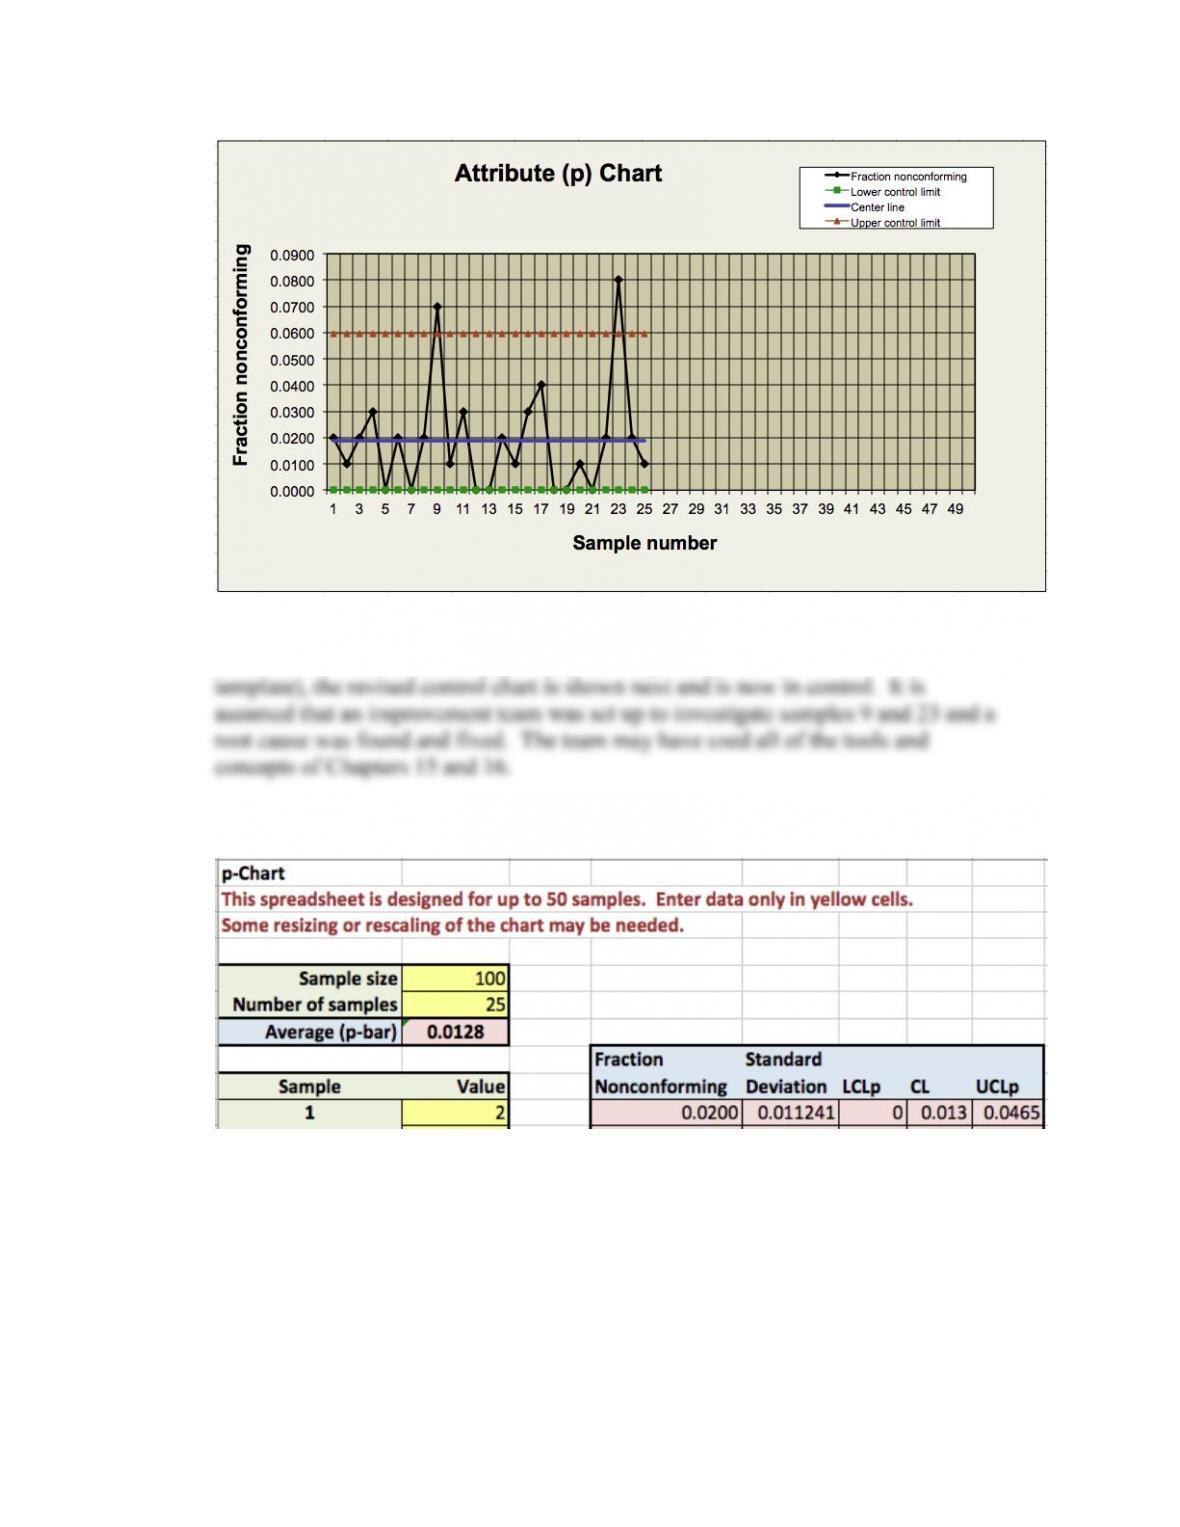
7.* One hundred insurance claim forms are inspected daily for 25 working days, and the
number of forms with errors are recorded in the worksheet C16P7 in the OM4 Data
Workbook. Construct a p-chart using the Excel template p-Chart. Verify the Excel
calculations of the control limits by hand using the formulas in the chapter. If any
special causes are identified, remove them from the data and construct a revised
control chart.
p-bar = 46/[(100)(25)] = 0.019
Portions of the Excel template are shown below:
OM5 C16 IM
© 2013 Cengage Learning. All Rights Reserved. May not be scanned, copied or duplicated, or posted to a publicly
accessible website, in whole or in part.
9
Samples 9 and 23 are outside of the control limits and are most likely due to a special
cause. If these are removed (by simply deleting the cells in column B of the