
OM4 C13 IM
Case Teaching Note: Greyhound Frequent Flyer Call Center
Note: This case can be used with OM 4 Chapters 7, 10 and/or 13 depending on the
judgment and guidance of the instructor(s). Excel models with case data accompany
OM4 files.
Overview
The case begins by the following scenario:
“I’m an accounting major, not an operations expert,” yelled just-promoted Bob
Barthrow, the Executive Vice President of the Greyhound Frequent Flyer Call Center,
during a senior level management meeting. “Bob, Horizon Airlines (HA) is going to stop
doing business with us if we don’t provide better call center service. We need to
maximize service and minimize costs! So, find a solution to HA’s service problems or we
are all out of a job,” stated Adam Bishop, the Chief Executive Officer of Greyhound Call
Center Services (GCCS).
Bob retreated to his office and closed the door. As he sat in his chair, he thought
about the many meetings he had participated in where managers “promised great
customer service but could not deliver it.” Upon further reflection, he came to the
conclusion that to promise great customer service you first had to know how to analyze
resource capacity and develop good schedules. He pulled out his old college operations
management textbook and began reading. He also did a Google search on the topics and
found several articles to read. He planned on building an electronic spreadsheet analysis
of the situation.
Student must follow the four-step process described in the case and use Equation
7.2 to baseline current staff capacity and schedules, and then develop a better schedule.
This case can be used after covering OM4 Chapter 7 or 10 while C13 and C14 add more
depth of understanding. It all depends on how much the instructor leads the students. We
usually do the case after having covered Chapters 7 and 10 only. The case takes about
45-60 minutes to do on the board or teams can present the case to the class and the
instructor leads the discussion.
Case Decisions
Bob decides to answer the following questions and present answers to Adam next week.
He knows his accounting but if he is to be promoted, he must also demonstrate to
management he can “analyze a process and successfully manage it.”
Is the main problem lack of staff capacity or poor scheduling or both?
1
OM4 C13 IM
1. Analyze the case data and current schedule, and answer the following “baseline”
questions. What’s labor utilization for each thirty-minute period given their current
staffing plan? Is the main problem lack of staff capacity or poor scheduling or both,
and can you support you answer with numerical analysis?
See TN Exhibits A, B &C to answer issues in case question (1). From Exhibit B we
see that current CSR utilization ranges for 38% to 160% with high variability—this is
evidence of a scheduling problem. From Exhibit B, we also see 163.5 units of
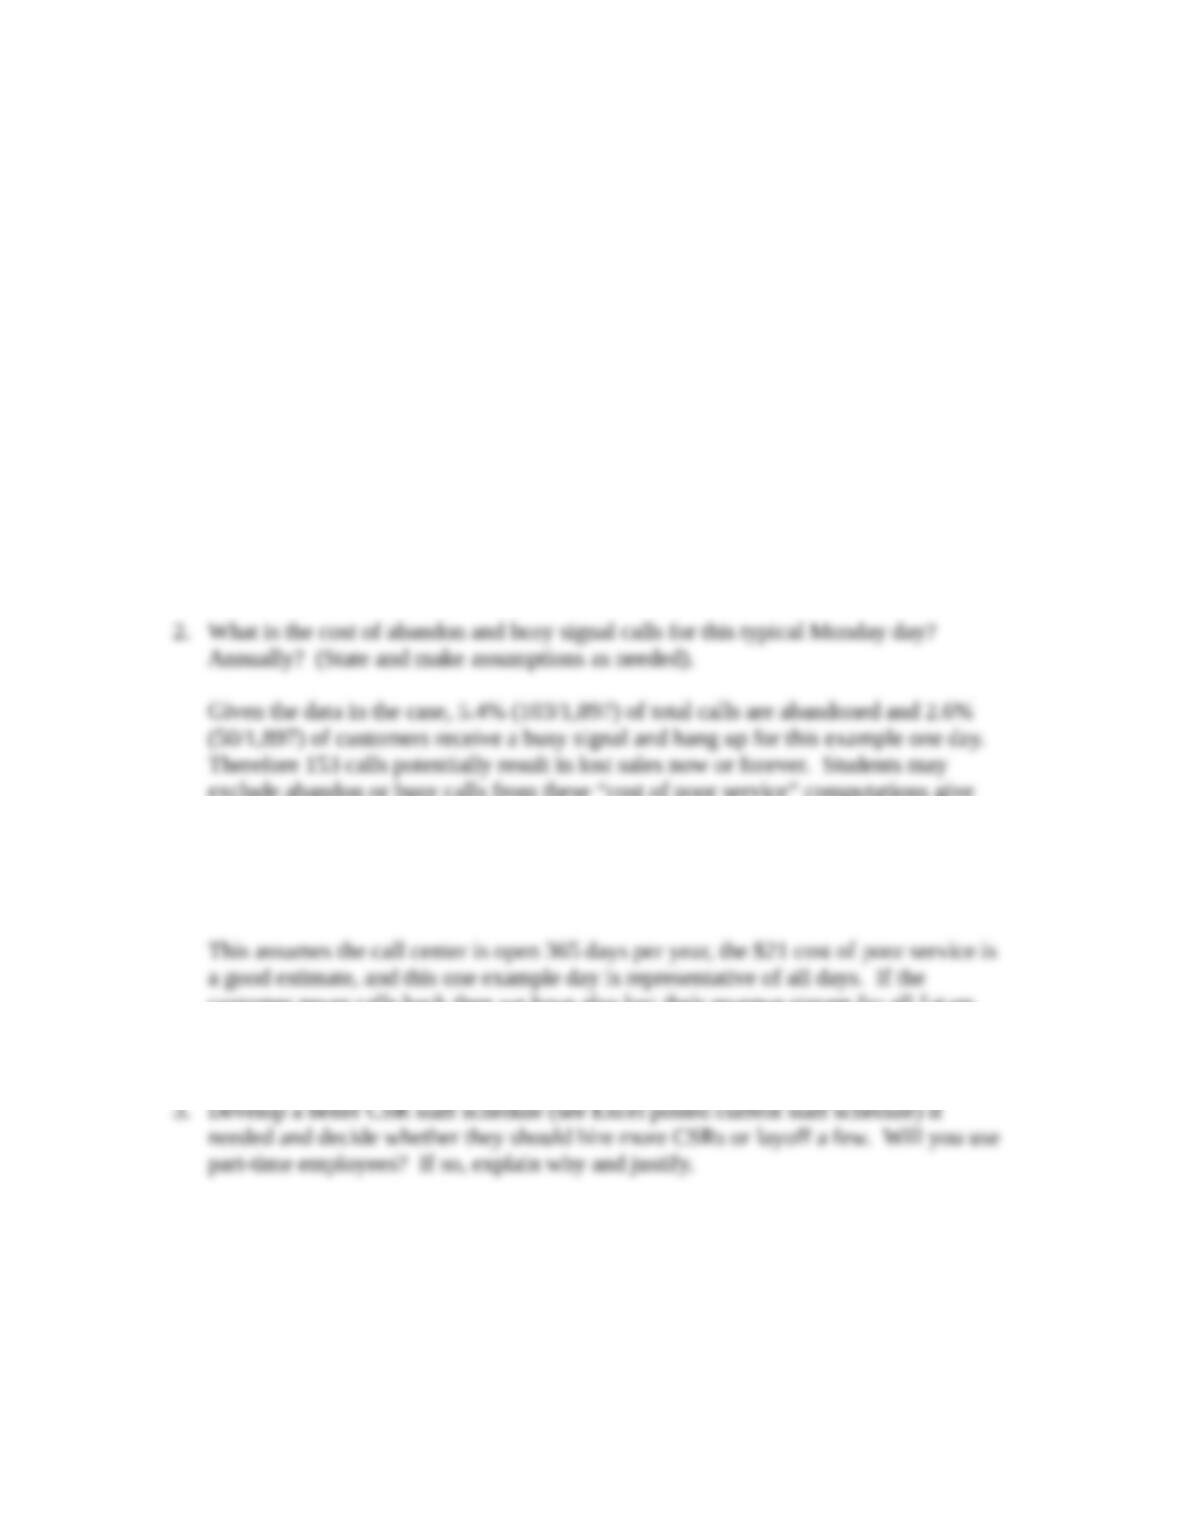
2. What is the cost of abandon and busy signal calls for this typical Monday day?
Annually? (State and make assumptions as needed).
Given the data in the case, 5.4% (103/1,897) of total calls are abandoned and 2.6%
(50/1,897) of customers receive a busy signal and hang up for this example one day.
Estimated Cost of Abandon and Busy Signal Calls per Year = (153 calls/day)(365
days/year)($21/call) = $1,172,745
This assumes the call center is open 365 days per year, the $21 cost of poor service is
a good estimate, and this one example day is representative of all days. If the
3. Develop a better CSR staff schedule (see Excel posted current staff schedule) if
needed and decide whether they should hire more CSRs or layoff a few. Will you use
part-time employees? If so, explain why and justify.
See the TN Staff schedule discussion and schedules.
2
OM4 C13 IM
Analysis of the Case Data and Exhibits
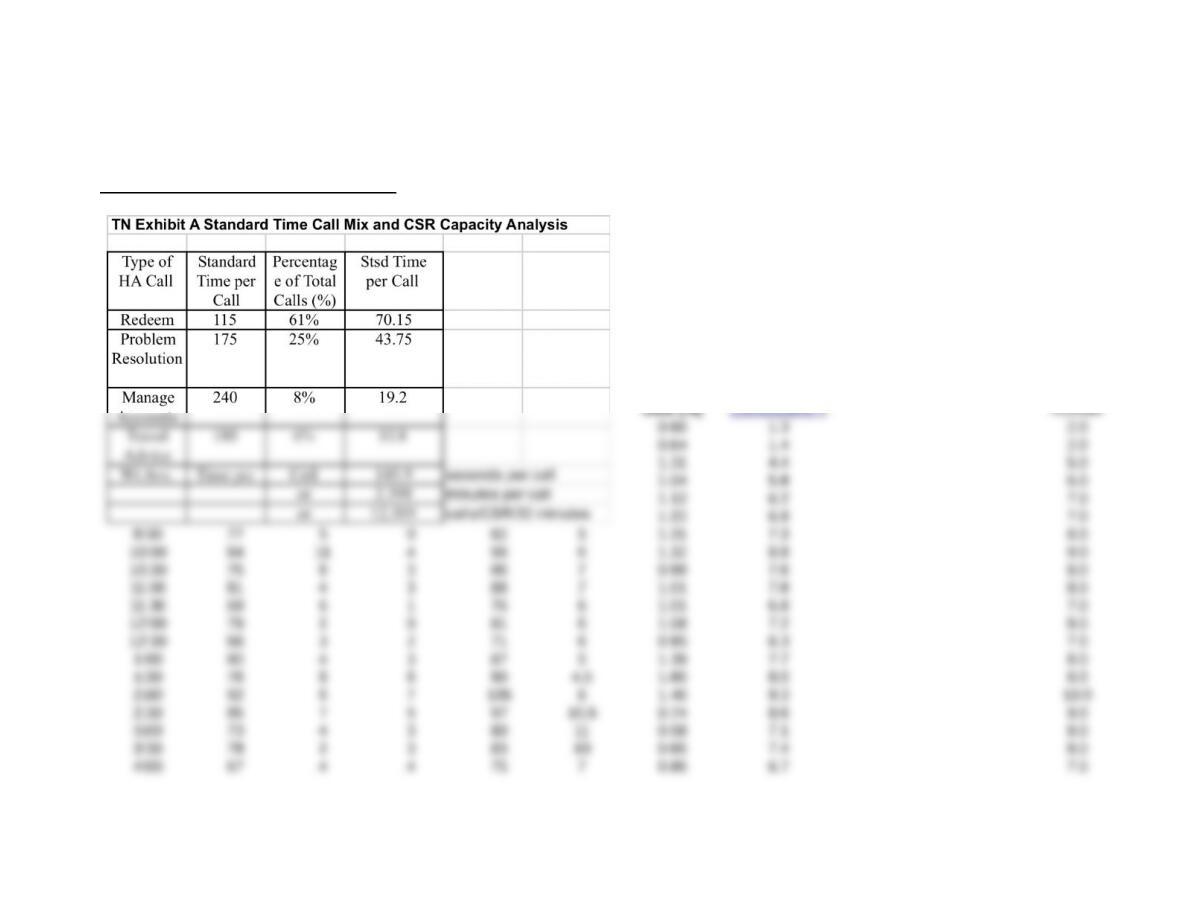
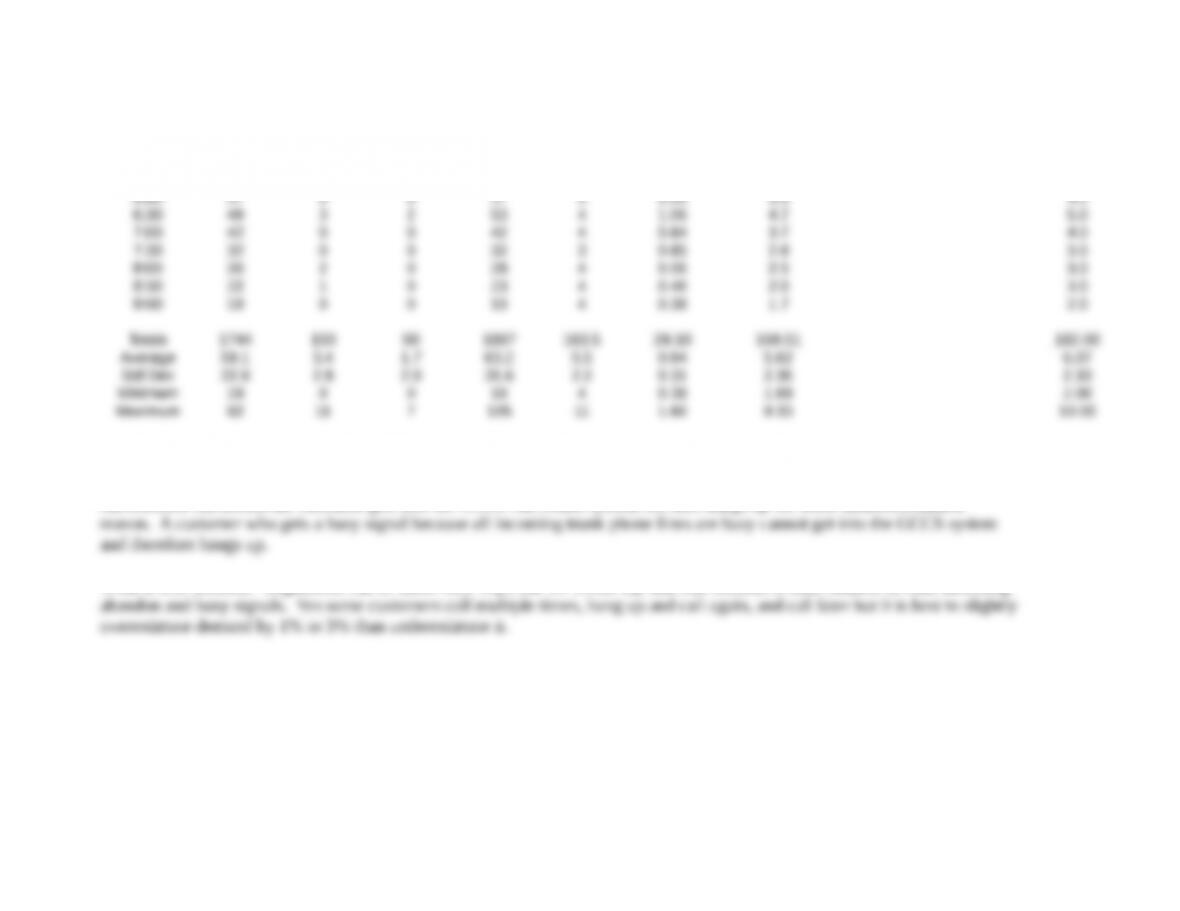
TN Exhibit B CSR Demand – Capacity Analysis
Time
Period
Number of Number
of
Number of Total
Calls
Current Equation
7.2 Equation 7.2 Rounded
Calls Taken Abandon Busy
Signal
Number
of Current Target to Next
Calls by Calls CSRs CSR Number of Highest
Customer Not Taken On-Duty Utils (%) CSRs@90% + Number
3
OM4 C13 IM
4:30 62 2 0 64 7 0.73 5.7 6.0
5:00 54 1 0 55 4.5 0.98 4.9 5.0
5:30 51 1 1 53 5 0.85 4.7 5.0
6:00 37 0 0 37 5 0.59 3.3 4.0
Note (+): Standard time of 12.51 calls/CSR/30 minutes. We rounded here to integers but some students will round to
one-half FTEs since with breaks you can have say 1.5 or 4.5 FTEs per 30-minute time period. .
An abandon call means the customer gets into the GCCS call center system but then hangs up for some underdetermined
What is true demand? Arguments can be made both ways but we would say that true demand is total number of calls including
4
OM4 C13 IM
CURRENT and BLANK
STAFF SCHEDULE
WORKSHEETS (6:30 am
to 2:00 pm)
5
OM4 C13 IM
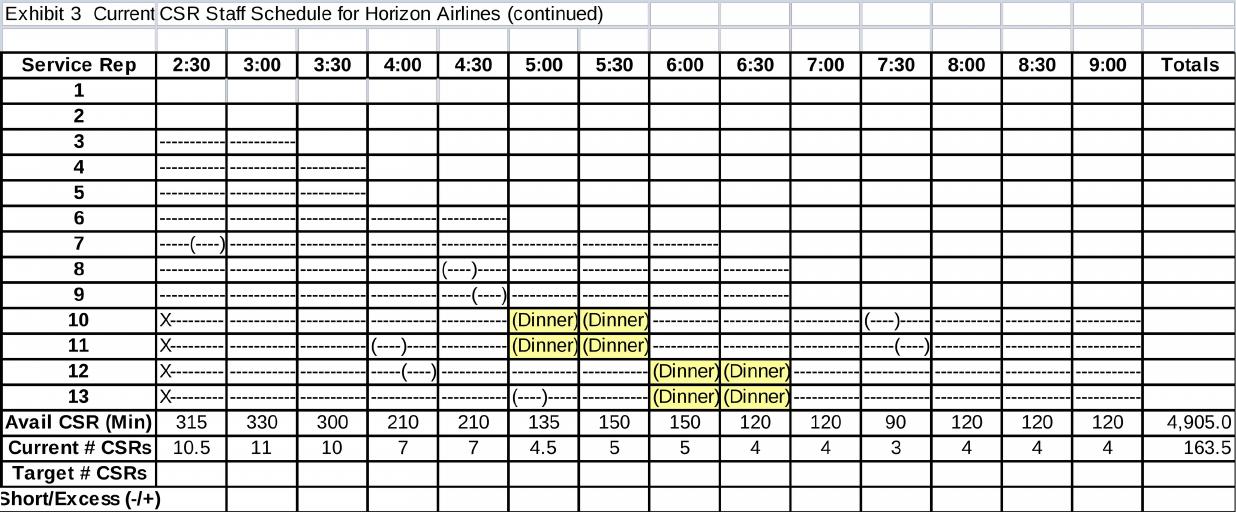
CURRENT and BLANK STAFF SCHEDULE WORKSHEETS (2:30 PM TO 9:00 PM)
6
OM4 C13 IM
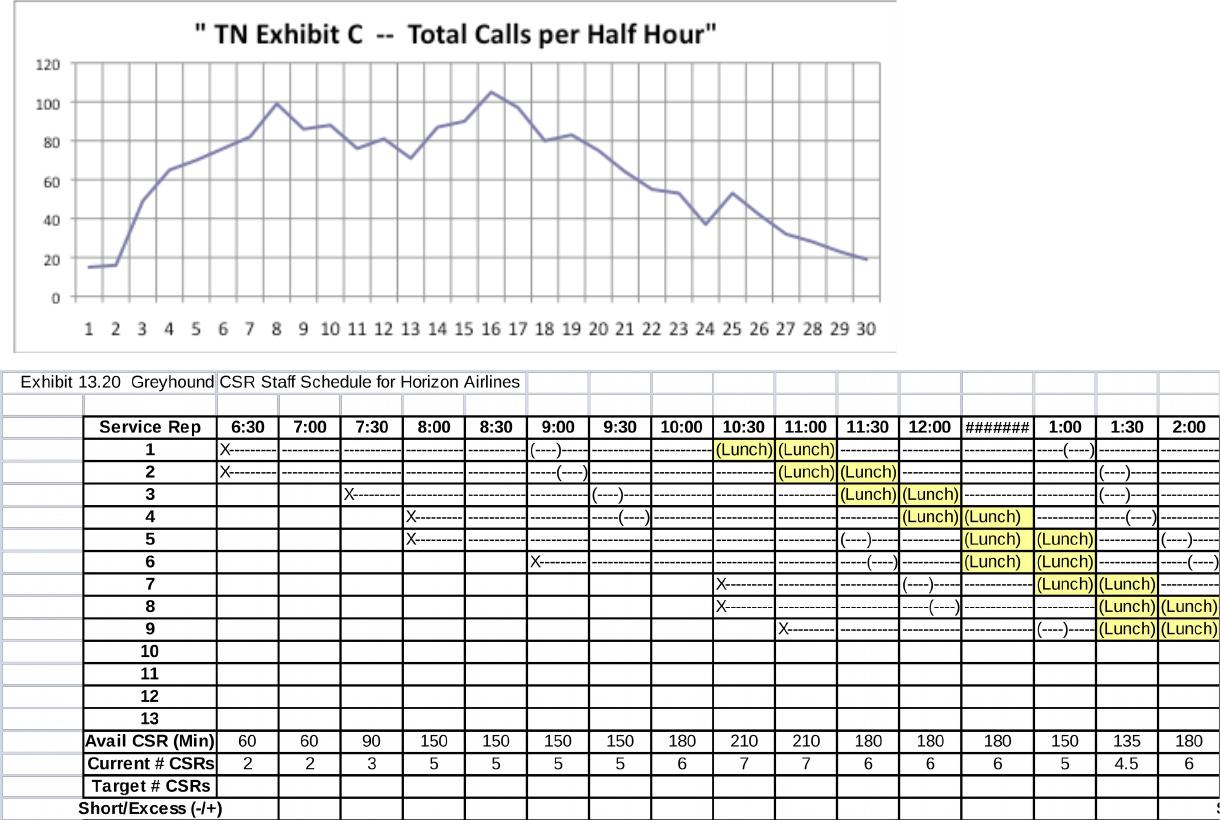
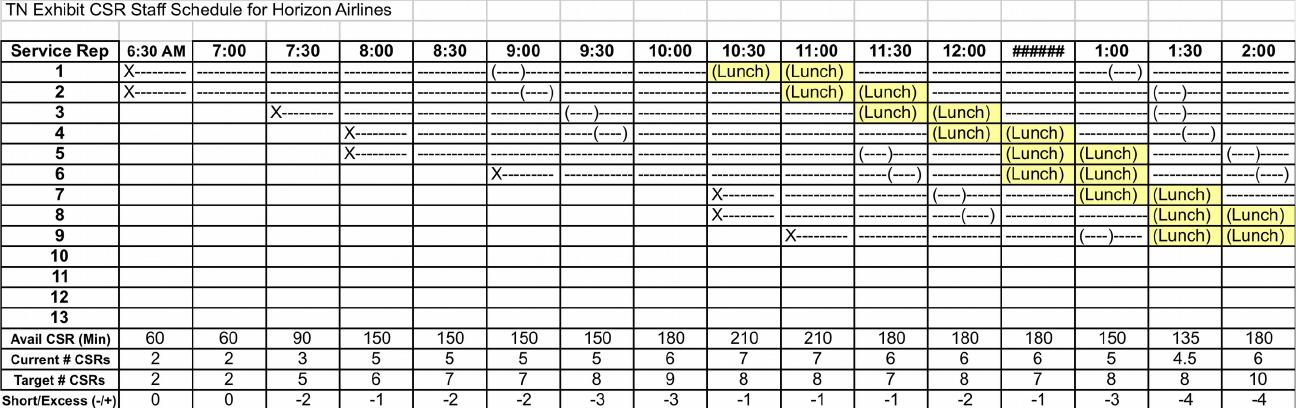
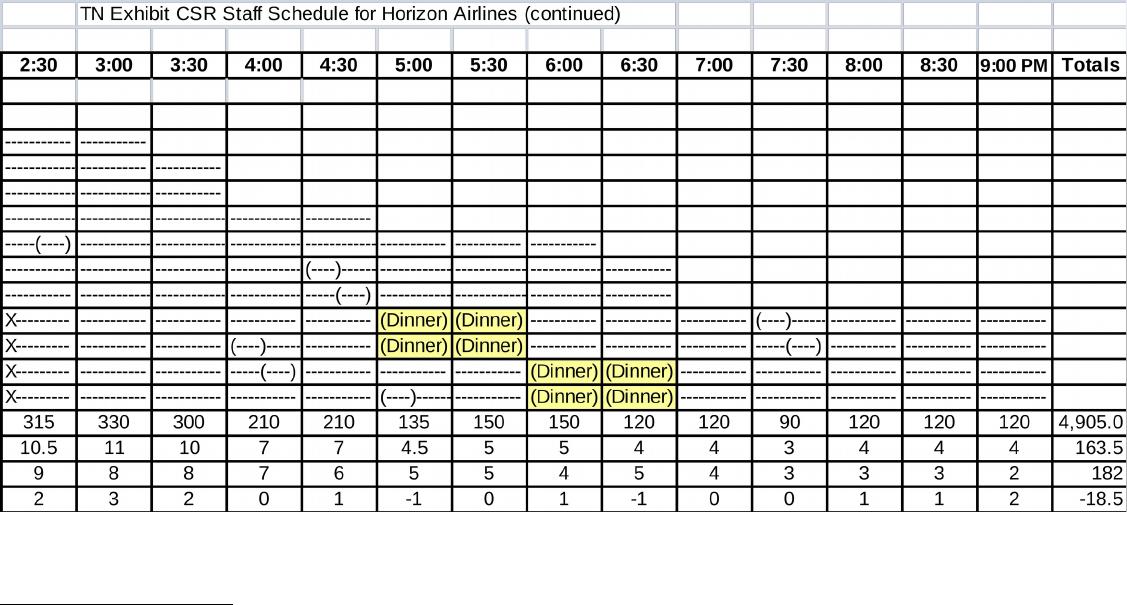
The current staff schedule is 13 employees with 9 full time (FTE greater than 7 hrs plus 1 hr lunch + at least one 15 minute
The following TN staff schedules show you what to expect from your students. They need to move staff capacity around to
meet (match) demand so they can maximize service and minimize costs. They often graph demand and overlay the staff
schedule on top of it. Make sure you point out to them that if managers are not capable of creating a good resource schedule it
(4)What are your final recommendations? Explain and justify.
Students will make a wide variety of recommendations. Typical staffing plans depending on assumptions range from (a)
fifty percent full-time and fifty percent part-time employees to meet call center demand, (b) 100% full time, and (c) some
More service management training of full- and part-time CSRs
Add additional phone line(s) – they could be a bottleneck (out of bounds of case but worth thinking about)
You will find student graphs of demand and capacity to be very well done and colorful.
7
OM4 C13 IM
8
OM4 C13 IM
Teaching Appraoch
You might begin class by asking the students if they have experienced service upsets and long waits due to poor capacity or
staffing decisions. Let them tell their stories and then ask them “Any idea if the root cause was a capacity or scheduling
problem or both? Once you have established that only OM skills can create the right mix of capacity and schedules to
maximize service and minimize costs one way to continue is to go through the four case questions. Another way is have teams
present their case analyses and moderate class discussion. The case takes about 30-60 minutes to do depending on how much
you want to cover. Make sure you do a few example computations so all students see how the numbers were found. By the
way, the resource doesn’t have to be labor — it can also be trucks, servers, machines, and so on. Have fun!
9