9.* Environmental considerations, material losses, and waste disposal can be included in the
EOQ model to improve inventory management decisions. Assume that the annual demand
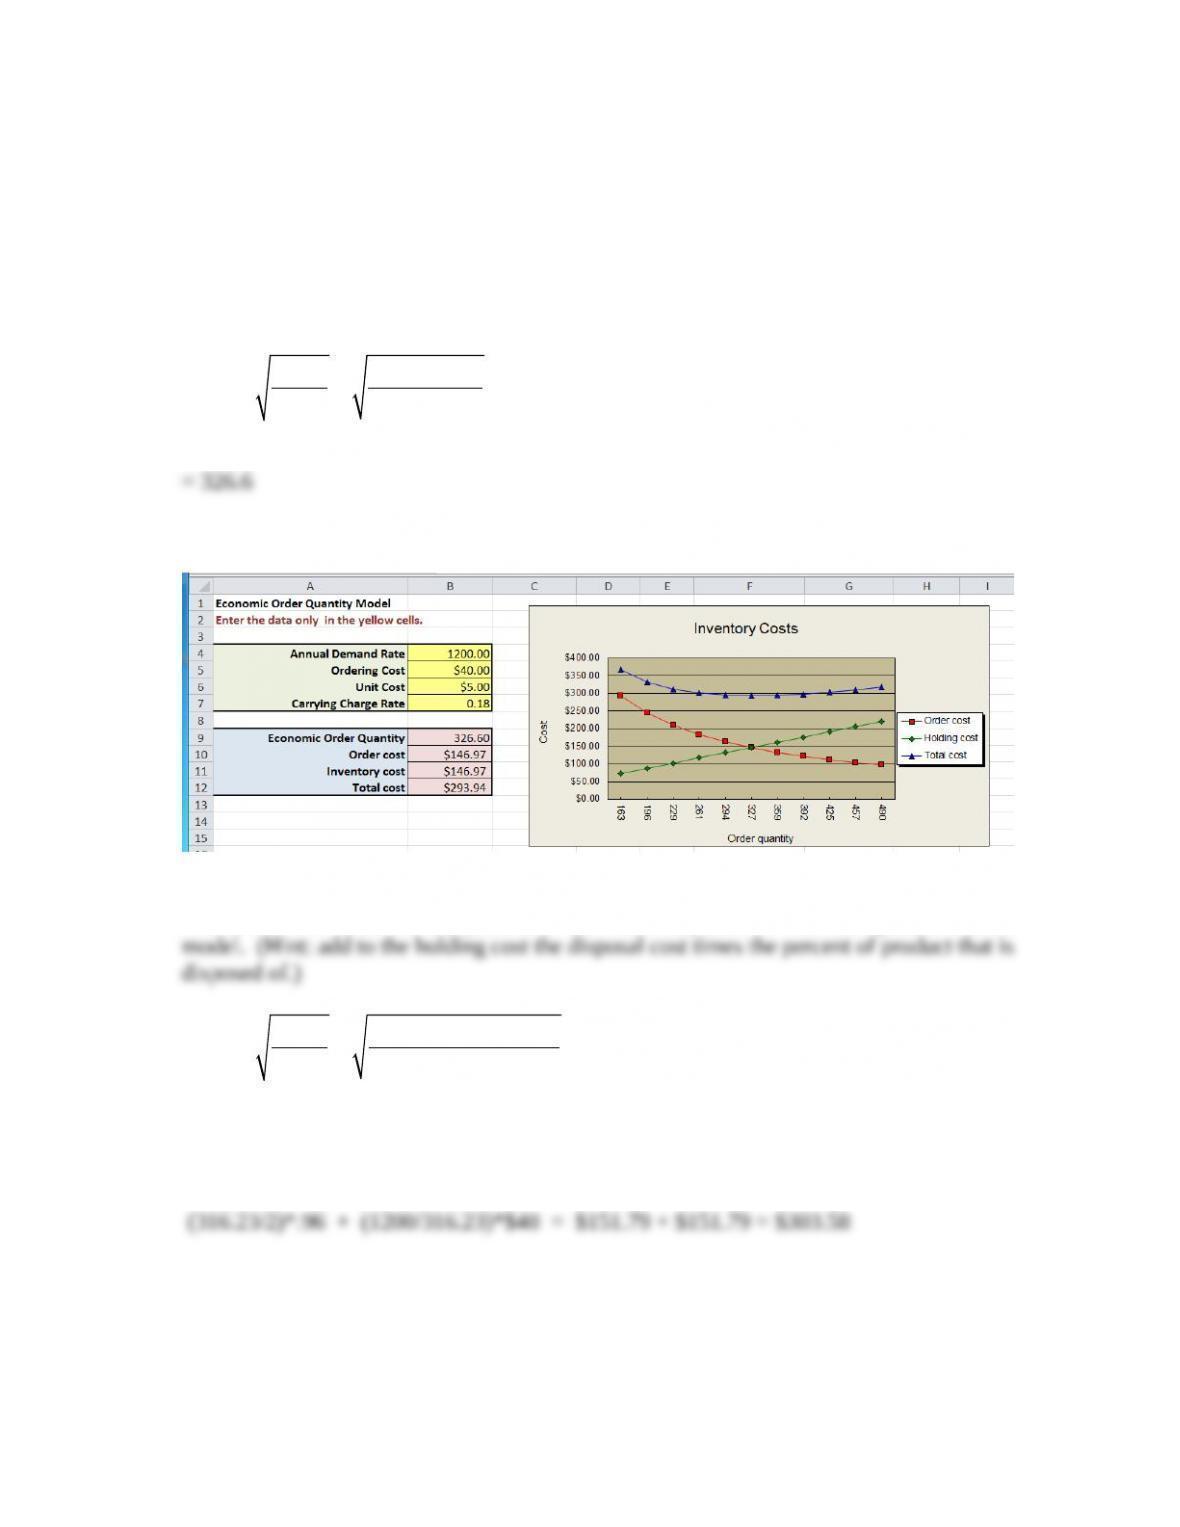
for an industrial chemical is 1,200 lb, item cost is $5/lb, order cost is $40, inventory-holding
cost rate (percent of item cost) is 18 percent.
a. Find the EOQ and total cost assuming no waste disposal.
EOQ =2DC
o
C
h
=2(1200)(40)
(.18)(5)
Using the EOQ spreadsheet template, we have:
b. Now assume that 8 percent of the chemical is not used and disposed of, with a disposal
cost of $0.75/lb. Find the EOQ and total cost when disposal costs are incorporated into the
Although the total cost is slightly higher ($303.58 versus $293.94), by adjusting the
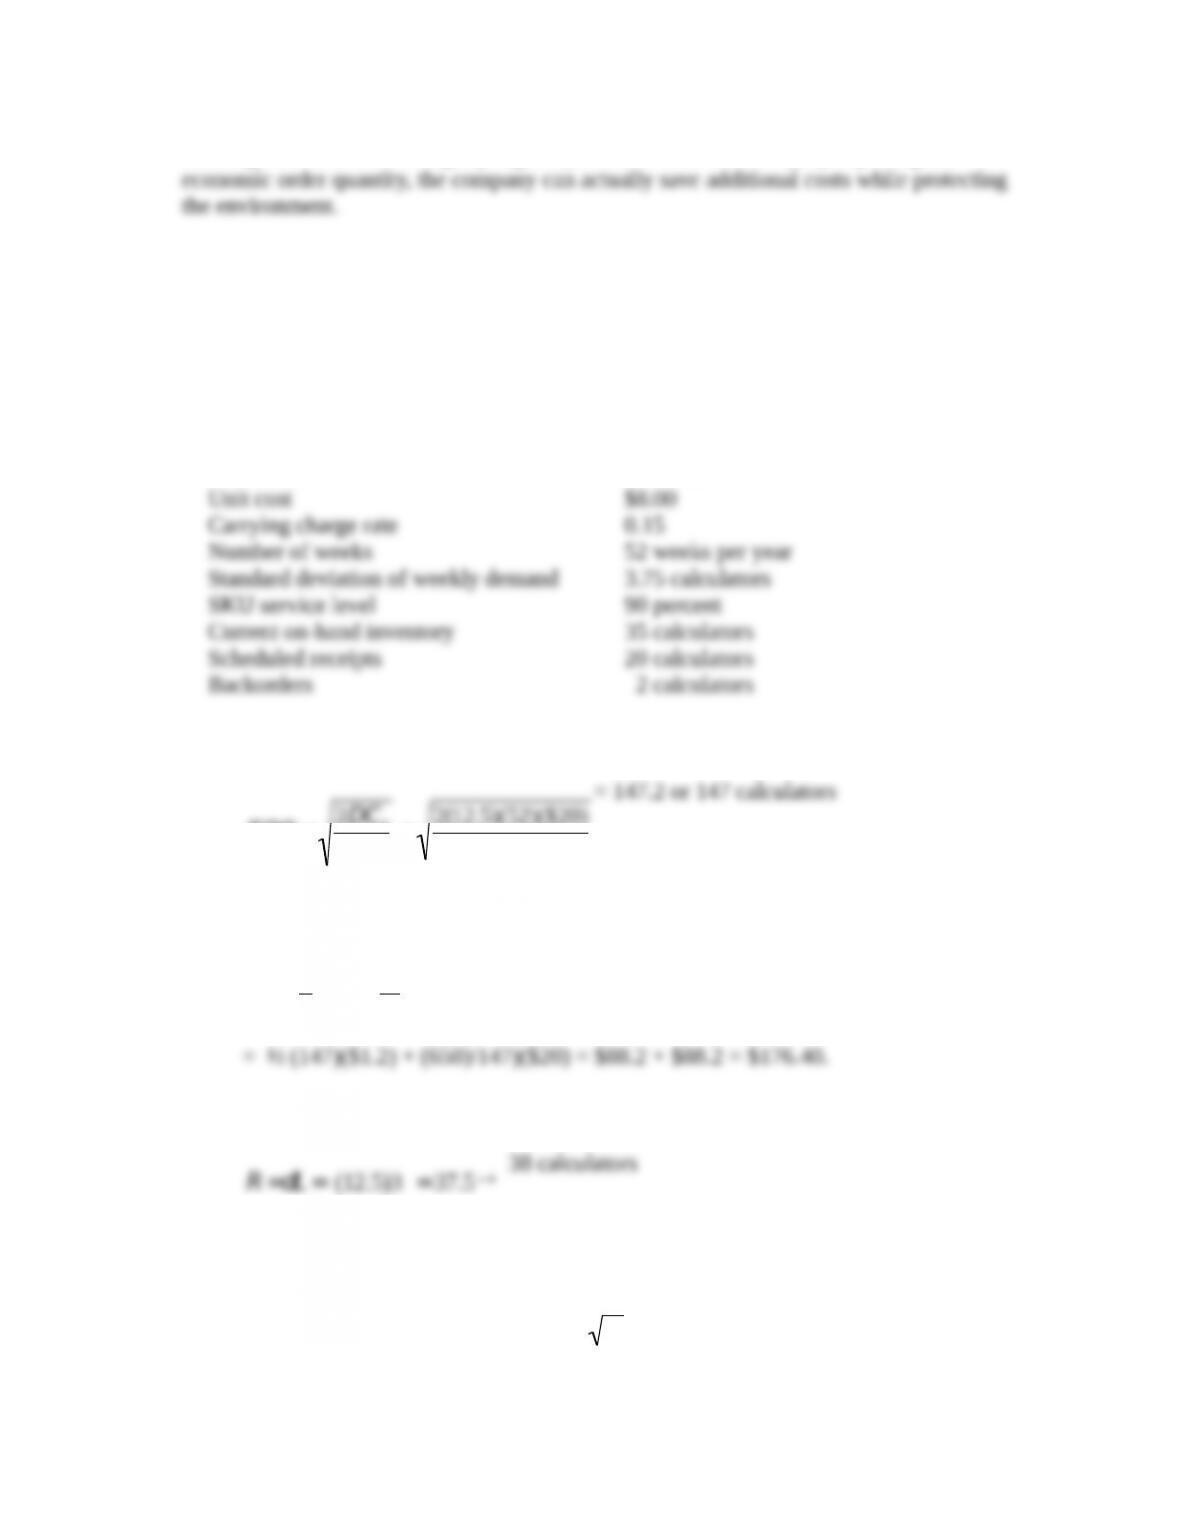
10.* High Tech, Inc. is a virtual store that stocks a variety of calculators in their warehouse.
Customer orders are placed, the order is picked and packaged, and then shipped to the
customer. A fixed order quantity inventory control system (FQS) helps monitor and control
these SKUs. The following information is for one of the calculators that they stock, sell, and
ship.
Average demand 12.5 calculators per week
Lead time 3 weeks
Order cost $20/order
a. What is the Economic Order Quantity?
EOQ =2DC
o
C
h
=2(12.5)(52)($20)
1.2
= 147.2 or 147 calculators
b. What is the total annual order and inventory-holding costs for the EOQ?
TC =1
2QCh+D
QCo
c. What is the reorder point without safety stock?
R=dL = (12.5)3 =37.5
d. What is the reorder point with safety stock?
R=dL +zs
L
= (12.5)3 + 1.28(3.75) 3) =37.5 +8.3 =45.6
46 calculators
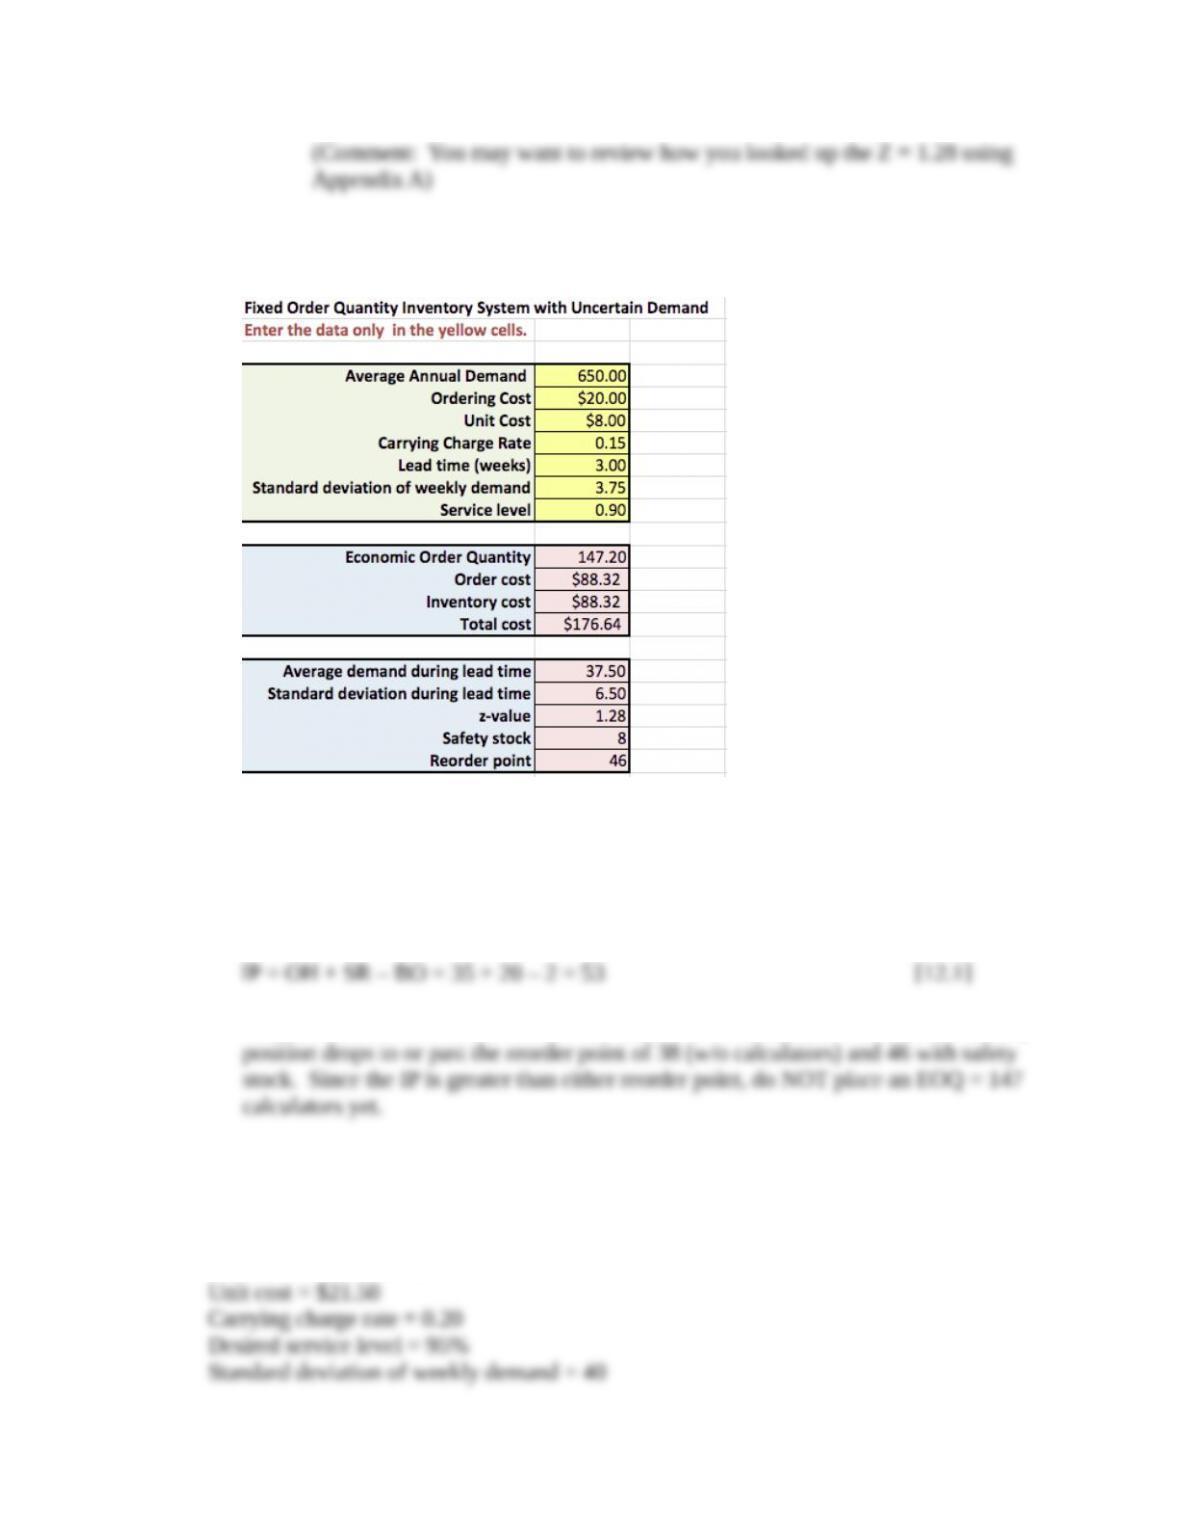
Most of these calculations can also be found using the FQS Safety Stock Excel
template:
e. Based on the previous information, should a fixed order quantity be placed, and if so,
for how many calculators?
Inventory position (IP) is defined as the on-hand quantity (OH) plus any orders placed but
which have not arrived (called scheduled receipts, SR), minus any backorders (BO), or
FOQ Order Decision Rule: Place a new order for 147 calculators when the inventory
11.* Crew Soccer Shoes Company is considering a change of their current inventory control
system for soccer shoes. The information regarding the shoes is given below.
Average demand = 250 pairs/week
Lead time = 3 weeks
Order cost = $75/order
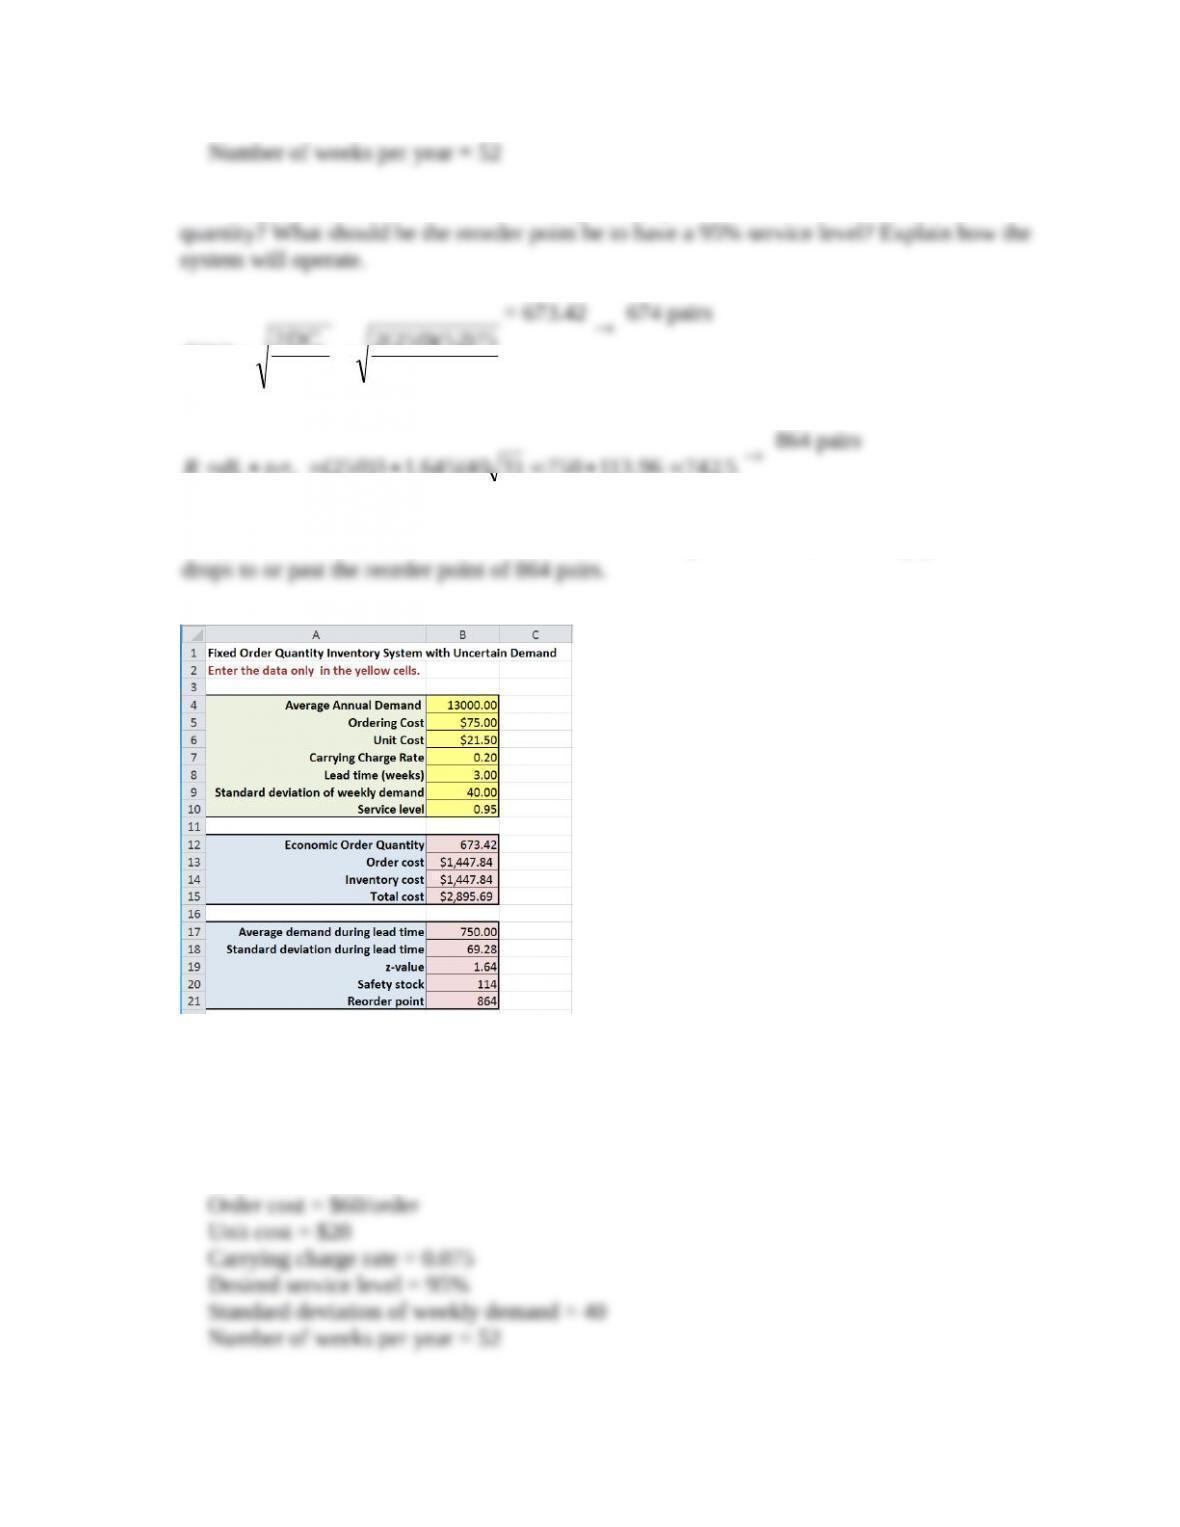
The company decides to use a fixed order quantity system. What is the economic order
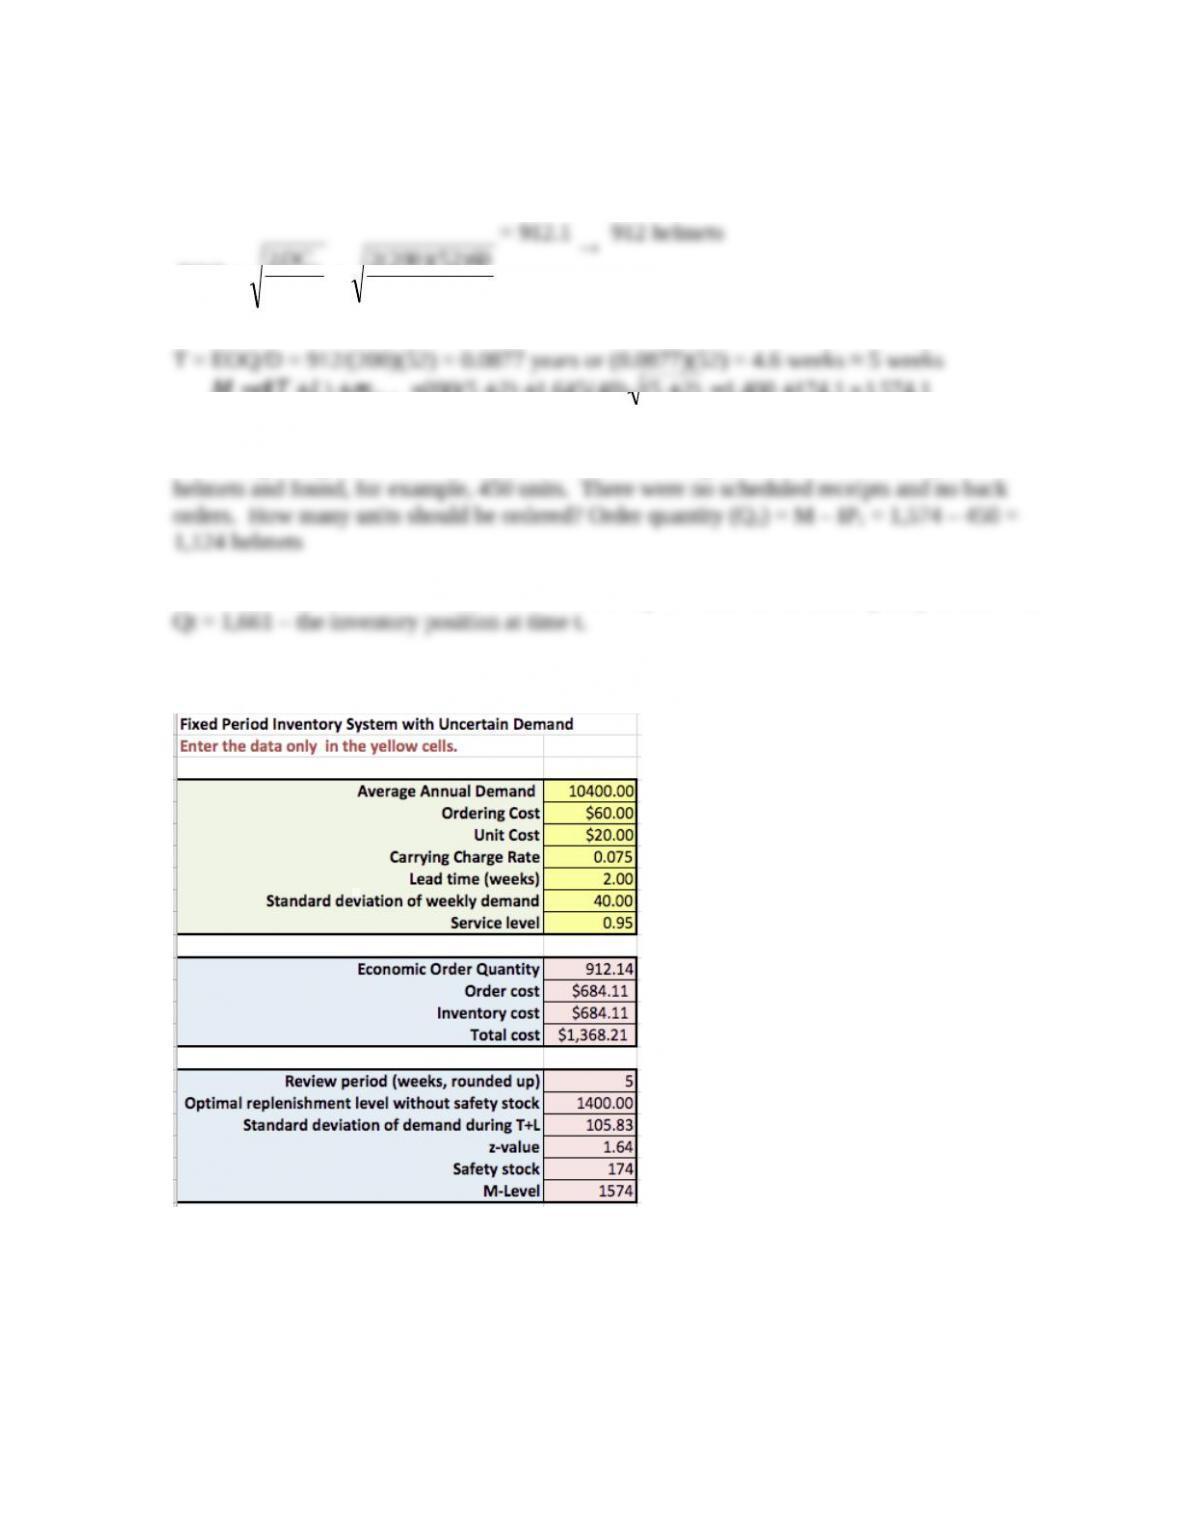
Compute T and M for a fixed period inventory system model with and without safety stock.
Explain how this system would operate.
M=d(T+L)+zs
T+L
=200(5 +2) +1.645(40) (5 +2) =1,400 +174.1 »1,574.1
At the beginning of the current week, the materials manager, checked the inventory level of
FPS Order Decision Rule: Place a new order every 5 weeks for an order quality at time t of
The spreadsheet template FPS Safety Stock may be used to perform the basic calculations:
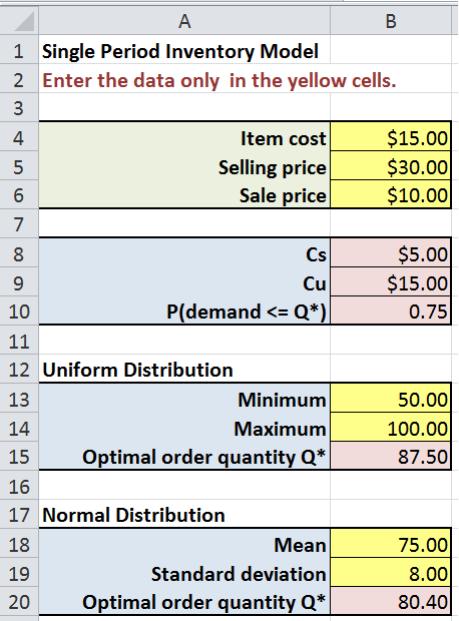
13.* Suzie’s Sweetshop makes special boxes of Valentine’s Day chocolates. Each costs $15 in
material and labor and sell for $30. After Valentine’s Day, Suzie reduces the price to $10.00
and sells any remaining boxes. Historically, she has sold between 50 and 100 boxes.
Determine the optimal number of boxes to make. How would her decision change if she can
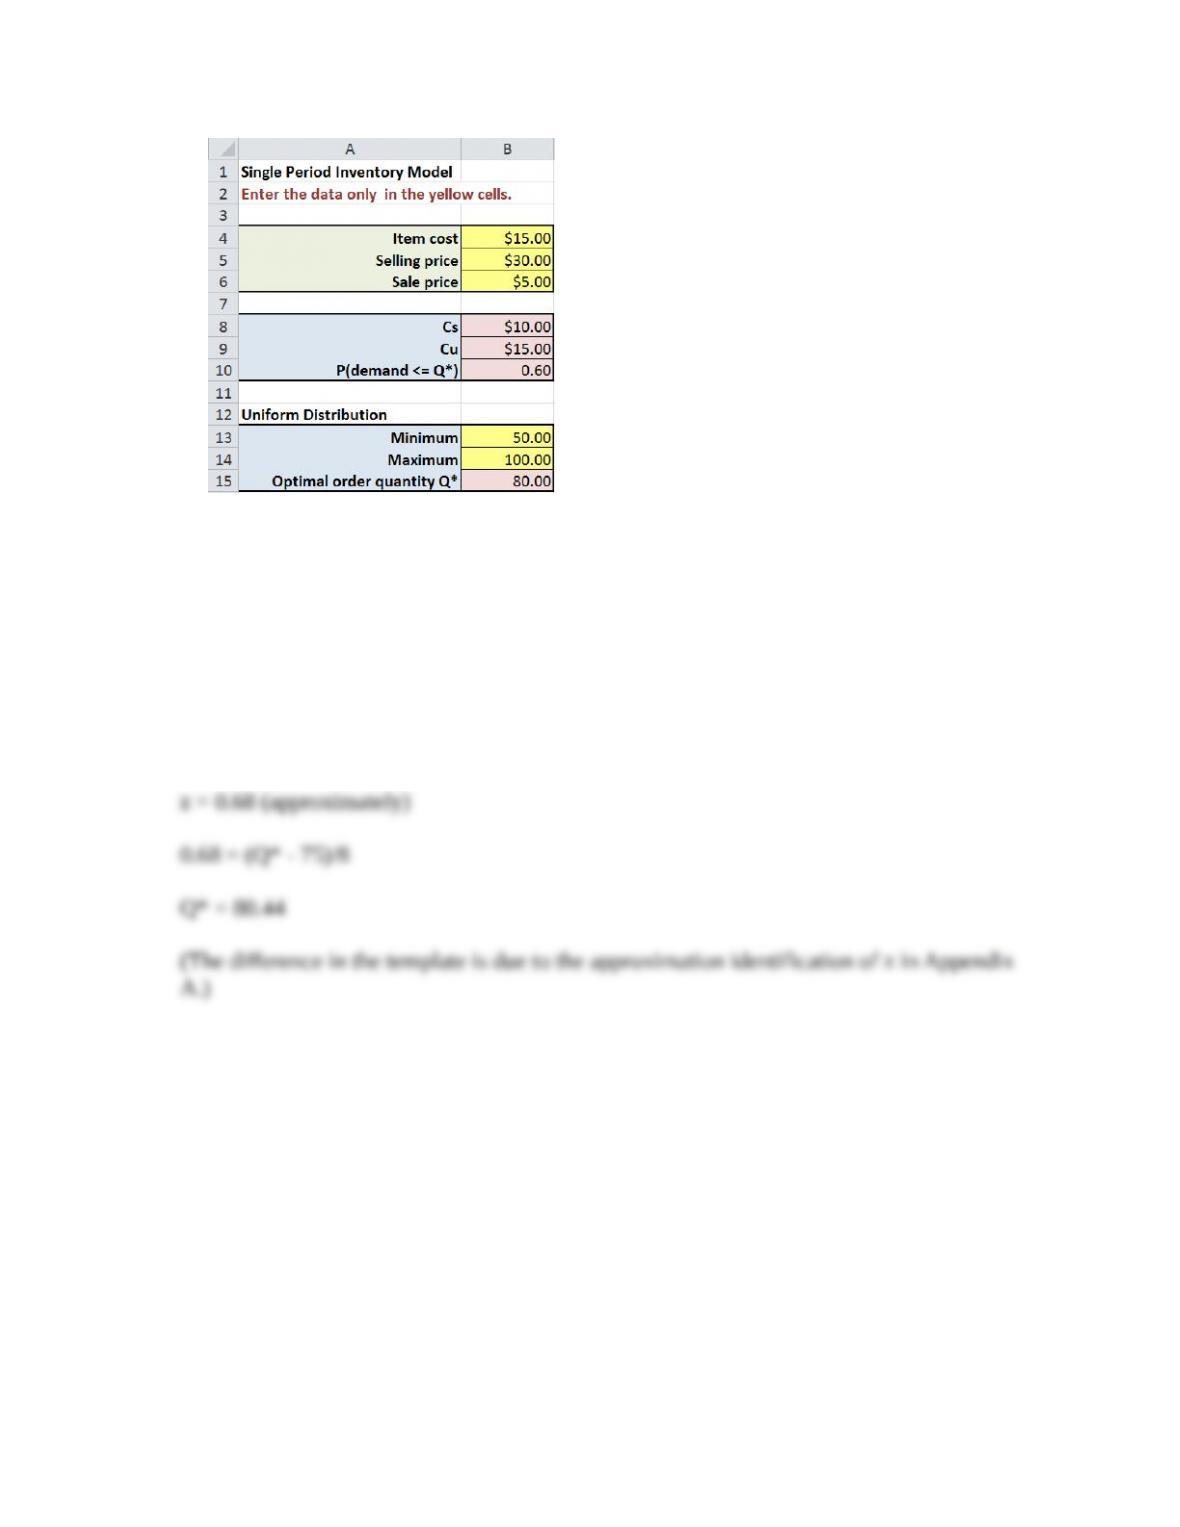
only sell all remaining boxes at a price of $5?
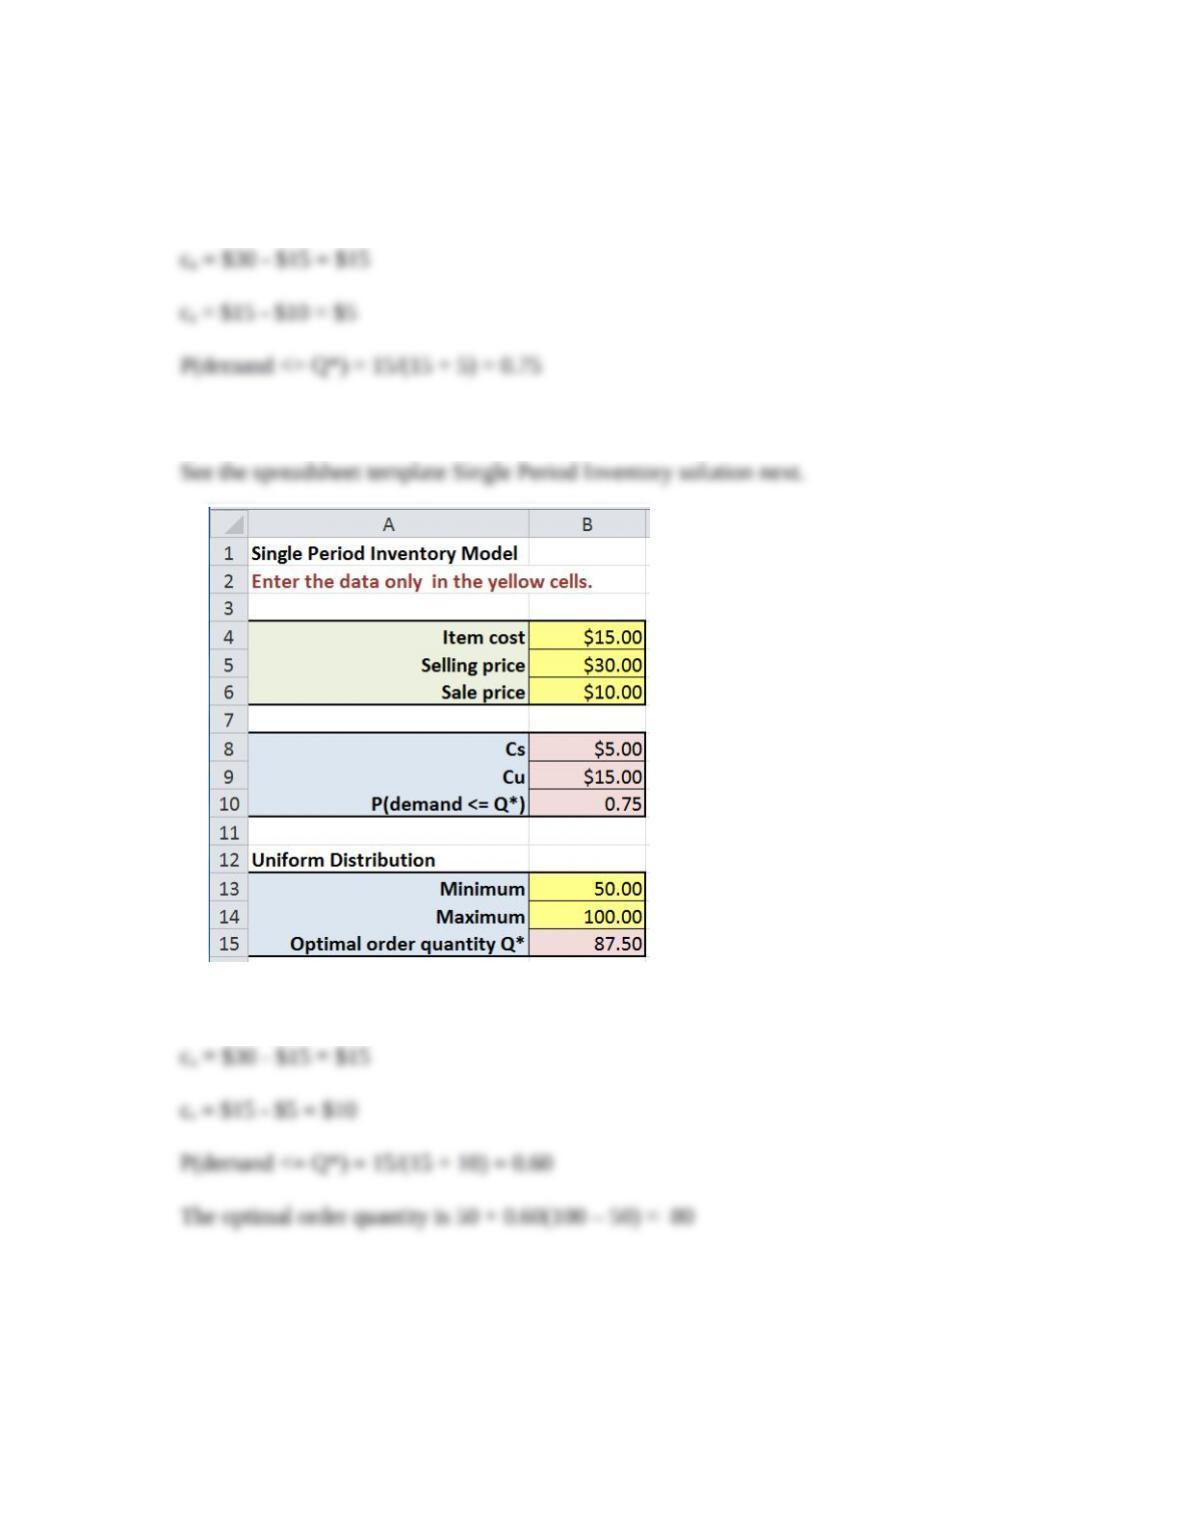
Assuming sales are between 50 and 100 boxes, we have a uniform distribution between 50
and 100. For a sale price of $10.00 we have:
The optimal order quantity is 50 + 0.75(100 – 50) = 87.5 or 88 boxes
If the sale price is $5.00, we obtain:
14.* For Suzie’s Sweetshop scenario in Problem 13, suppose that demand is normally
distributed with a mean of 75 and a standard deviation of 8. How will her optimal order
quantity change? [Hint: note that for a normal distribution, the value of Q* in Equation
12.17 can be found using Appendix A. Find the value of z that corresponds to the
cumulative probability defined by Equation 12.17, and then find Q* by converting back to
the original normal distribution using the formula z = (Q* – )/Verify your result
using the Excel template.
P(demand <= Q*) = 15/(15 + 5) = 0.75. This does not change.