Unlock document.
This document is partially blurred.
Unlock all pages and 1 million more documents.
Get Access
OM4 Chapter 11: Forecasting and Demand Planning
Discussion Questions
1. Discuss some forecasting issues that you encounter in your daily life. How do you make
your forecasts?
Students might suggest such things as cell phone usage, vehicle mileage, university
2. Suppose that you were thinking about opening a new restaurant. How would you go about
forecasting demand and sales?
Sister restaurants in similar locations and demographics using variables such as customer
3. Provide some examples of time series that exhibit
a. trends (U.S. employment growth or decline, demand for iPads, eBook versus hard
b. seasonal patterns (resort hotel bookings, snow blowers, lawn mowers, jet skis,
4. If a manager asked you whether to use time series forecasting models or regression-based
forecasting models, what would you tell him or her?
Time series methods always include time as a variable such as by hour, day, week, month,
quarter or year. Five characteristics are trend, seasonal, cyclical, random variation, and
5. Looking back at the chapters you have studied so far, discuss how good forecasting can
improve operations decisions in these areas.
Good forecasting is essential to improve process and value chain performance.
Demand forecasting (goods and services, setup assembly line, etc.)
Short-term capacity and schedules (call center or factory staffing, etc.)
Note that judgmental forecasting is also a valid approach, in addition to statistical
Problems and Activities
Note: an asterisk denotes problems for which an Excel spreadsheet template on the CourseMate
Web site may be used.
1. Search the Internet for some time series data that relates to sustainability, for example,
In an article by R. Schmalensee, T.M. Stoker, and R.A Jackson, Massachusetts Institute of
Technology, Massachusetts Institute of Technology, and U.S. Federal Reserve Board,
2. The historical sales for a certain model of a single serve coffee maker in units is: January,
18; February, 21; March, 16; April, 13; May, 17, and June, 20. Using a 2-month moving
August forecast:
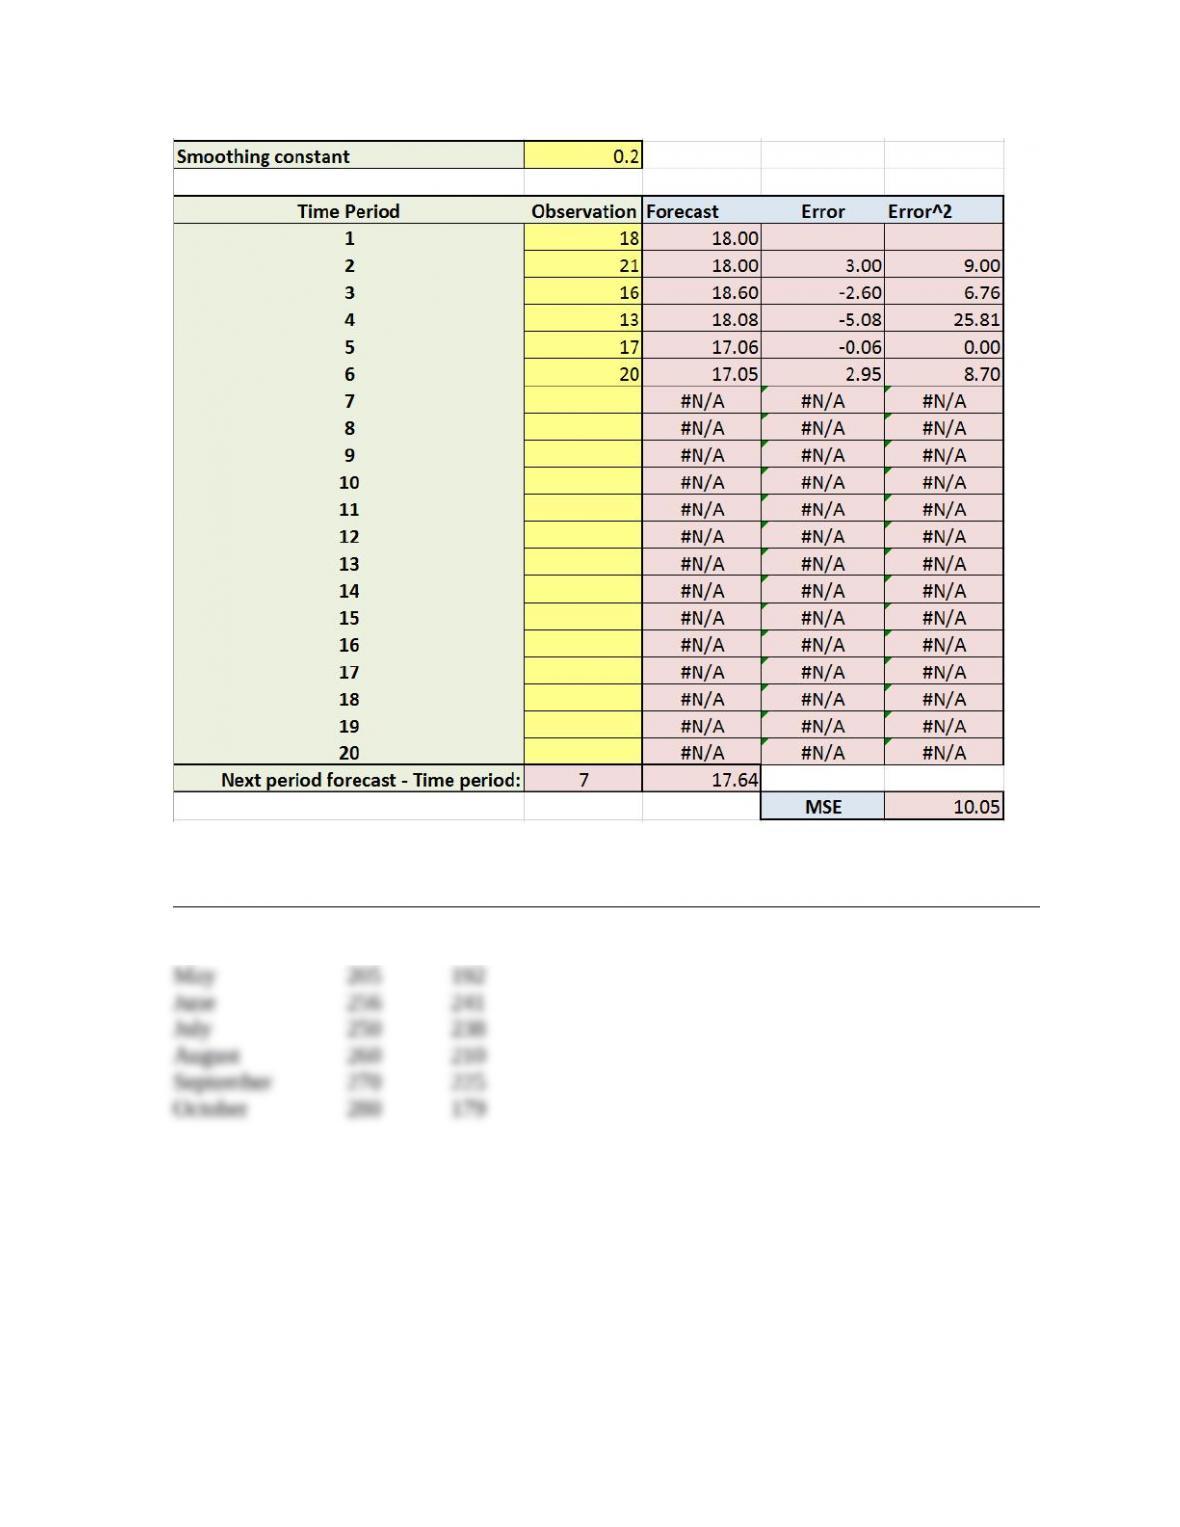
3. In Problem 2, use single exponential smoothing with = 0.2 and compute the exponential
smoothing forecasts for February through July.
4.* Forecasts and actual sales of MP3 players at Just Say Music are as follows:
Month Forecast Actual Sales
March 150 170
April 220 229
a. Plot the data and provide insights about the time series.
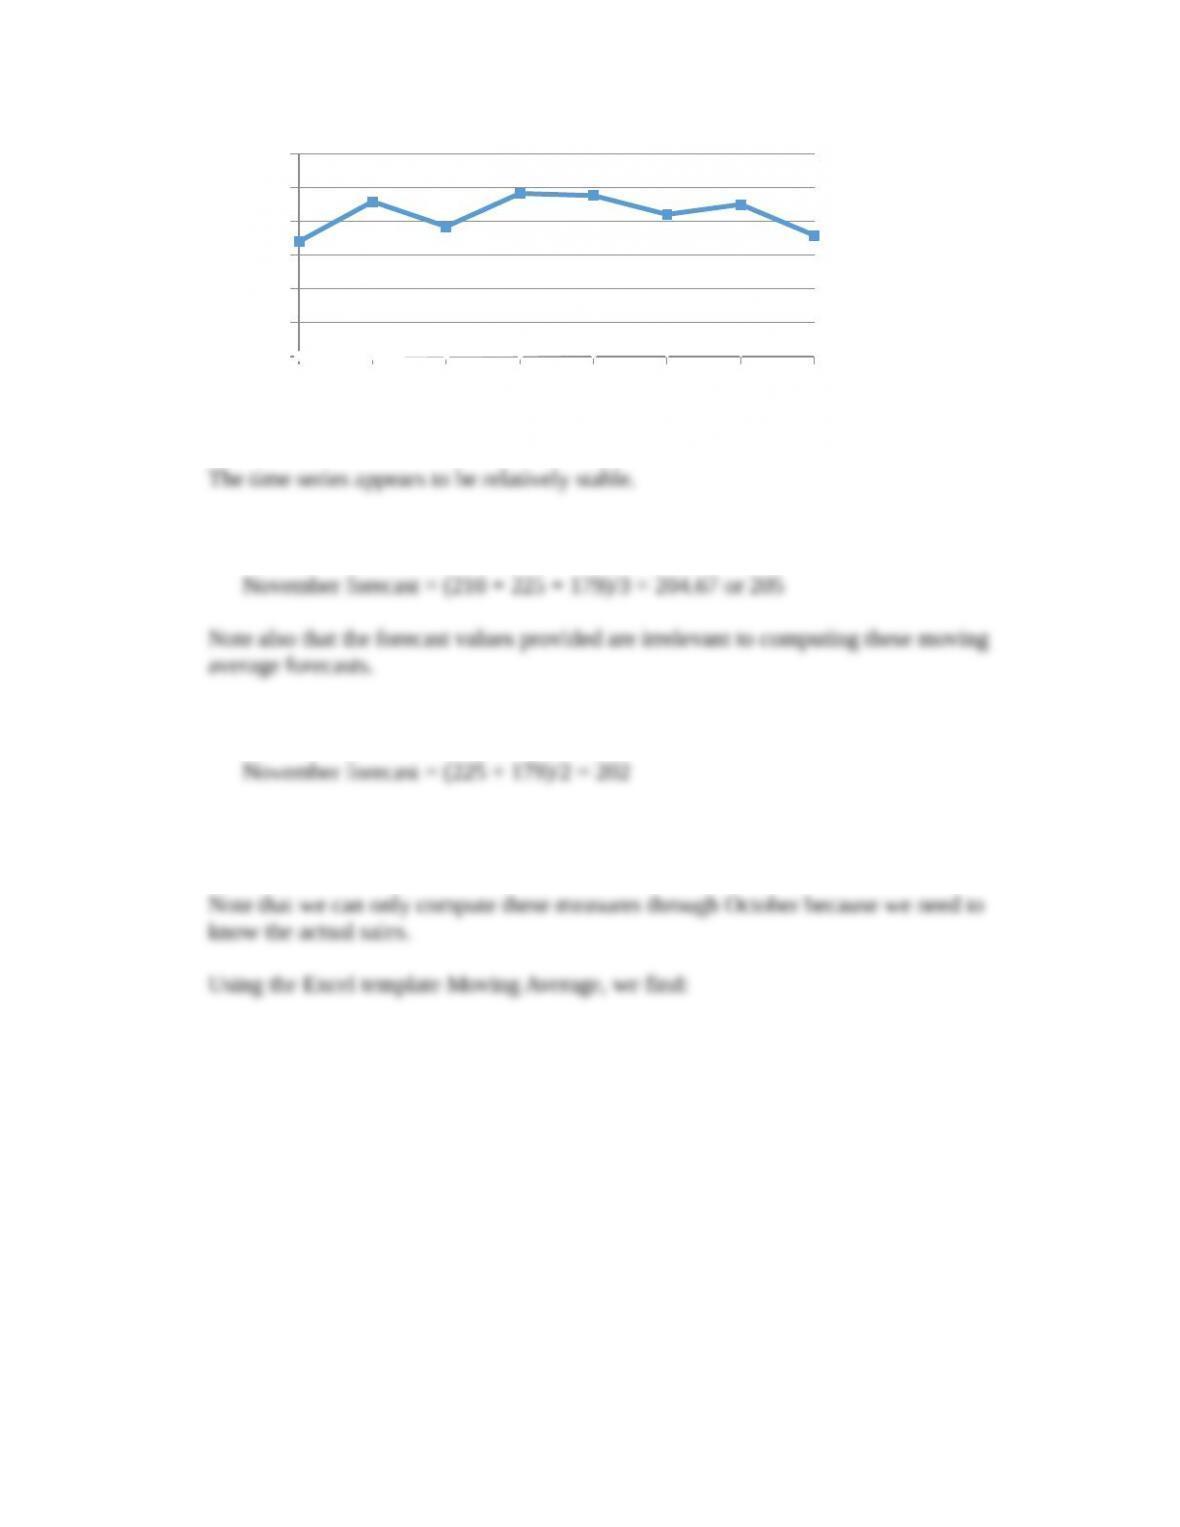
1 2 3 4 5 6 7 8
0
50
100
150
200
250
300
Actual Sale s
b. What is the forecast for November, using a two-period moving average?
c. What is the forecast for November, using a three-period moving average?
d. Compute MSE for the two- and three-period moving average models and compare your
results.
The 2-month moving average is a better model.
e. Find the best number of periods for the moving average model based on MSE.
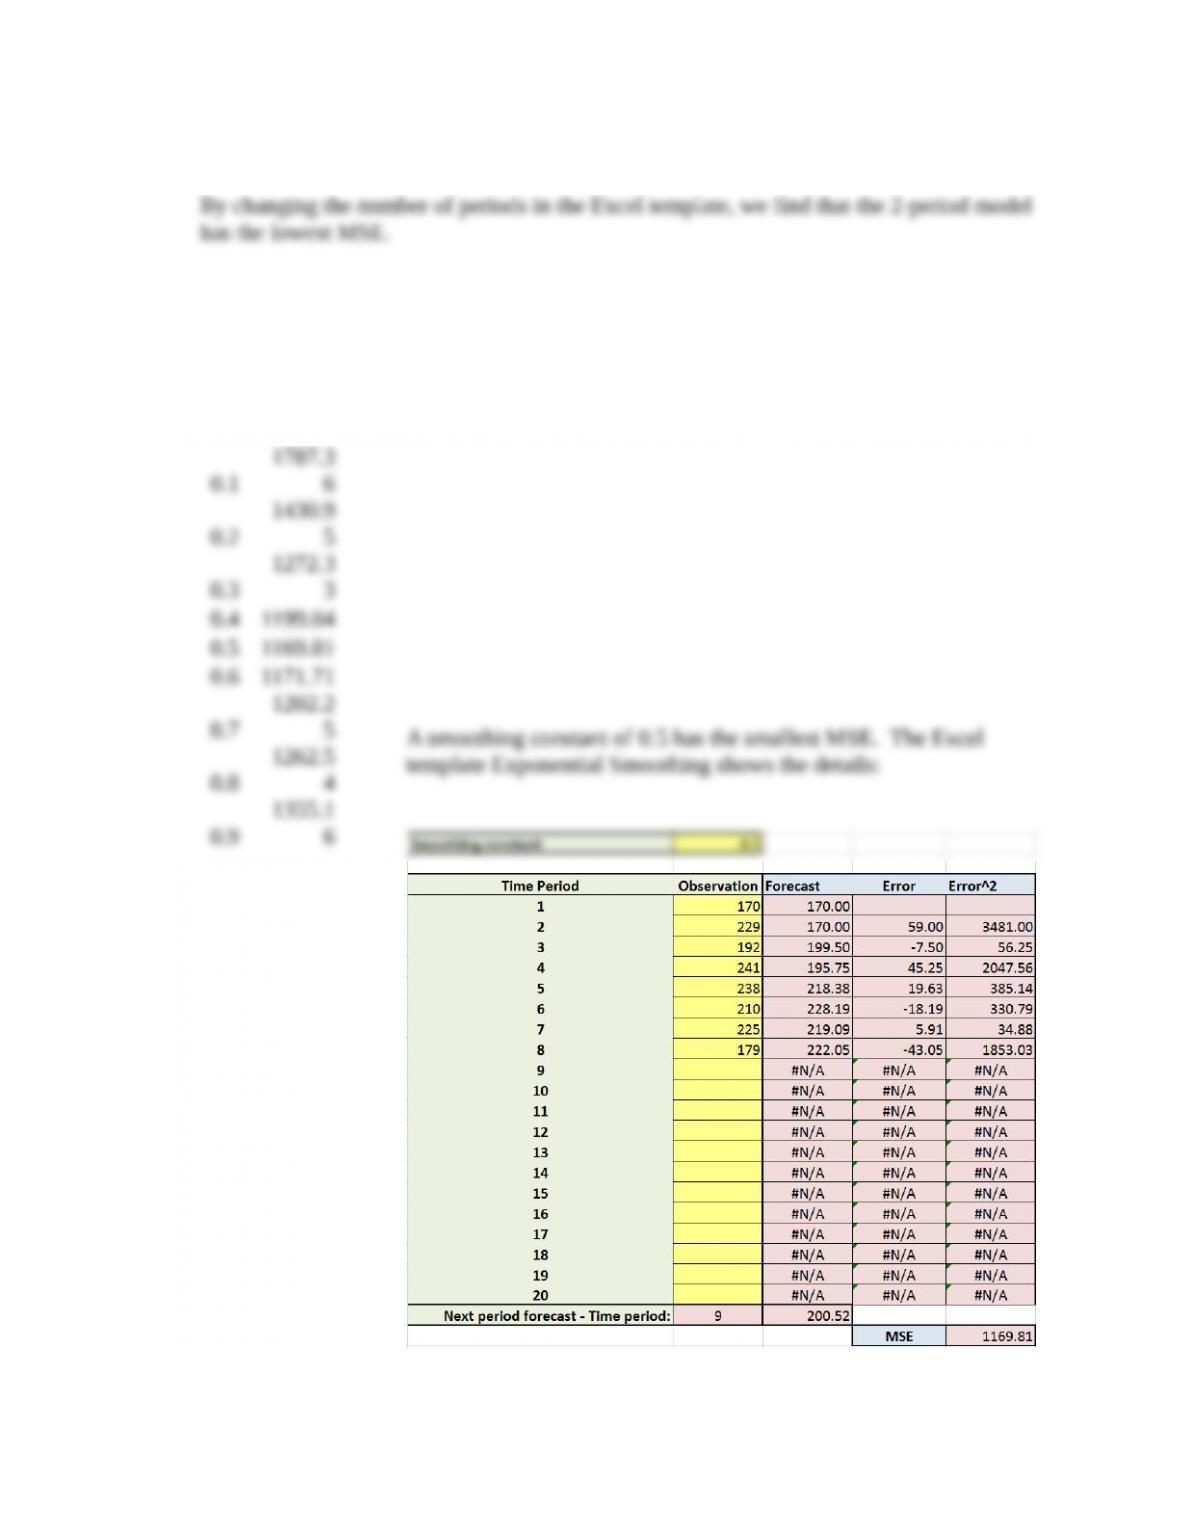
5.* For the data in Problem 4, find the best single exponential smoothing model by evaluating
the MSE for a from 0.1 to 0.9, in increments of 0.1. How does this model compare with the
best moving average model found in Problem 4?
Alph
a MSE


