Principles of Finance 6e Chapter 7
Besley/Brigham
7-13
d. The comparison of inventory turnover ratios shows that other firms in the industry seem to
be getting along with about half as much inventory per unit of sales as Finnerty. If
e. If Finnerty had a sharp seasonal sales pattern, or if it grew rapidly during the year, many
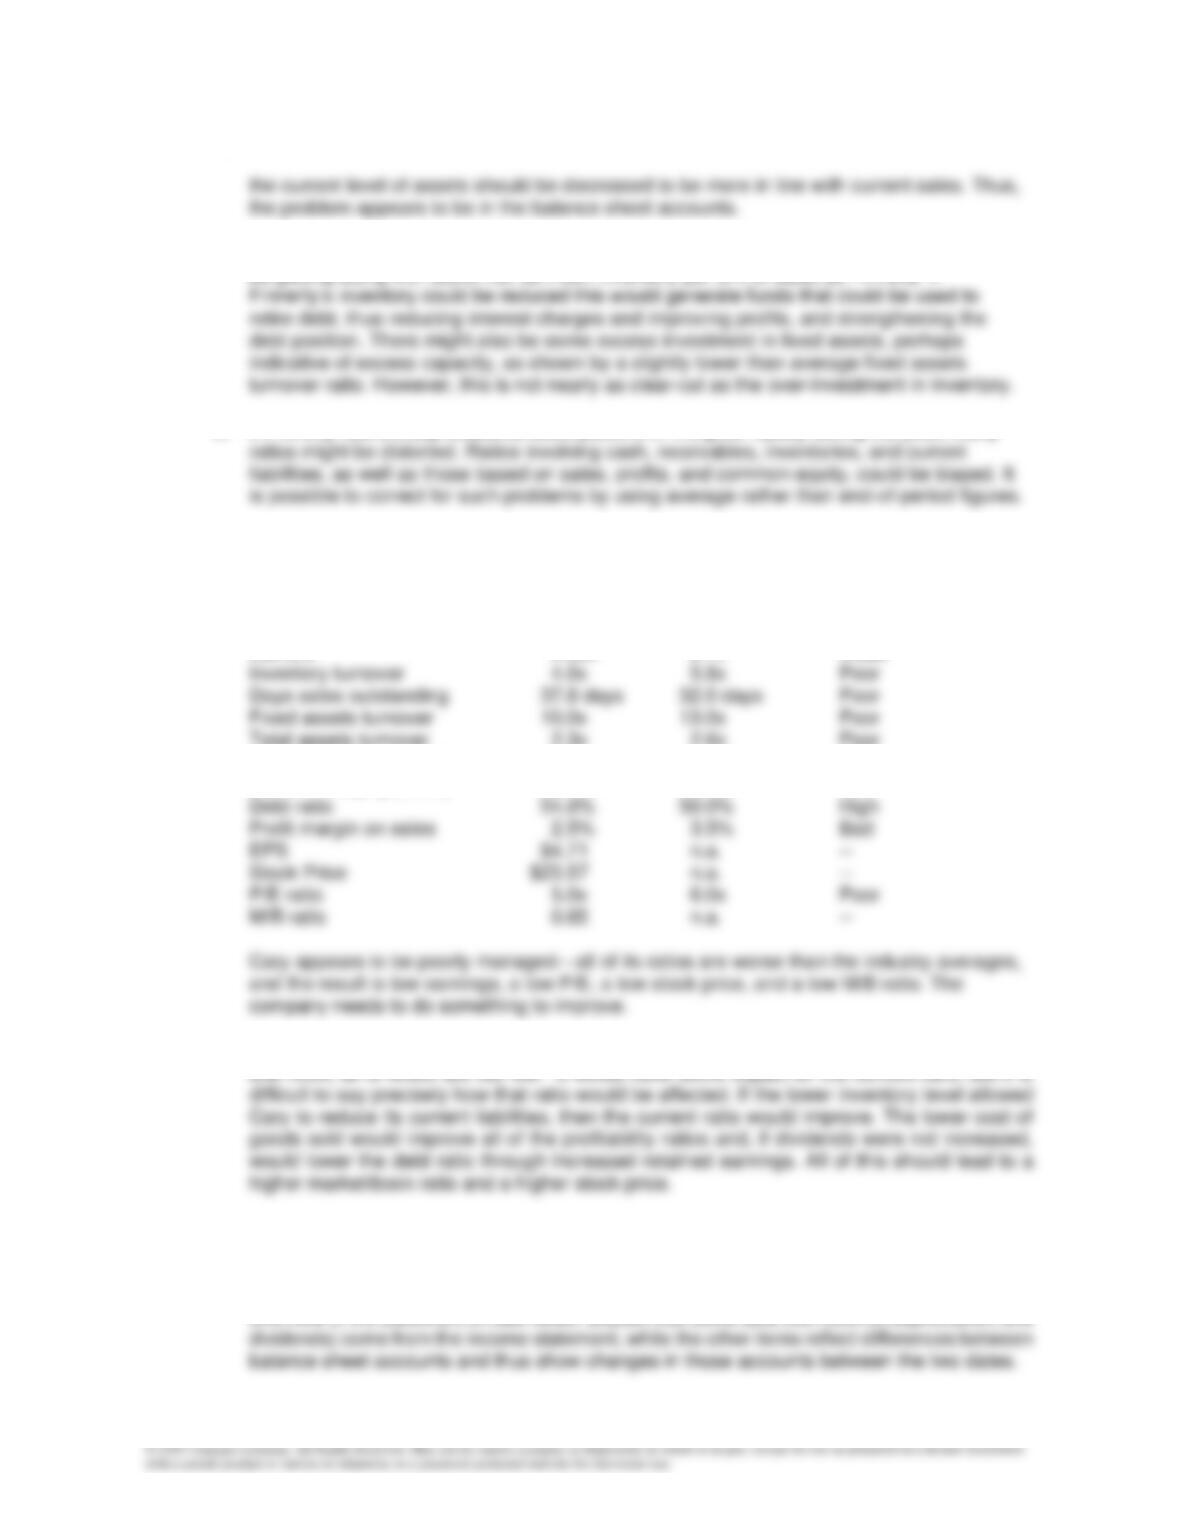
7-16 a. Here are Cary’s base case ratios and other data as compared to the industry:
Cary Industry Comment
Quick 0.85x 1.0x Weak
Current 2.33x 2.7x Weak
Total assets turnover 2.3x 2.6x Poor
Return on assets (ROA) 5.9% 9.1% Bad
Return on equity (ROE) 13.1% 18.2% Bad
b. A decrease in the inventory level would improve the inventory turnover, total assets turnover,
and ROA, all of which are too low. It would have some impact on the current ratio, but it is
7-17 Integrative Problem
a. Begin by reviewing briefly what balance sheets and income statements are. Then give an
overview of the statement of cash flows. Explain that some data (net income, depreciation, and
Chapter 7 Principles of Finance 6e
Besley/Brigham
7-14
b. Financial ratios are used to get an idea about how well the company is being operated, and
where it needs improving. The ratio categories, and their purposes, are as follows:
1. Liquidity: Can the company make required payments in the short run (defined as the next
year)?
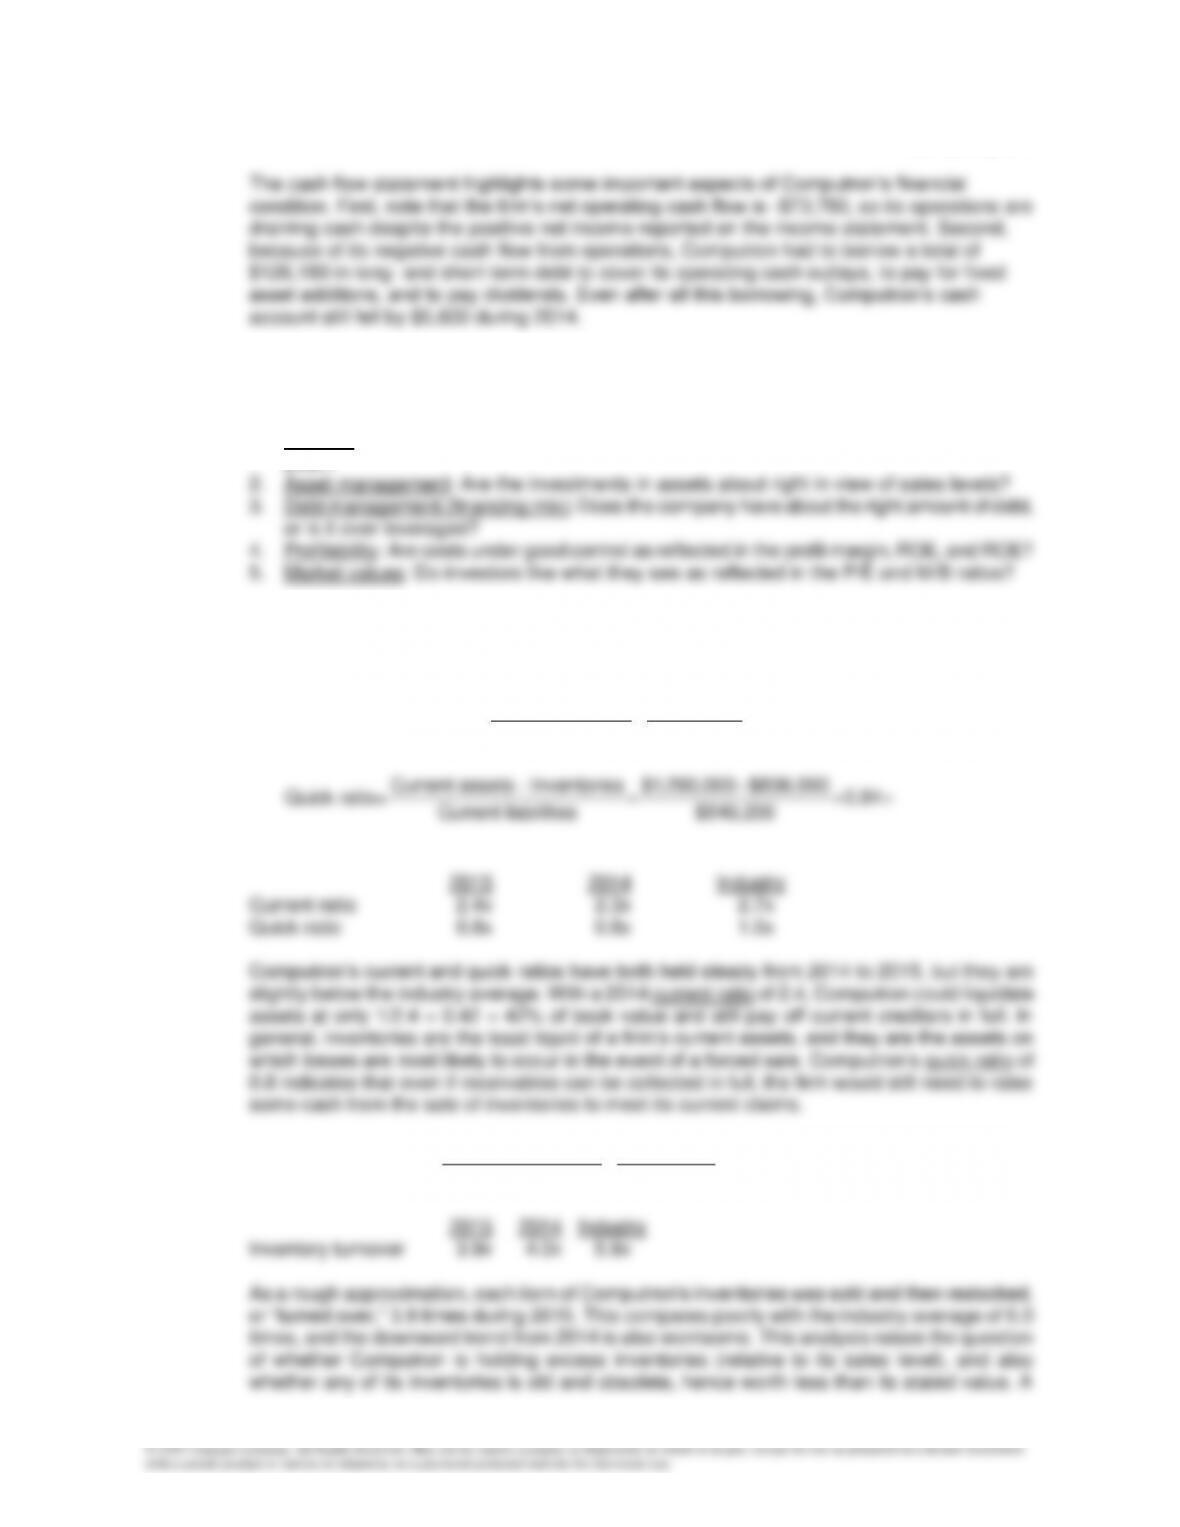
c. Computron has $540,200 in obligations that must be satisfied within the coming year. Will it
have trouble meeting its required payments? A full liquidity analysis requires a cash budget, but
these two ratios provide quick, easy-to-use measures of liquidity:
Current assets $1,290,000
Current ratio= 2.39
Current liabilities $540,200
= =
d.
Cost of goods sold $3,250,000
Inventory Turnover = 3.9
Inventories $836,000
= =
Principles of Finance 6e Chapter 7
Besley/Brigham
7-15
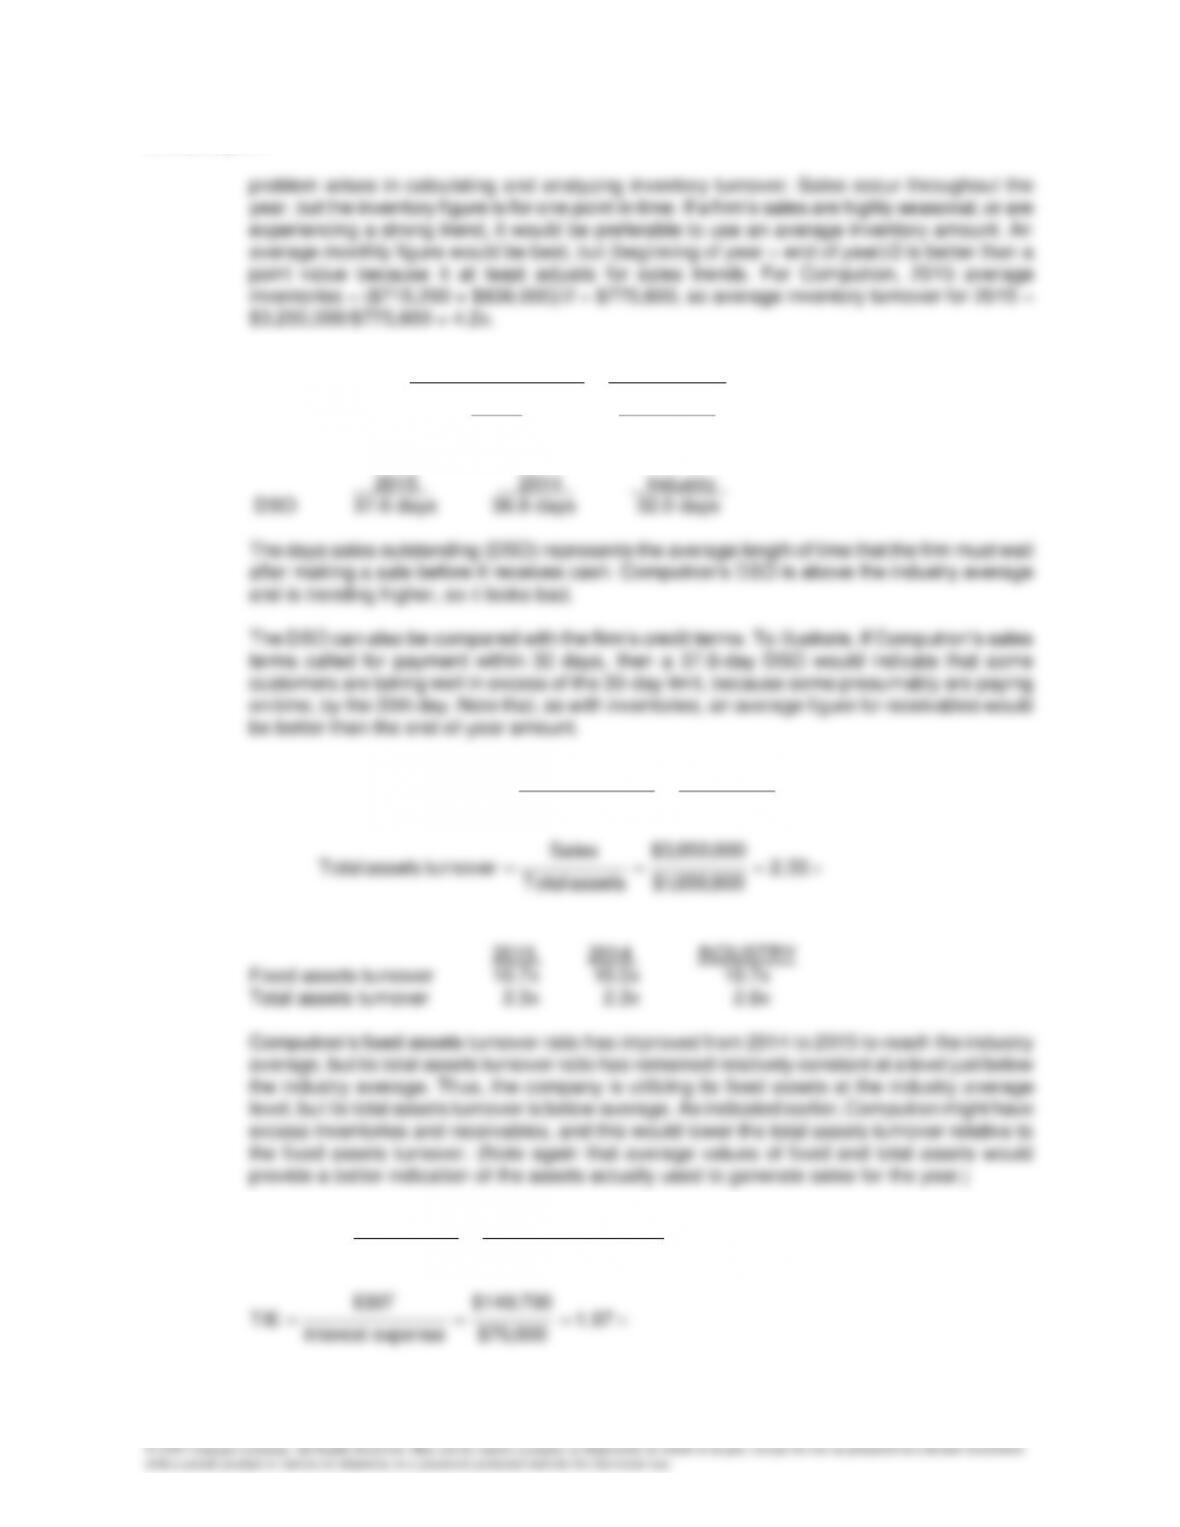
days 6.37
360
000,850,3$
000,402$
360
Sales
receivable Accounts
DSO =
=
=
===
67.10
800,360$
000,850,3$
assets fixed Net
Sales
turnover assets Fixed
e.
%4.58
800,650,1$
600,424$200,540$
assets Total
debt Total
ratio Debt =
+
==
Chapter 7 Principles of Finance 6e
Besley/Brigham
( )
=
+
+
=
++
+
==
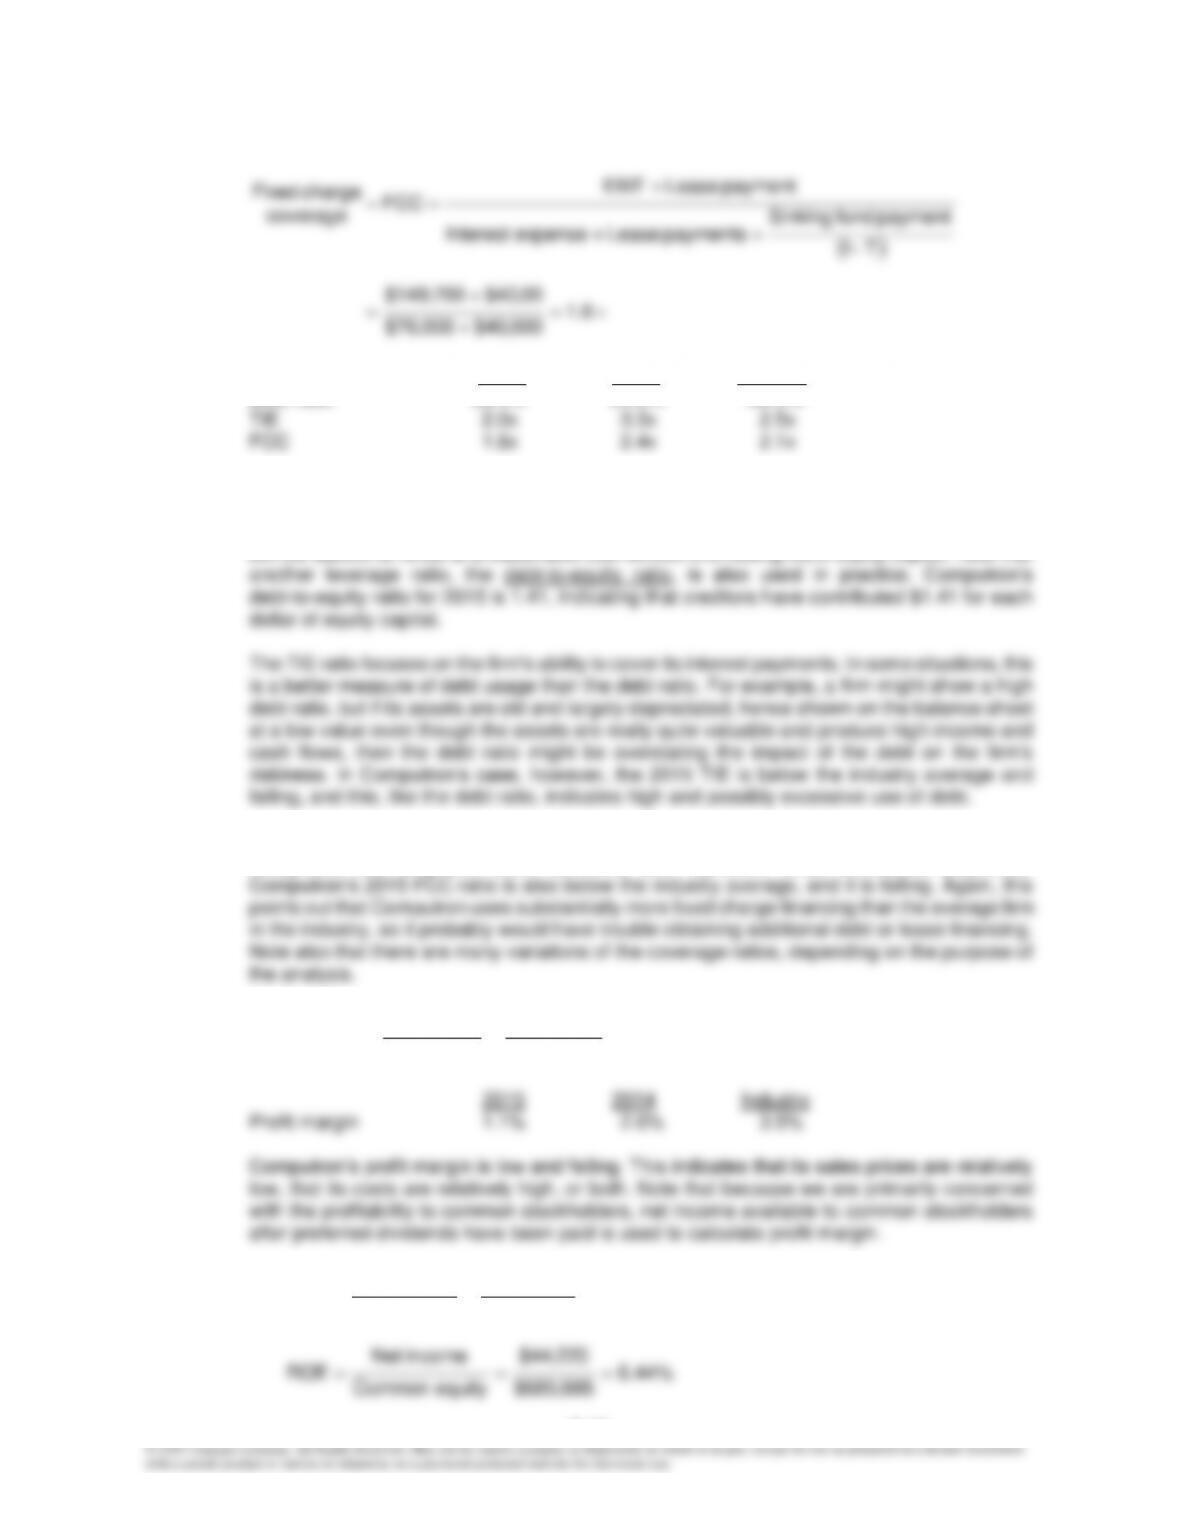
6.1
000,40$000,76$
00,40$700,149$
T–1
payment fund Sinking
payments Leaseexpense Interest
payment LeaseEBIT
FCC
coverage
charge Fixed
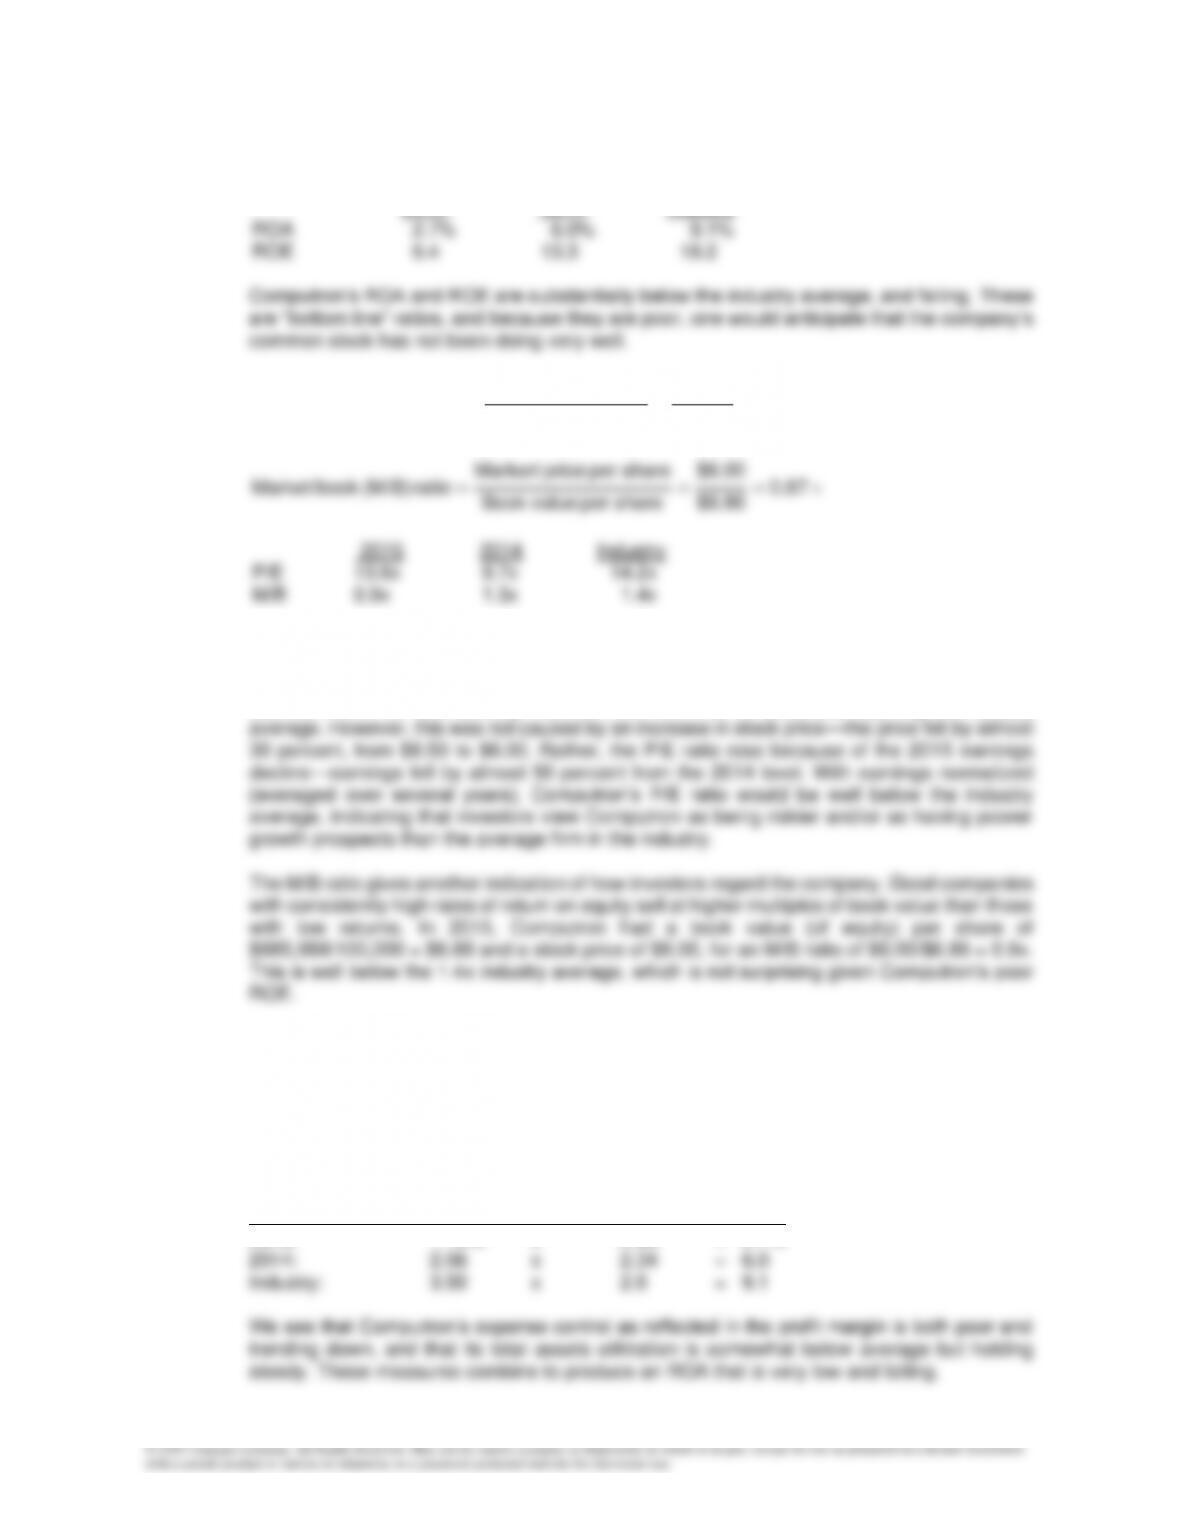
2015 2014 Industry
Debt ratio 58.4% 54.8% 50.0%
All three measures reflect the extent of debt usage, but they focus on different aspects.
Computron’s debt ratio is above the industry average, and the trend is up. Creditors have
supplied over one–half the firm’s total financing. Computron probably would find it difficult to
borrow additional funds at a reasonable cost without first raising more equity capital. Note that
The fixed charge coverage (FCC) ratio is similar to the TIE ratio, but it is more inclusive in that it
recognizes that long-term lease contracts also represent fixed, contractual payments.
f.
%15.1
000,850,3$
220,44$
Sales
income Net
margin Profit ===
%68.2
800,650,1$
220,44$
assets Total
income Net
ROA
===
Principles of Finance 6e Chapter 7
Besley/Brigham
7-17
2015 2014 Industry
g.
=== 57.13
442.0$
00.6$
share per Earnings
share per Price
ratio (P/E) eanrings Price
00.6$
share per price Markert
The P/E ratio shows how much investors are willing to pay per dollar of reported profits. At the
end of 2015, Computron’s stock sold for $6.00 per share; its reported earnings were
$44,220/100,000 = $0.44 per share; and the result was a P/E ratio of $6.00/$0.44 = 13.6x. Note
that the firm’s P/E ratio actually improved from 2014 to 2015, almost reaching the industry
h. The DuPont equation provides an overview of (1) a firm’s profitability as measured by ROA and
ROE, (2) its expense control as measured by the profit margin, and (3) its assets utilization as
measured by the total assets turnover, combining these items in the equation shows how the
different factors interact to determine ROA and ROE. The data for Computron and the industry
are given below.
Total assets
DuPont Profit margin turnover
Equation: (profit/sales) x (Sales/TA) = ROA
2015: 1.15% x 2.33 = 2.7%
Chapter 7 Principles of Finance 6e
Besley/Brigham
i. Sales per day amount to $3,850,000/360 = $10,694. Accounts receivable are now $402,000, or
37.6 days’ sales. If A/R can be reduced to 27.6 days without affecting sales, then the balance
j. Some of the problems and limitations of financial statement analysis are discussed below.
(1) Many large firms operate a number of different divisions in quite different industries, and in
(2) Most firms want to be better than average, so merely attaining average performance is not
(3) Inflation distorts firms’ balance sheets. Further, because inflation affects both depreciation
(4) Seasonal factors can also distort ratio analysis. For example, the inventory turnover ratio
(5) Firms can employ “window dressing” techniques to make their financial statements look
(6) Different operating and accounting practices can distort comparisons. As noted earlier,
inventory valuation and depreciation methods can affect the financial statements and thus
(7) It is difficult to generalize about whether a particular ratio is “good” or “bad.” For example,
7-19
(8) A firm might have some ratios that look “good” and others that look “bad,” making it difficult
to tell whether the company is, on balance, in a strong or a weak position. However,
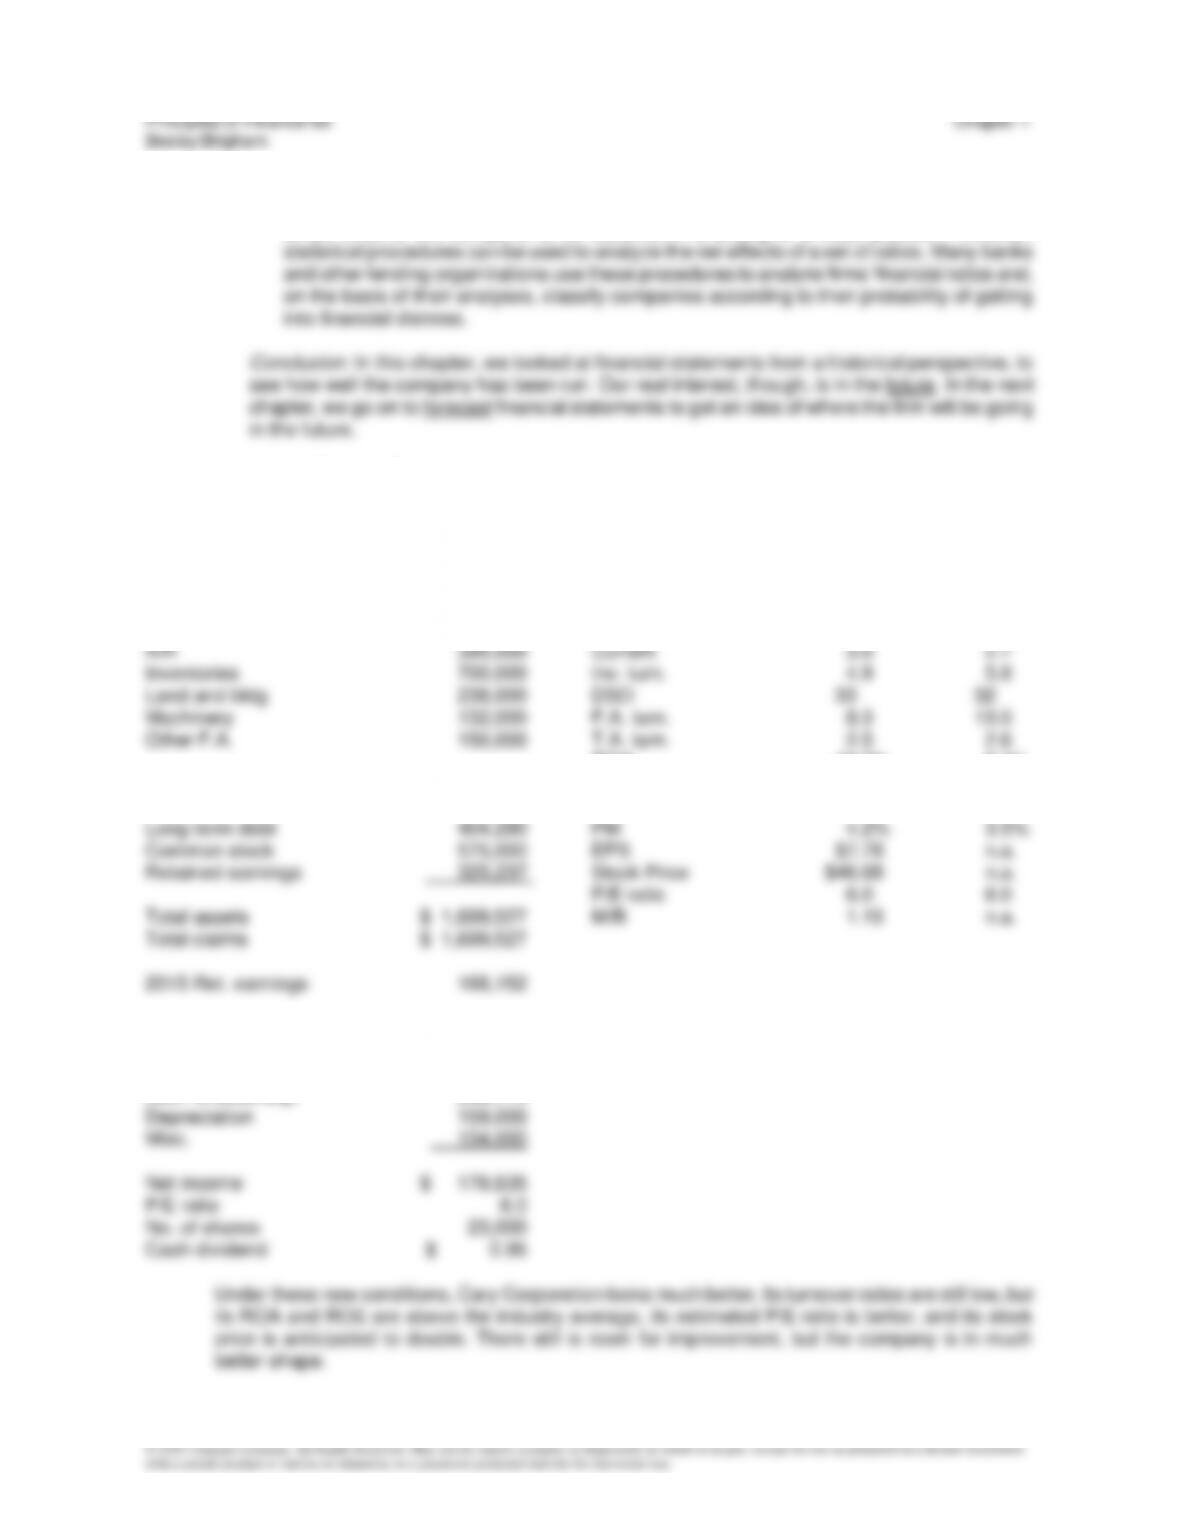
7-18 Computer-Related Problem
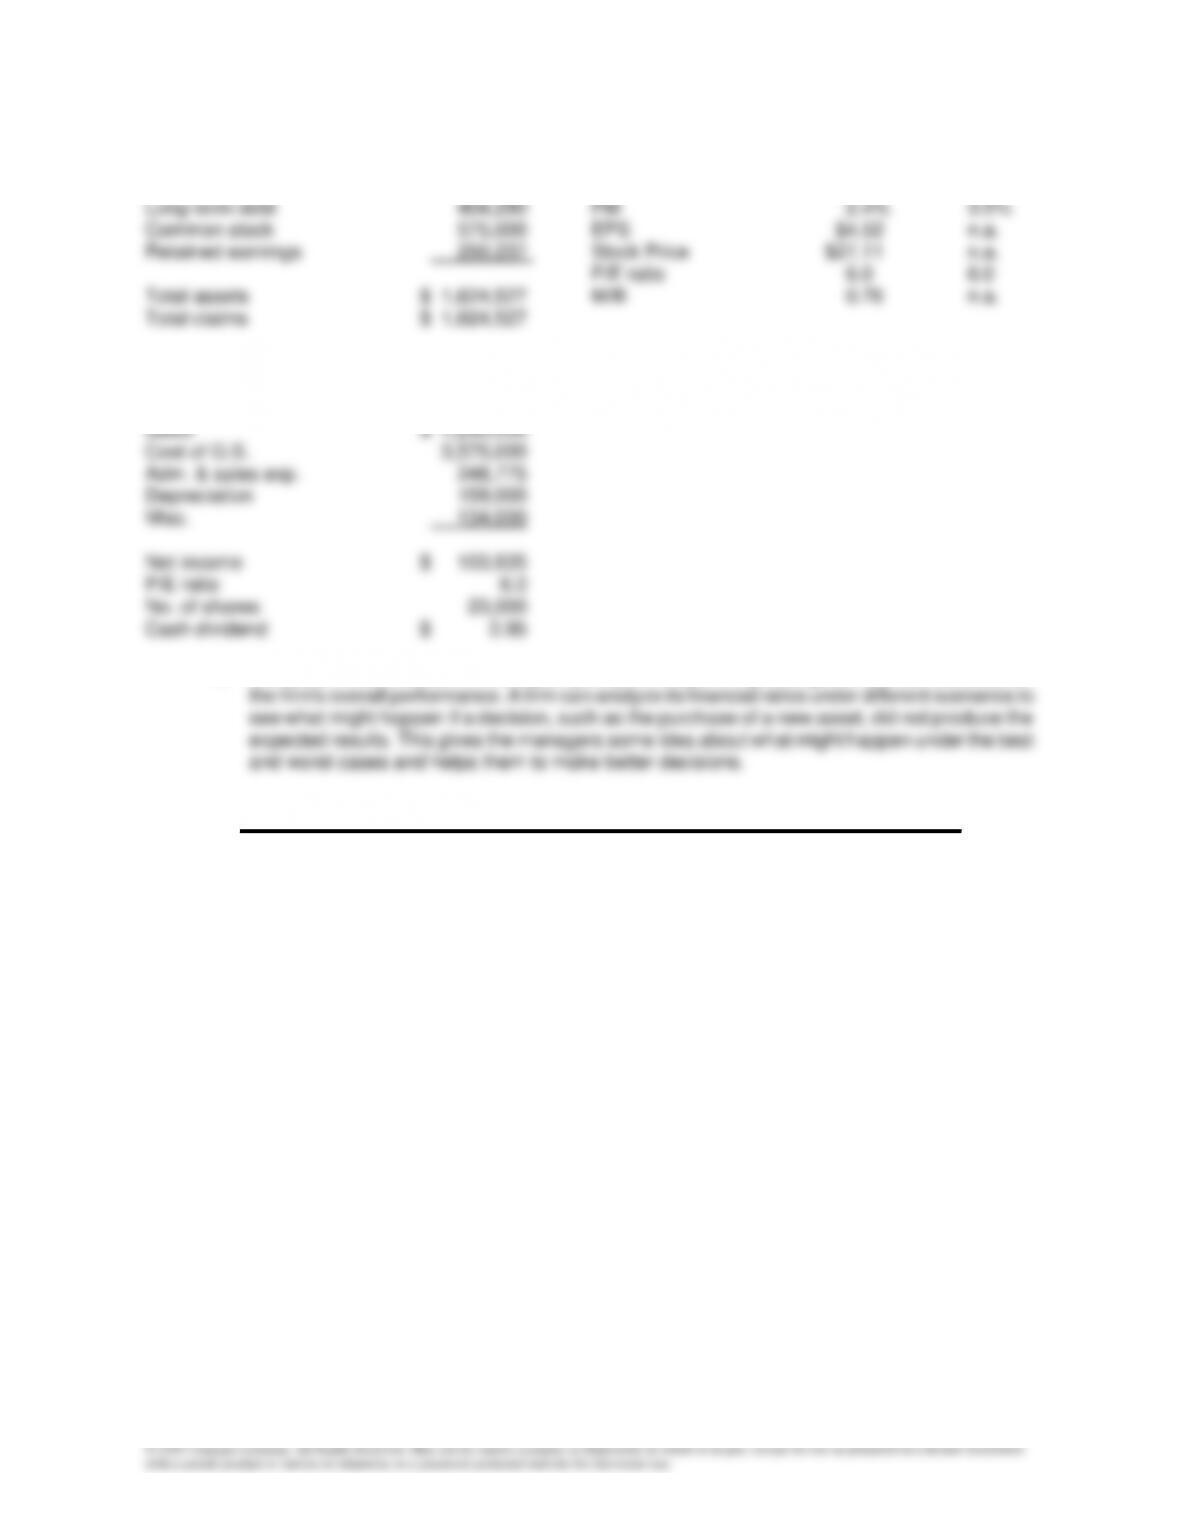
a. The revised data and ratios are shown below:
INPUT DATA: KEY OUTPUT:
2016 Cary Industry
Cash $ 84,527 Quick 1.2 1.0
ROA 10.5% 9.1%
Accts & Notes Pay. $ 275,000 ROE 19.9% 18.2%
Accruals 120,000 TD/TA 47.0% 50.0%
Income statement
Sales $ 4,290,000
Cost of G.S. 3,450,000
Adm. & sales exp. 248,775
Chapter 7 Principles of Finance 6e
Besley/Brigham
7-20
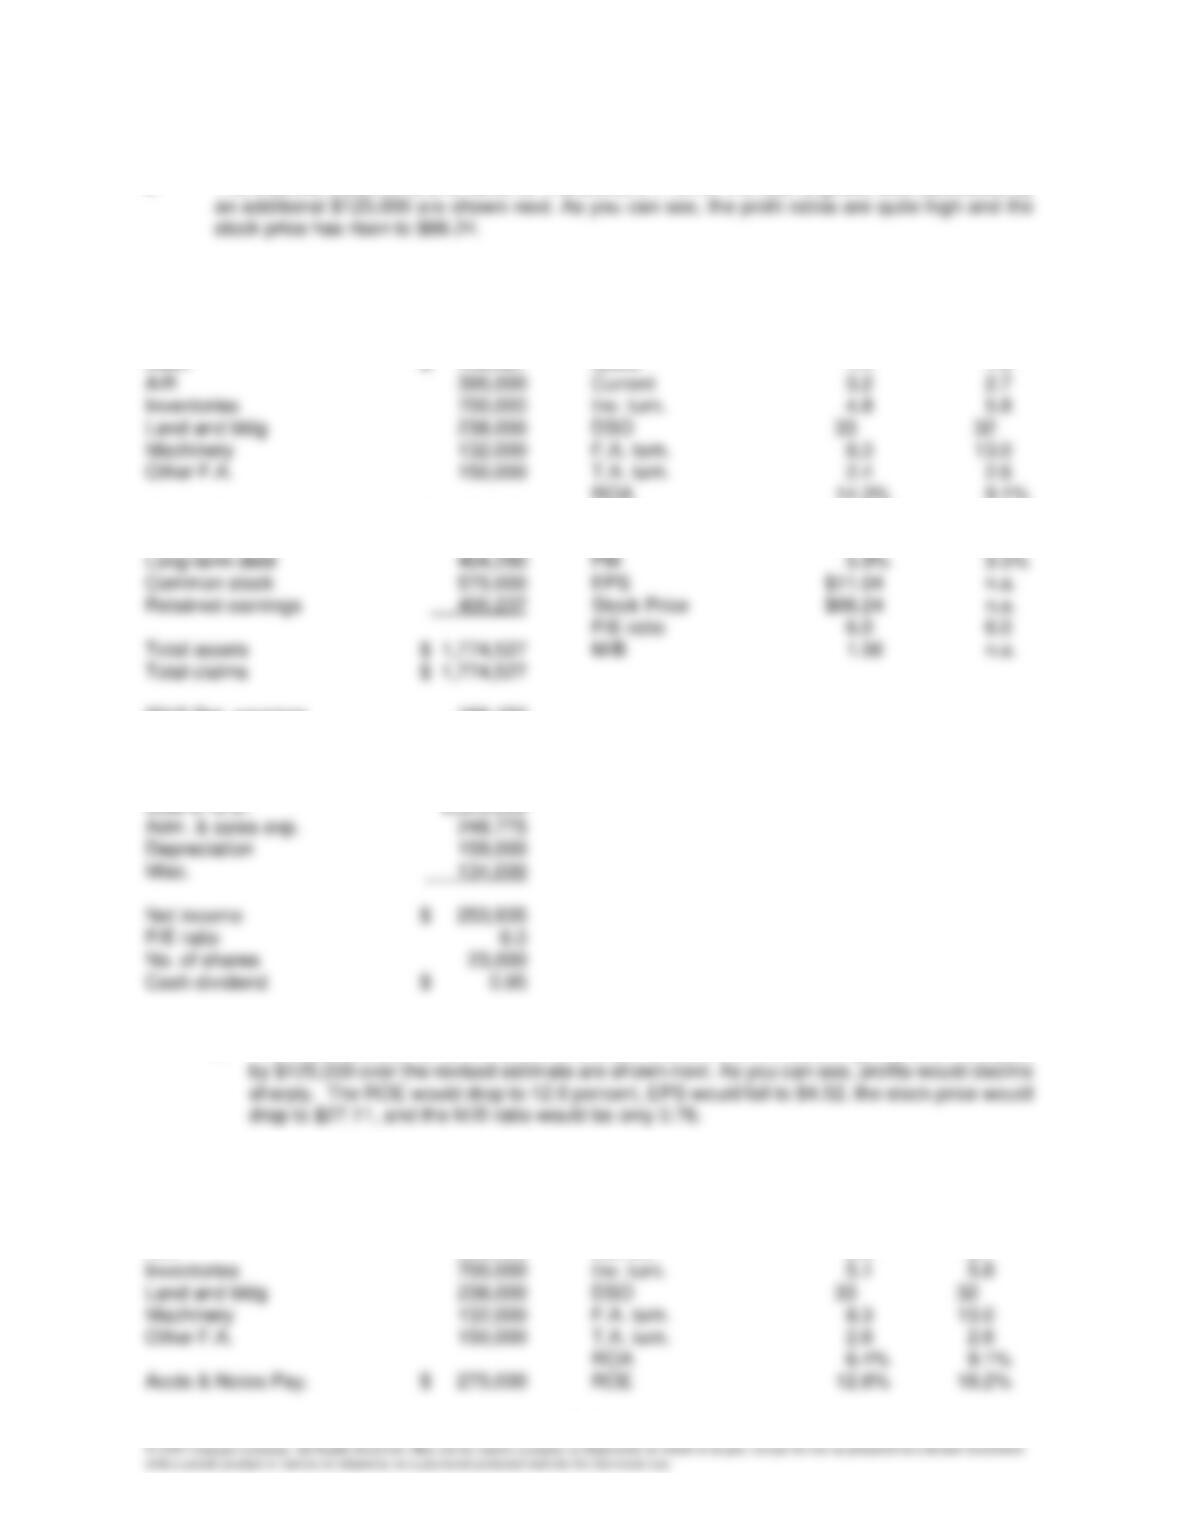
b. The financial statements and ratios for the scenario in which the cost of goods sold decreases by
INPUT DATA: KEY OUTPUT:
2016 Cary Industry
Cash $ 159,527 Quick 1.4 1.0
ROA 14.3% 9.1%
Accts & Notes Pay. $ 275,000 ROE 26.0% 18.2%
Accruals 120,000 TD/TA 45.0% 50.0%
2015 Ret. earnings 168,152
Income statement
Sales $ 4,290,000
Cost of G.S. 3,325,000
c. The financial statements and ratios for the scenario in which the cost of goods sold increases
INPUT DATA: KEY OUTPUT:
2016 Cary Industry
Cash $ 9,527 Quick 1.0 1.0
A/R 395,000 Current 2.8 2.7
Principles of Finance 6e Chapter 7
Besley/Brigham
7-21
Accruals 120,000 TD/TA 49.2% 50.0%
2015 Ret. earnings 168,152
Income statement
d. Computer models allow us to analyze quickly the impact of operating and financial decisions on
ETHICAL DILEMMA
Hocus-Pocus—Look, An Increase in Sales!
Ethical dilemma:
Dynamic Energy Wares (DEW) has decided to change the manner in which it distributes its products to
large companies. The change in the distribution system comes at a time when DEW’s profits are declining.
The declining profits might not be the sole reason for the change, but it appears to be the primary impetus
for the decision. It also appears that the new policy requiring DEW’s distributors to increase inventory levels
before the end of the fiscal year will artificially inflate DEW’s sales for the current year. However, DEW’s
new policy does not require the distributors to pay for any increased inventory until next year (six months),
and any unsold inventory can be returned after nine months. So, if the demand for DEW’s products actually
is decreasing, the impact will appear on next year’s financial statements. If the financial manager actually
intends to artificially inflate DEW’s profits this year, she must realize that such actions eventually will “catch
up” with her.
Discussion questions:
• What is the ethical dilemma?
Chapter 7 Principles of Finance 6e
Besley/Brigham
7-22
• Should DEW change its distribution system?
Most would agree that DEW should not change its distribution system if the intent is simply to artificially
• What should DEW do?
It appears that DEW needs some changes because profits have been declining during the past year. A
• Would you go to the distributors’ meeting? What should you tell the distributors?
If there is no penalty for declining to attend the distributors’ meeting, most students would tell you they
would prefer to stay home. But, ask them what they would do if their boss, the financial manager, said
References:
There have been many reports of firms that have followed a strategy similar to that described in this
chapter’s ethical dilemma. A couple of classic examples occurred in 1994—one involved Bausch & Lomb,
Inc., which is a well-known eyewear company; the other involved PerSeptive Biosystems, which produces
instruments used in biotechnology analysis.
In the last quarter of 1993, Bausch & Lomb instituted a change in its distribution system that helped reduce
inventories significantly and allowed the company to post a $10 million gain for the quarter. Midway through
1994, however, Bausch & Lomb estimated its distributors had excess inventory equal to $75 million. During
the year, the company had to repurchase much of this excess inventory because it could not be sold by the
Principles of Finance 6e Chapter 7
Besley/Brigham
distributors. Because of the poor performance of Bausch & Lomb in 1994, the CEO’s performance bonus
was cut to zero. Additional information concerning Bausch & Lomb’s decision to change its distribution
system can be found in the following articles:
“Bausch & Lomb: Clouded Vision,” Financial World, May 23, 1995, p. 16+.
“Bad Math at Bausch & Lomb?,” Business Week, December 19, 1994, p. 108+.
“Bausch & Lomb’s Myopia,” Forbes, December 5, 1994, p. 14+.
It was reported that PerSeptive would offer its diagnostic equipment, some of which cost in excess of
$50,000, to prospective customers on a trial basis, requiring payment at some later date only if the
equipment was found to be desirable. At the time, PerSeptive’s management stated the strategy was to
increase renewable sales by allowing the market to experience its product firsthand before requiring a
purchase commitment. Even though the trial offers were not technically considered sales, in some
instances, PerSeptive recorded them as sales and corresponding receivables. For the quarter ending
September 30, 1994, PerSeptive posted nearly a $21 million loss because it wrote off a large amount of
inventory and had to reduce accounts receivable significantly. Its “free trial” offer did not generate the
renewable sales that it hoped. For more information about PerSeptive and this situation, the following
articles might be helpful:
“PerSeptive Restates Its Results for Much of Past 2 Fiscal Years,” The Wall Street Journal, December 28,
1994.
“Biotech Company Is Questioned About ‘Try It Out’ Sales Strategy,” The Wall Street Journal, November 8,
1994, p. B1+.
“Enterprise: Tech Concerns Fudge Figures to Buoy Stocks,” The Wall Street Journal, May 19, 1994, p. B1+.