
ADDITIONAL ISSUES FOR CLASSROOM DISCUSSION
1. A great discussion usually ensues if you ask students what they would do
if an aunt died and left them with $1 million. How would they invest it?
2. If you have already discussed how much risk the di erent students in your
class would take (item 1), then you can show them how much risk there is
from an investment in the stock market, using the charts in the textbook.
See if any of them change their views about how much risk they would
take on, once they have seen the numbers. Emphasize that there have
been several fairly recent periods (1929 to 1959, 1966 to 1990), in which
the S&P 500 fell in value and the stock market did not return to the same
level in real terms until much later. However, students are often stubborn
and unlikely to change their views! And most of them will persist in
thinking that they can beat the market, no matter how much you point
out that it is unlikely that they will do so . . . especially the finance majors.
3. In discussing the CAPM, draw a scatter plot of a stock’s excess returns
versus the market excess returns, then show them that the Beta term
used in the CAPM is just the slope coefficient of a linear regression. They
will 0nally understand where that mysterious Beta comes from.
SOLUTIONS TO TEXTBOOK NUMERICAL
EXERCISES AND ANALYTICAL PROBLEMS
Numerical Exercises
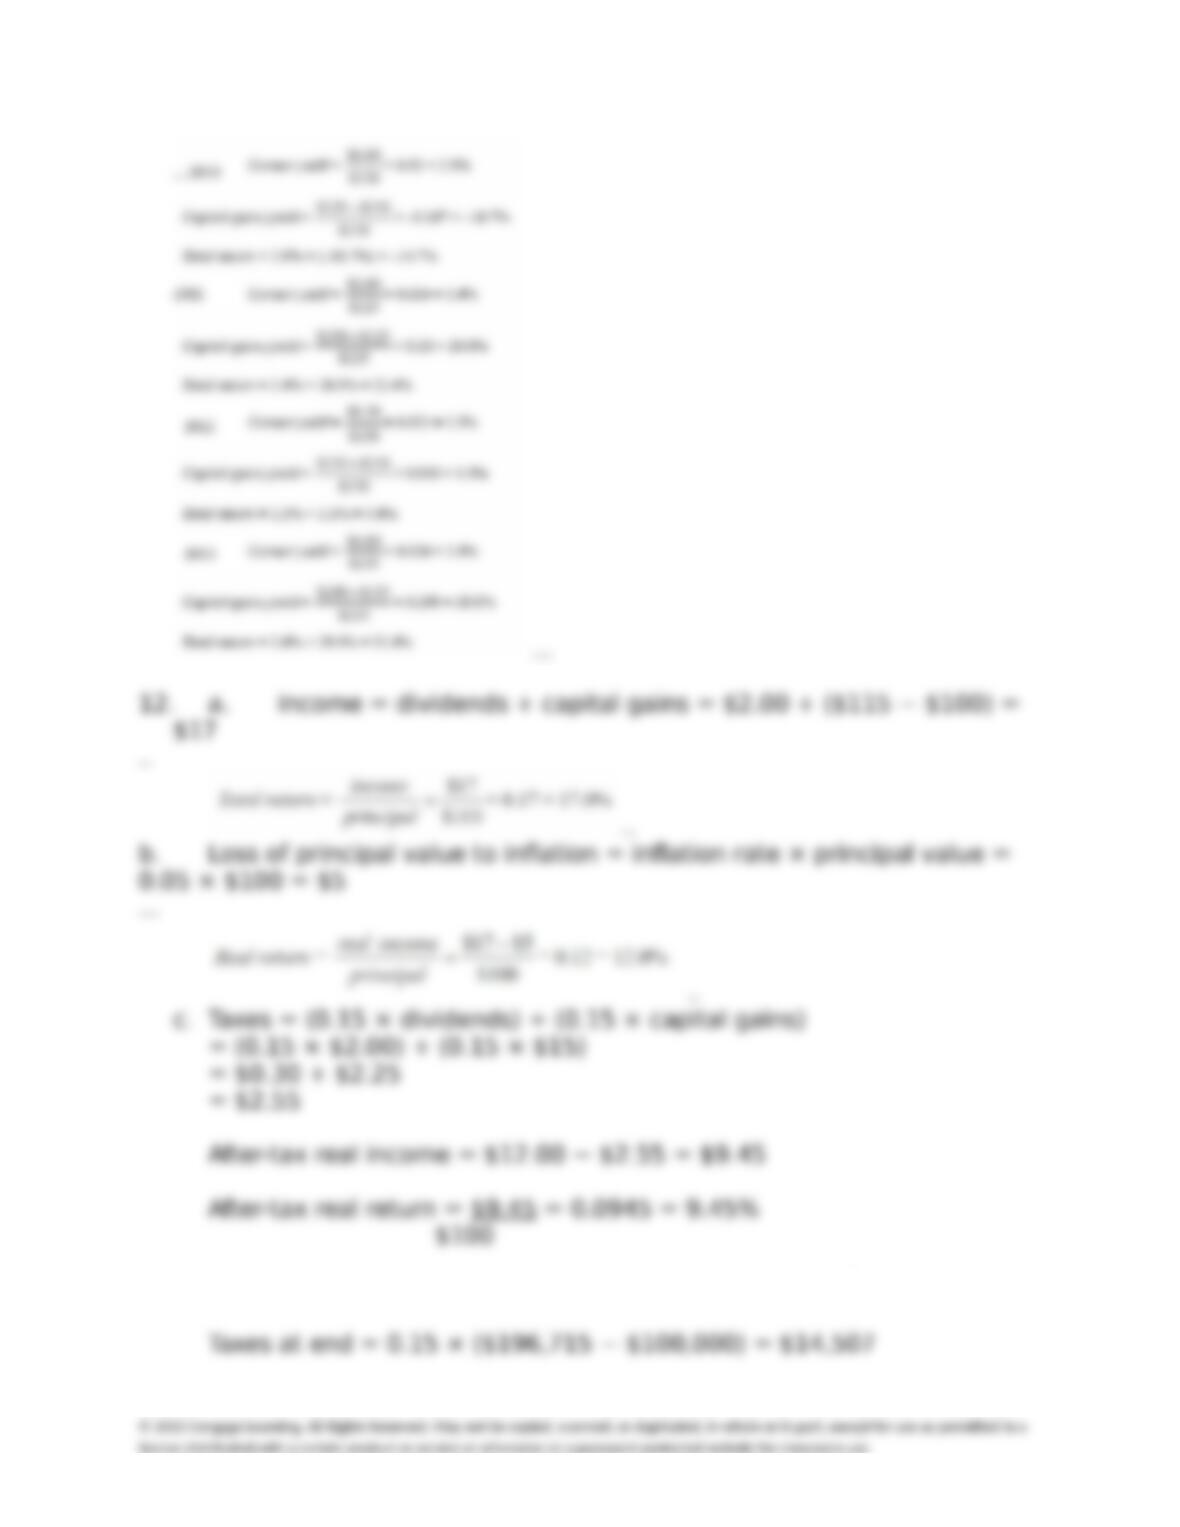
11. The dividend yield is the amount of dividends divided by the stock
Chapter 7: Stocks and Other Assets 66
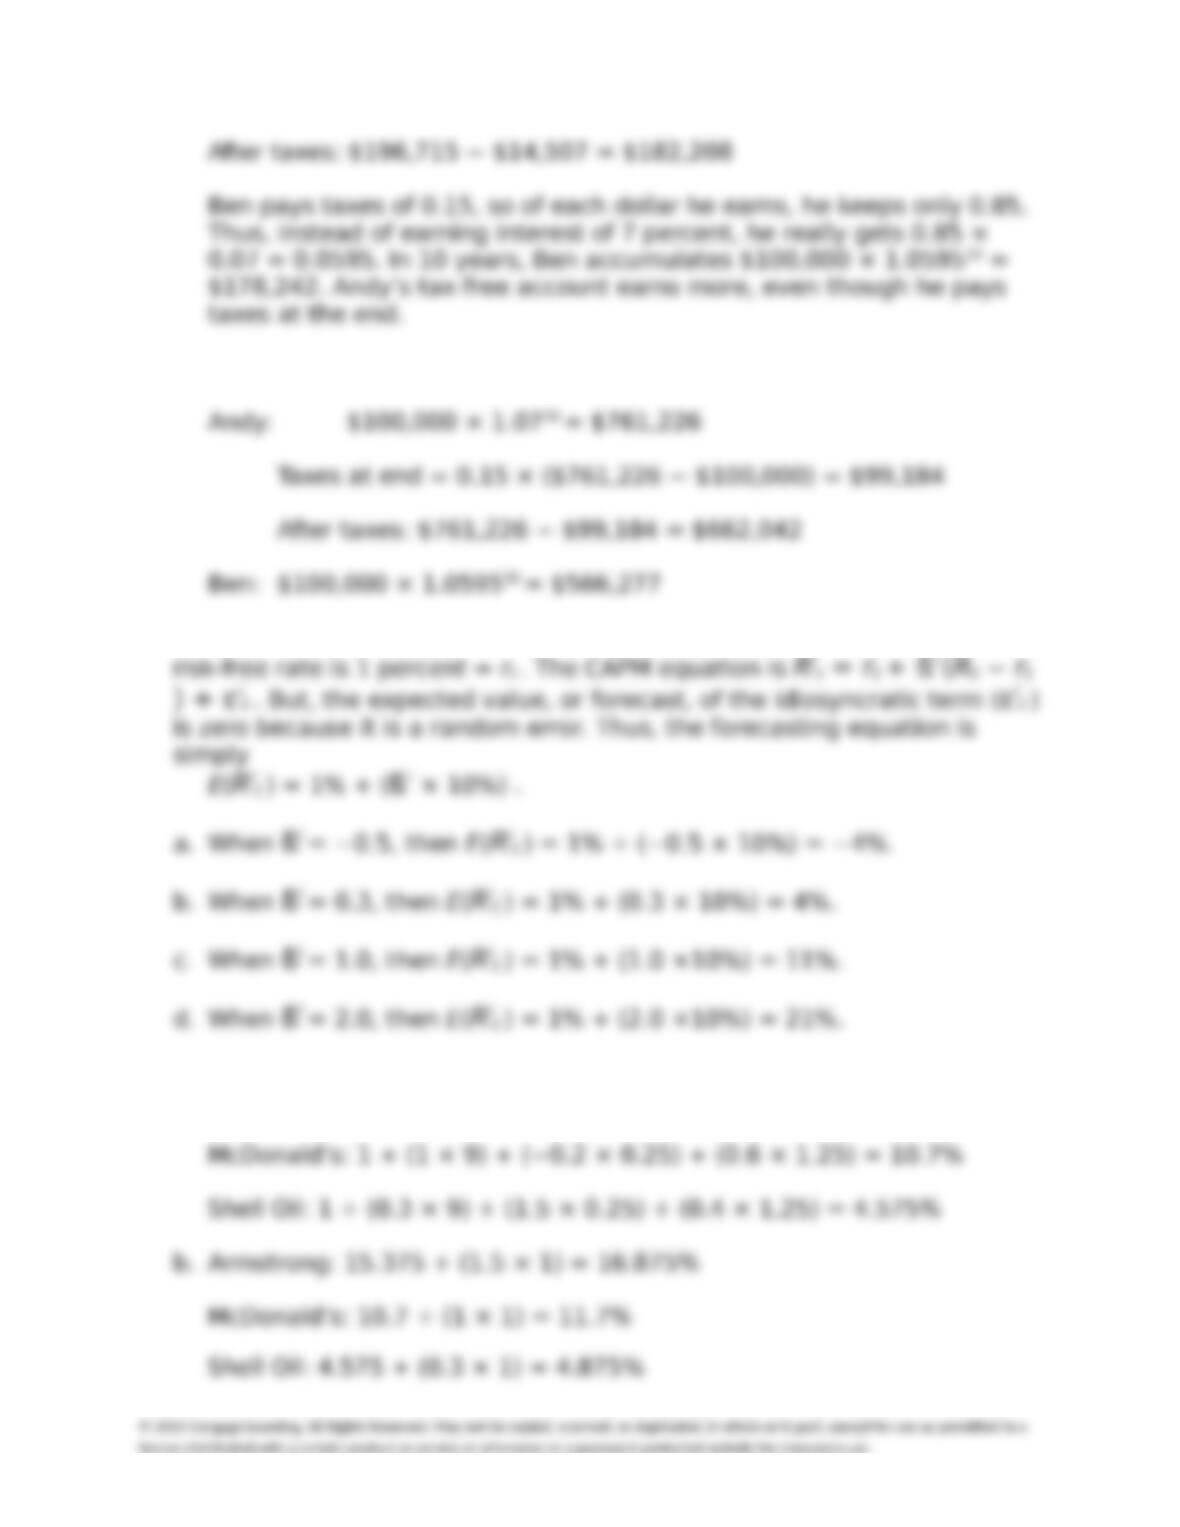
13. a. In ten years, Andy accumulates $100,000 × 1.0710 = $196,715.
Chapter 7: Stocks and Other Assets 67
b. For thirty years, the results are:
14. The average excess return to stocks is 10 percent = Rt − rt . The
15. a. Armstrong: 1 + (1.5 × 9) + (−0.5 × 0.25) + (0.8 × 1.25) =
15.375%
Chapter 7: Stocks and Other Assets 68
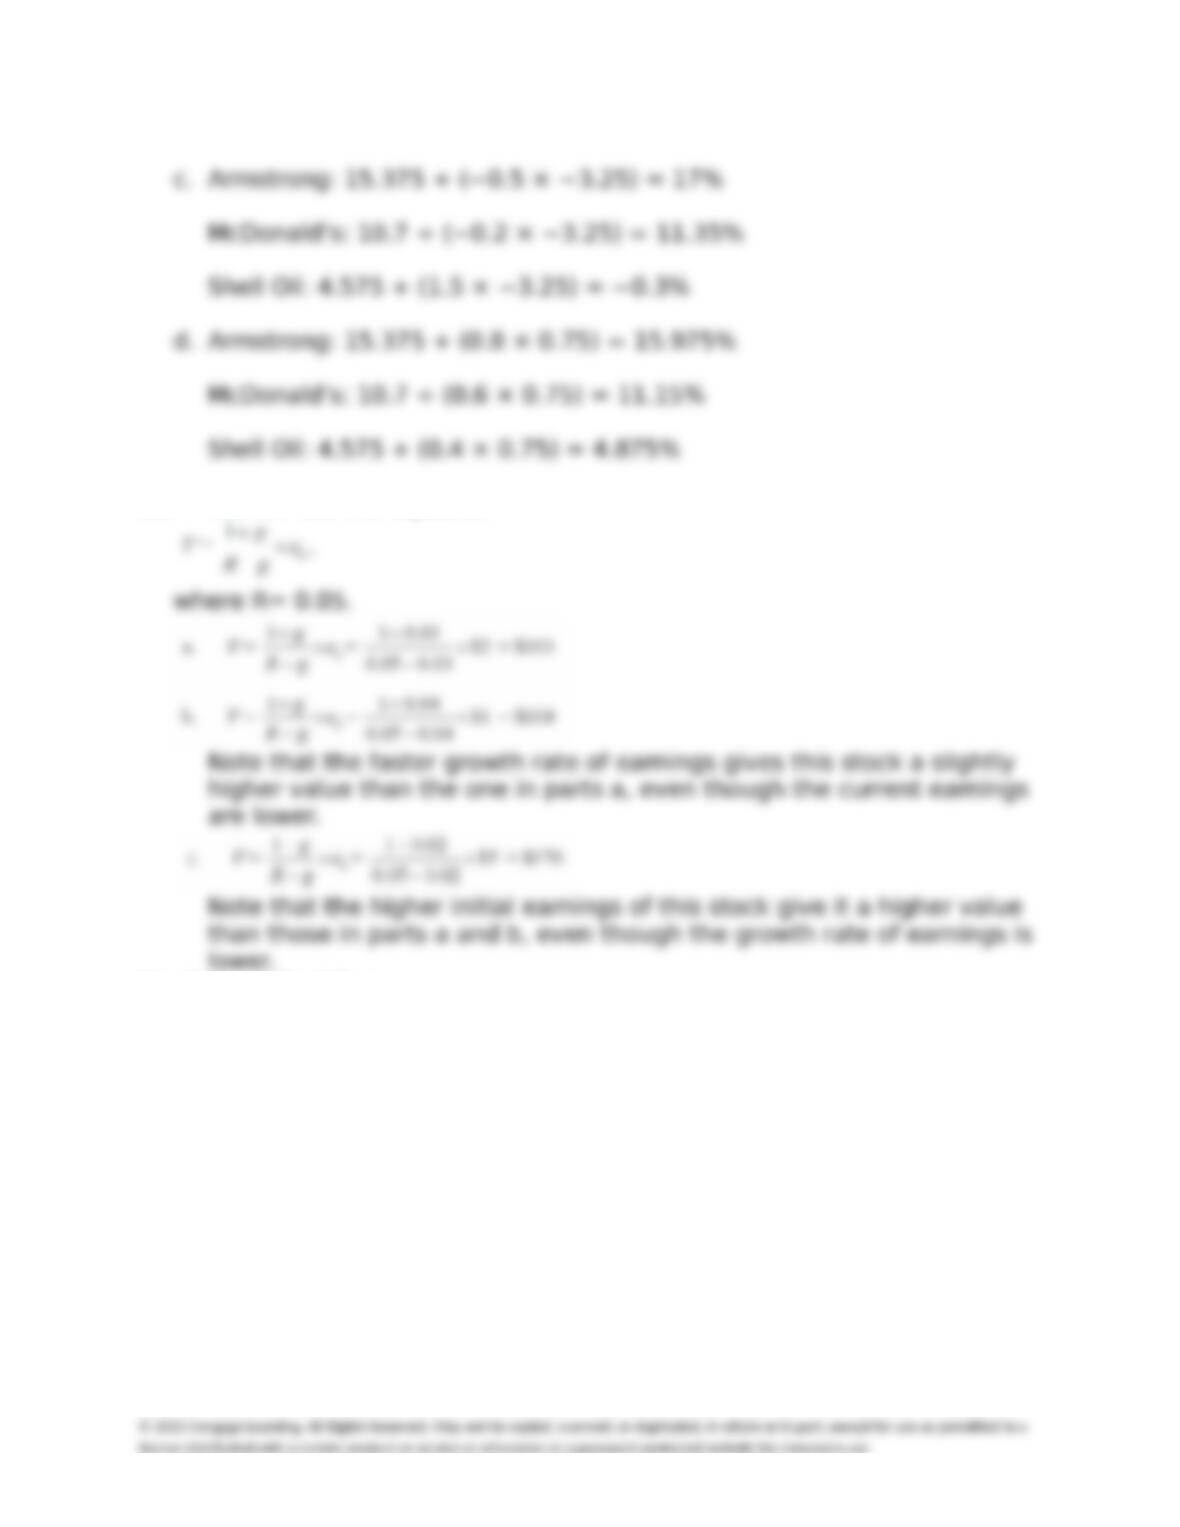
16. We will use the equation
Analytical Problems
17. The price of a seat probably rose in the 1980s and 1990s as investing
in the stock market became more popular and there was a greater need
for trades. Later in the 1990s, increased computerization probably
reduced the need for seats on the stock exchange, a trend that seems
likely to continue.
18. A person could keep the same total portfolio (counting both her private
investments and the government’s investments on her behalf) by
reducing her private investment in stocks by $30,000 and using the funds
to invest in debt securities. Then, her total portfolio would be $50,000 in
stocks and $55,000 in debt securities, just as before.
Chapter 7: Stocks and Other Assets 69
19. If the efficient markets hypothesis is true, then an investor should
spend very little time on research into companies. Buying an index mutual
fund would be ideal or randomly choosing stocks in a diversified portfolio.
21. Rodney likely has found an anomaly because theory suggested that
people may become pessimistic on Friday the thirteenth because of
superstition, and he tested only that theory which was con0rmed in the
data. Rodney’s evidence is more convincing than Danny’s because Danny
is data mining without theory, so his evidence is more likely to be a
statistical artifact.
ADDITIONAL TEACHING NOTES
The Primary Market Compared with the Secondary Market for Stock
Chapter 7: Stocks and Other Assets 70
Definition—underwrite: what an investment banking 0rm does,
guaranteeing that a new issue of stock will be sold or purchasing it
themselves, and then selling it to investors.
How Do Secondary Markets Help Primary Markets?
What Happens When a Stock-Market Transaction Takes Place?
Chapter 7: Stocks and Other Assets 71
How Does the Stock Market Transmit Information?
Chapter 7: Stocks and Other Assets 72
How Are Stock Indexes Calculated?
Chapter 7: Stocks and Other Assets 73
To illustrate the di erences between an equal-weighted index, such as the
Dow, and a market-capitalization weighted index, such as the S&P 500,
consider the following example. Suppose, there are two stocks in the index,
and we want to calculate an index for them based on the change in their
prices from year 1 to year 2. The relevant data are given here:
…
Company Number of
shares
issued
Price per share
Year 1
Price per share
Year 2
Aardvark Co. 100 $75 $90
Beeswax, Inc 250 $10 $6
…
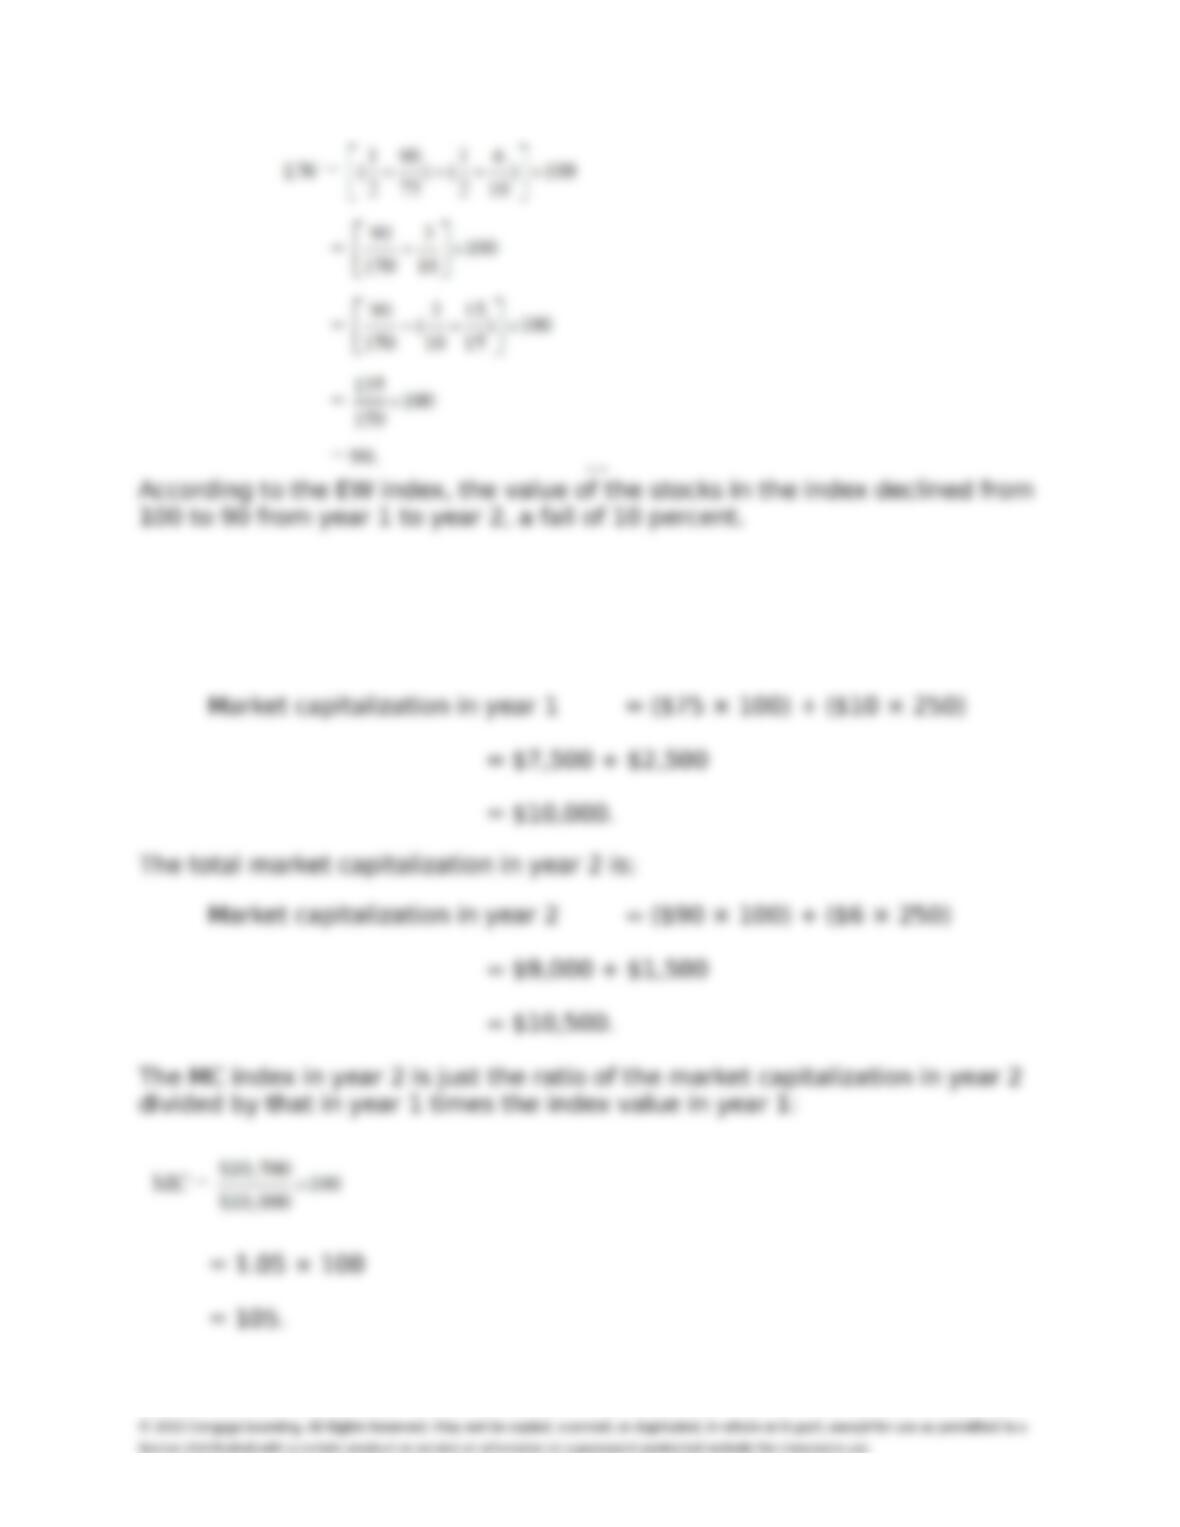
We want to create two indexes, one with equal weights such as the Dow,
..
Chapter 7: Stocks and Other Assets 74
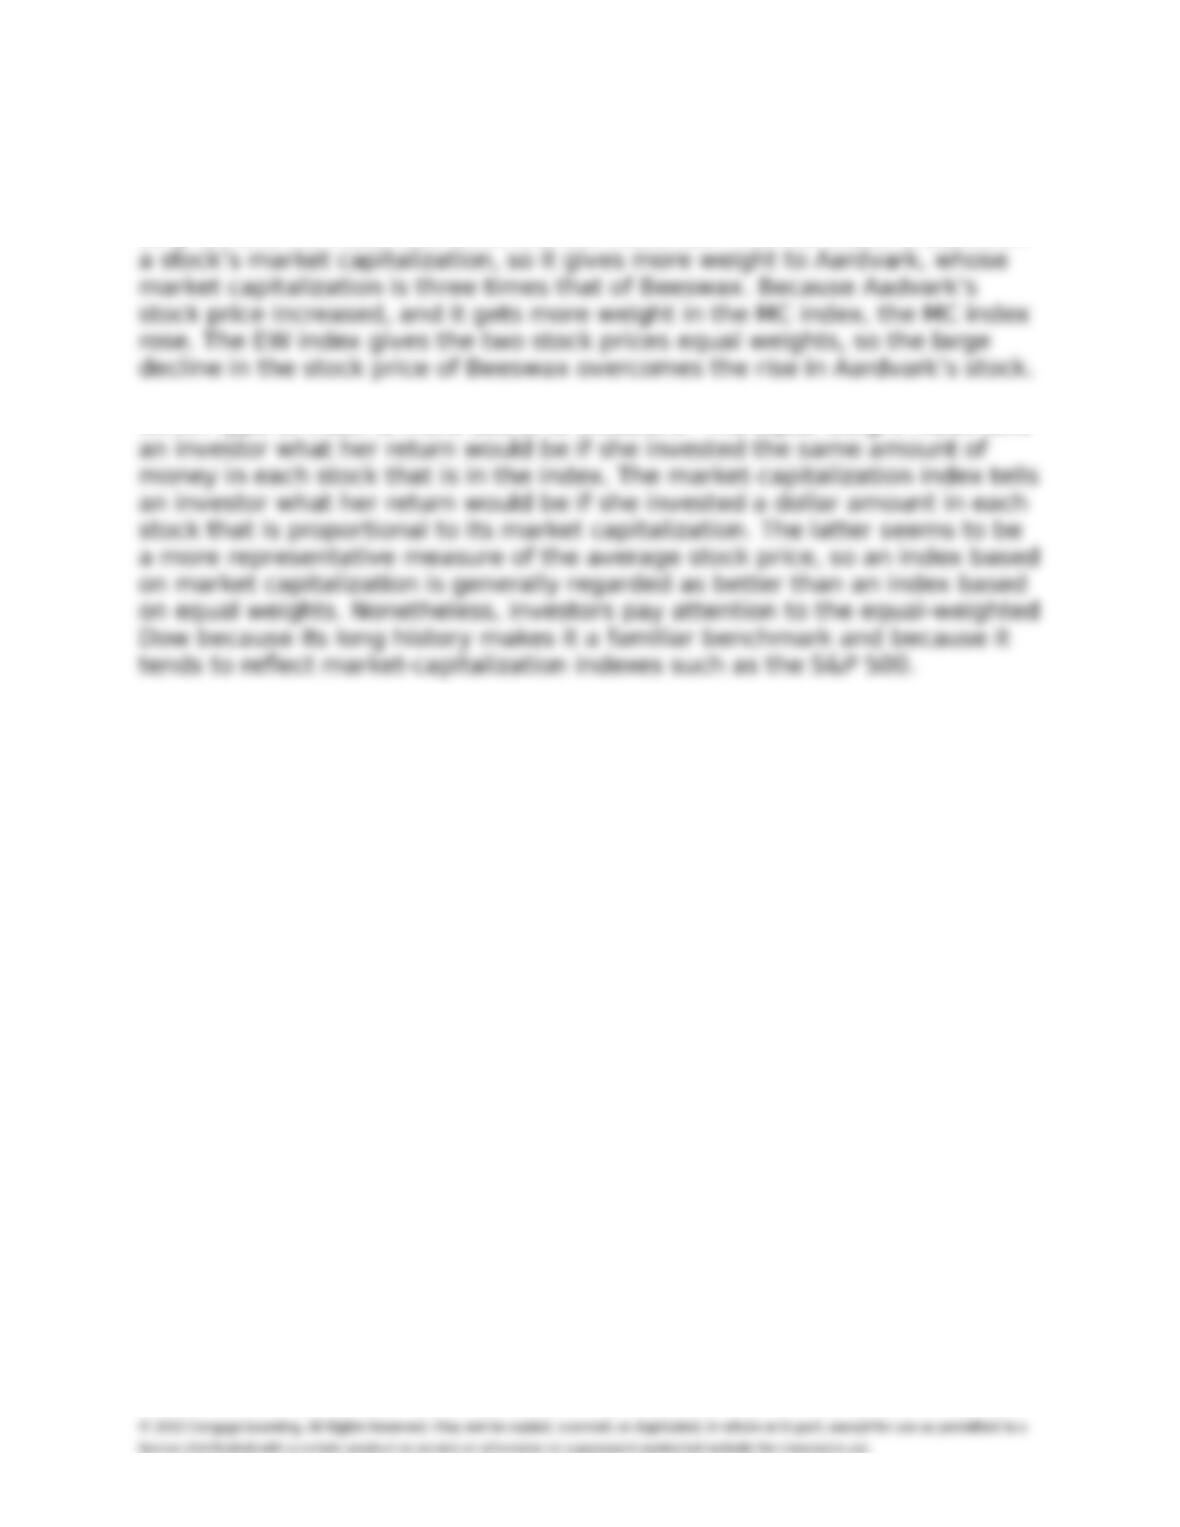
The MC index is based on the percentage change in the market capitalization
of the stocks in the index. Because market capitalization of a stock is its
share price times the number of shares, the total market capitalization in
year 1 equals:
Chapter 7: Stocks and Other Assets 75
The MC index rose from 100 in year 1 to 105 in year 2, an increase of 5
percent.
Why did the MC index rise while the EW index fell? The MC index is based on
Which type of index is more useful to investors? The equal-weight index tells