
Chapter 5: The Structure of Interest Rates 44
CHAPTER 5
The Structure of Interest Rates
TEACHING OBJECTIVES
Goals of Chapter 5
A. Learn about the structure of interest rates— why the interest rates on
various debt securities differ from each other and what those differences
mean.
B. Compare interest rates on short-term bonds with those on long-term
bonds to see how the relationship between such interest rates reffects
economic events.
TEACHING NOTES
A. What Explains Differences in Interest Rates?
1. The Many Different Types of Debt Securities; use Table 5.1
a) Personal saving via indirect finance: certi0cates of deposit, money
market deposit accounts
b) Personal borrowing
(1)Home loans, auto loans, credit-card loans
(2)Home loans: 0xed rate versus adjustable rate
c) Saving via direct finance
(1) Government bonds (federal, local, foreign), agency
securities, corporate debt, mortgage-backed securities,
commercial paper
(2) The process of turning assets into asset-backed securities
is securitization
2. Demand and Supply in the Secondary Market Affect Interest Rates
a) Risk: riskier securities must offer a higher yield to maturity to
compensate investors for the risk they are taking
b) Liquidity
(1) Less liquid securities must offer a higher yield to maturity
to compensate investors for the increased difficulty of selling
them

Chapter 5: The Structure of Interest Rates 45
securities whose times to maturity are not much different;
difference are measured in basis points
c) Taxation
(1)The yield to maturity on a local government bond is low because
interest earned on local government bonds is exempt from
federal income taxes
(2)The relationship between times to maturity and yield to maturity
is examined in greater detail in the section on the term structure
of interest rates
e) What changes the yields on different debt securities?
(1) Yields may change over time as conditions in the market
change
(2) The state of the economy might affect the risk of default
for some companies
(3) Example: the European Central Bank’s decision to bail out
the government of Greece, to keep it from defaulting on its debt,
increased yields on all securities; see Figure 5.1
3. Supply in the Primary Market Affects Interest Rates
a) A sudden change in the supply of securities, either current supply or
future supply, can affect the interest rate
b) An example was the announcement that the U.S. government would
no longer sell thirty-year Treasury bonds; the yield on the latest
Treasury bonds fell sharply on the day of the announcement; see
Figures 5.2 and 5.3
B. The Term Structure of Interest Rates
1. Data on the Term Structure of Interest Rates; use Figure 5.4
a) Short-term interest rates and long-term interest rates generally
move in the same direction
b) Short-term interest rates are usually lower than long-term interest
rates
c) Short-term interest rates are more volatile than long-term interest
rates

Chapter 5: The Structure of Interest Rates 46
5.5. The shape of the yield curve changes over time: it usually
slopes upward but sometimes downward; sometimes it is steep and
other times it is ffat; use Figure 5.6
2. How Investors Choose Between Short-Term and Long-Term Securities
a) Consider the point of view of an investor who could buy a two-year
bond or two successive one-year bonds; which is better depends on
the interest rates today on both bonds and the expected interest
rate in one year on a one-year bond; see Tables 5.2 and 5.3
3. What Determines the Term Structure of Interest Rates in Equilibrium?
a) The expectations theory of the term structure of interest
rates suggests that the average of current and future expected
short-term interest rates equals the long-term interest rate
b) According to the expectations theory, investors would receive the
same expected return, whether they buy short-term bonds or
long-term bonds; see Figure 5.7
c) The expectations theory implies that an upward-sloping yield curve
means short-term interest rates are expected to rise; a ffat yield
curve means short-term interest rates are expected to remain
unchanged; and a downward-sloping yield curve means short-term
interest rates are expected to decline; use Figure 5.8, Table 5.4,
Table 5.5, and Figure 5.9
C. Data Bank: How Accurate Are Expectations of Short-Term Interest Rates?
1. Examining forecasts of interest rates shows that the forecasts are fairly
accurate; see Figure 5.A
2. Forecasts formed one year ahead of time are less accurate than the
forecasts formed one quarter ahead of time; see Figures 5.B, and 5.C
D. The Term Premium
a) The expectations theory of the term structure appears to be wrong,
because the data show that the yield curve usually slopes upward,
even when short-term interest rates are not expected to change
b) Missing from the theory is an examination of risk, which investors
also care about
Chapter 5: The Structure of Interest Rates 47
a) Longer-term bonds are riskier than shorter-term bonds because their
price changes more for a given change in the market interest rate
b) Table 5.6 and Figure 5.10 illustrate this fact
2. How Do We Incorporate a Term Premium in Our Analysis?
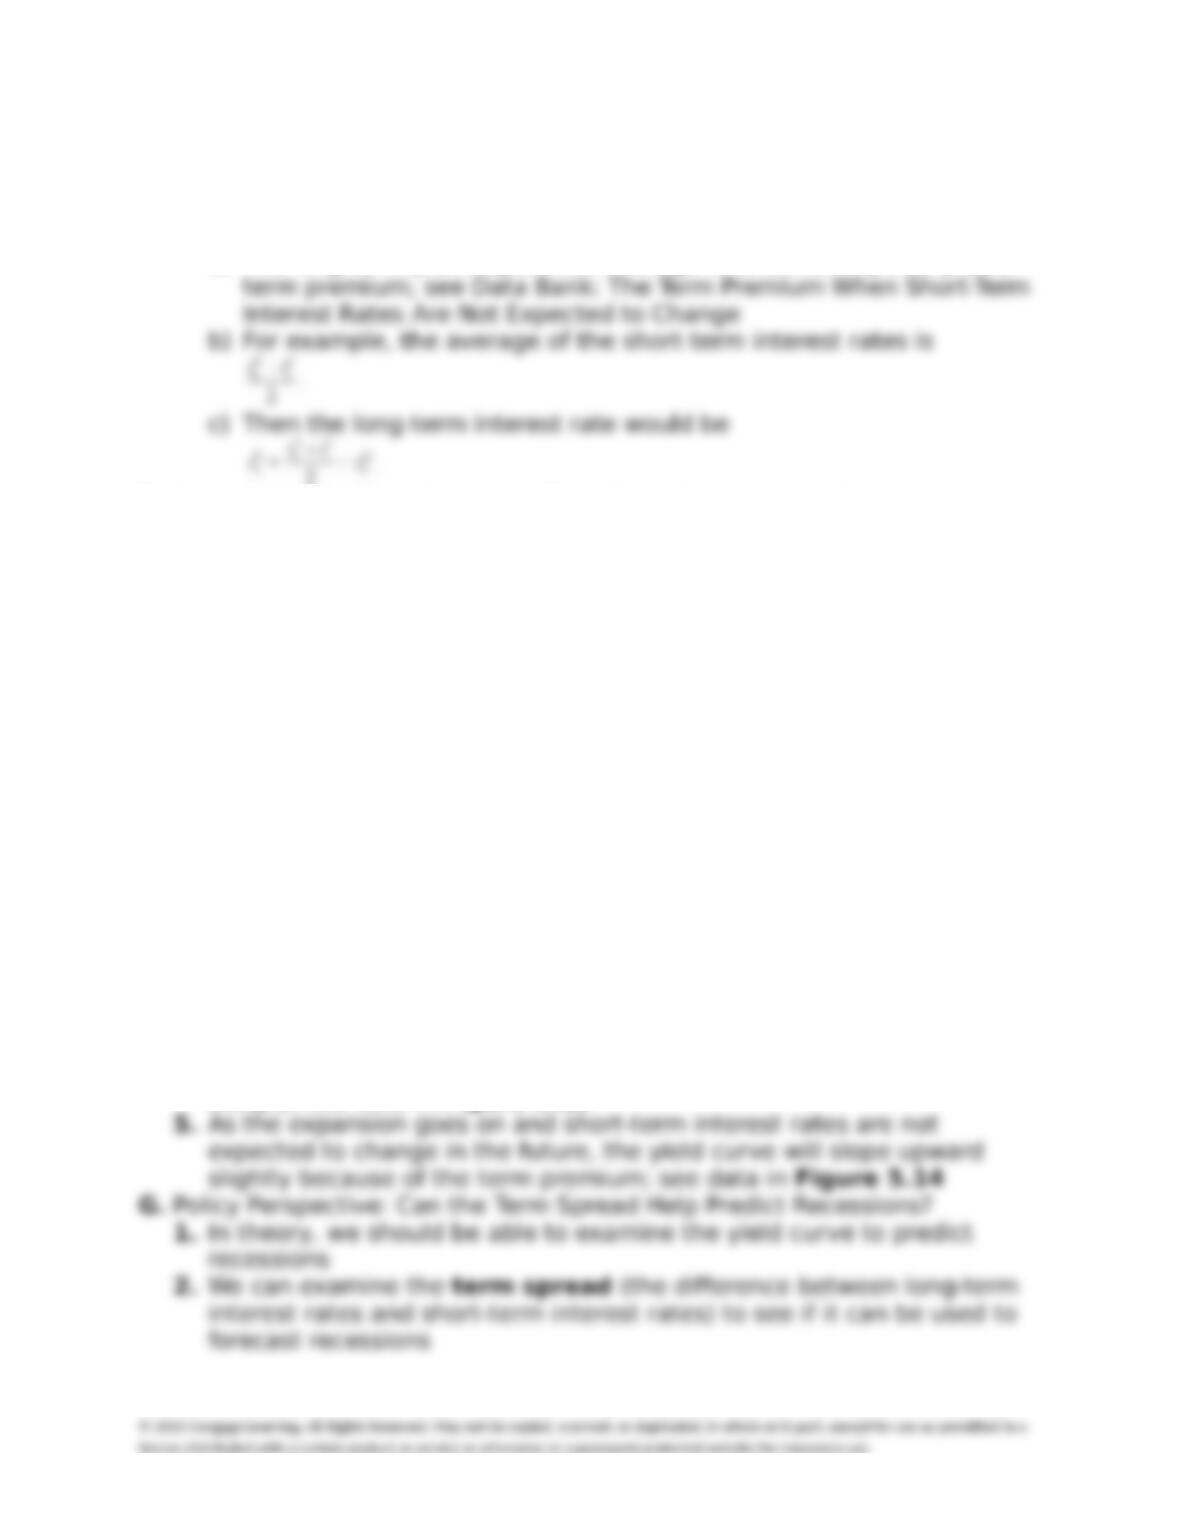
a) The long-term yield equals the average of short-term yields plus a
E. Data Bank: The Term Premium When Short-Term Interest Rates Are Not
Expected To Change
1. Looking at periods when short-term interest rates are not expected to
change, we can measure the size of the term premium
2. The data on the range of expected rates on bonds with varying
maturities suggest that the term premium changes signi0cantly over
time, which complicates our analysis
F. The Yield Curve and the Business Cycle
1. In a recession, borrowing usually declines more than saving, so the
interest rate usually falls; use Figure 5.11
2. Because long-term interest rates equal the average of short-term
interest rates over time plus a term premium, and assuming that the
term premium does not change very much in recessions, long-term
interest rates will not change as much over the business cycle as
short-term interest rates
3. At the beginning of a recession, interest rates are expected to decline,
so the average of short-term interest rates over time will be less than
today’s short-term interest rate; if the term premium is not too large,
then the yield curve will slope downward: an inverted yield curve;
Figure 5.12 shows data on this
4. As the economy exits the recession and improves, people expect
short-term interest rates to rise, so the yield curve will slope upward
steeply; see data in Figure 5.13

Chapter 5: The Structure of Interest Rates 48
3. A small or negative spread is correlated with recessions, but the
correlation is far from perfect; use Figure 5.15
4. A better view of the data is that a low or negative term spread
increases the probability of a recession
ADDITIONAL ISSUES FOR CLASSROOM DISCUSSION
1. This is a good chapter that you can use with the Wall Street Journal or the
section of its online Web site called the Market Data Center. Much of the
detailed data that previously was routinely reported in the paper edition is
now available online only. If you go online to the Web pages that show
bond prices and interest rates on various bonds, you can illustrate how all
the various factors considered in this chapter affect interest rates on
different bonds
2. Students are often confused about the difference between the term
premium and the term spread, which is not surprising given that the
concepts are similar and related. After defining both of them, you might
0nd it useful to compare and contrast the two. You should emphasize that
the term spread is simply a measure of difference between long-term
interest rates and short-term interest rates at any particular date, so it is
something that can be measured using the data. The term premium,
however, is a concept that cannot be measured, as it represents the