Chapter 4/The Market Forces of Supply and Demand ❖ 61
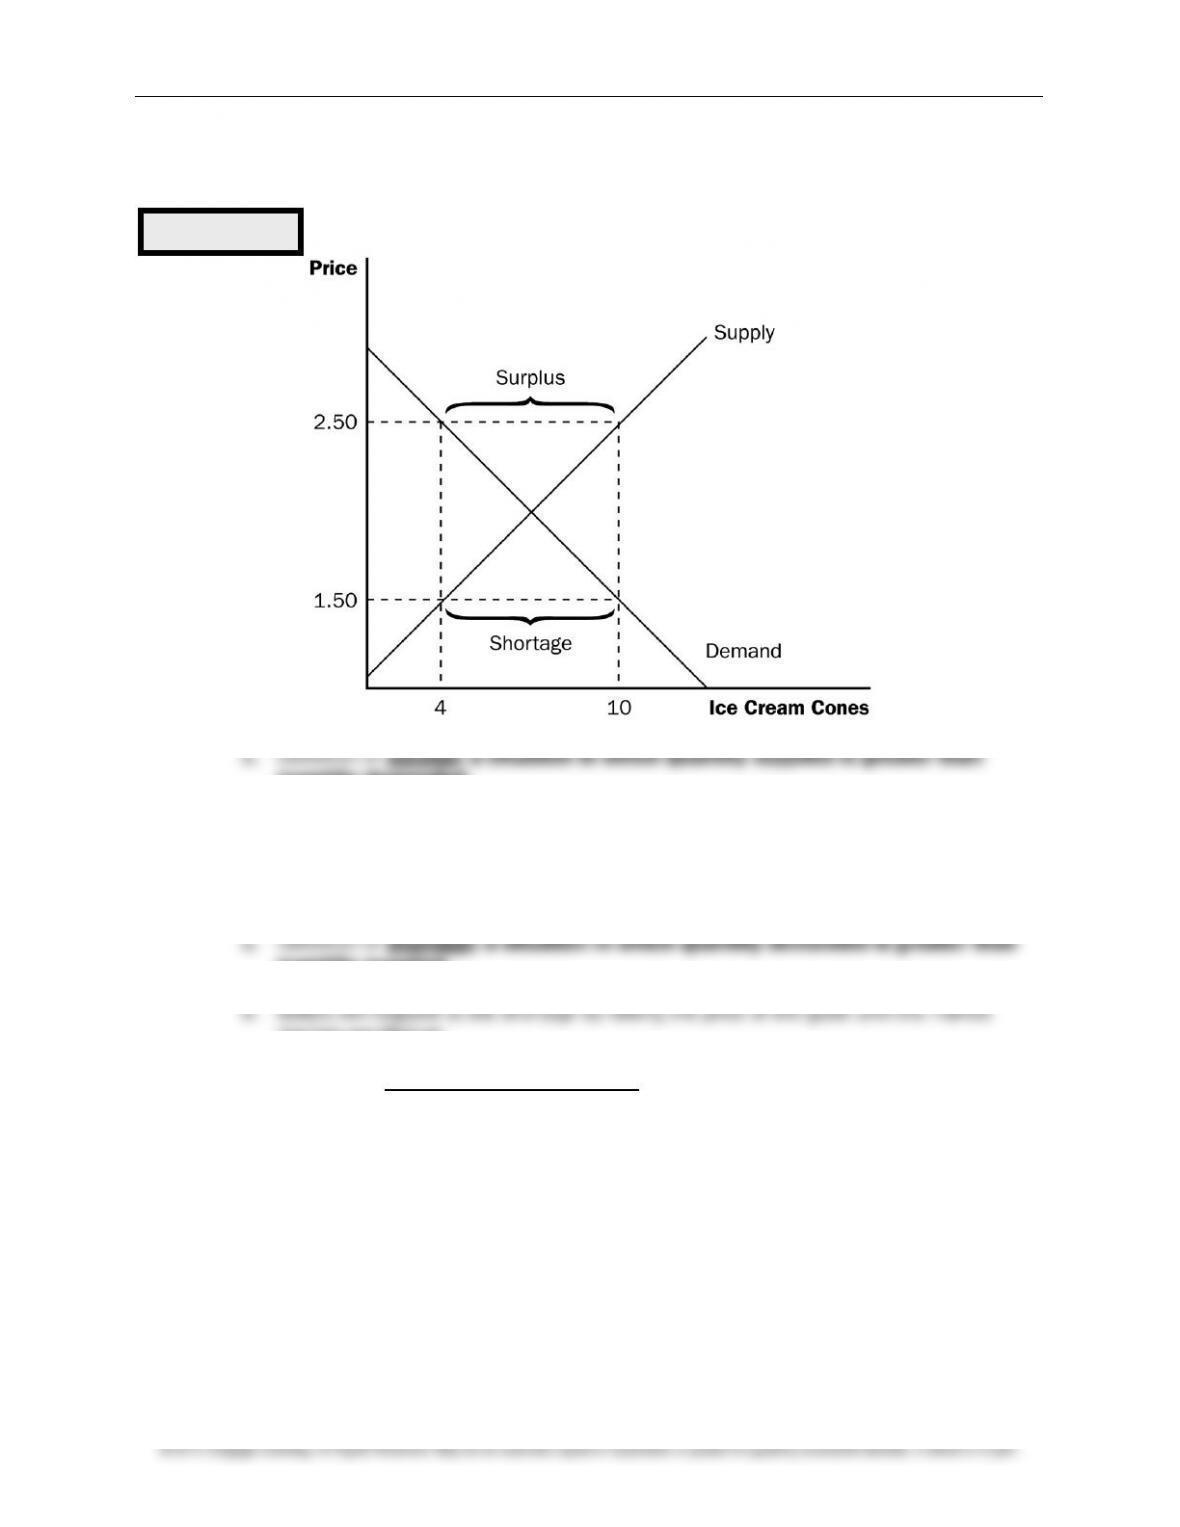
6. If the actual market price is higher than the equilibrium price, there will be a surplus of the
good.
quantity demanded.
b. To eliminate the surplus, producers will lower the price until the market reaches
equilibrium.
7. If the actual price is lower than the equilibrium price, there will be a shortage of the good.
quantity supplied.
reaches equilibrium.
8. Definition of the law of supply and demand: the claim that the price of any good
adjusts to bring the supply and demand for that good into balance.
Figure 9
62 ❖ Chapter 4/The Market Forces of Supply and Demand
Activity 2—Campus Parking
Type: In-class assignment
Topics: Demand, supply, disequilibrium, shortage, rationing
Materials needed: A shortage of student parking on campus
Time: 35 minutes
Class limitations: Works in large lectures or small classes, if there is a campus parking
problem.
Purpose
Nothing seems to generate more heated discussion than campus parking. If your school has a
parking shortage this assignment brings the ideas of price rationing and resource allocation to
an issue close to the students’ hearts.
A. K. Sen’s parable of the bamboo flute is a good introduction to this assignment: An artist
makes a beautiful instrument that becomes famous throughout the country. A number of
claimants arise, each of whom argues that they deserve the flute: the artist who created it,
musician, etc. Who deserves the flute? Students will have different opinions on who is most
deserving but many will accept a market solution—the person who is willing to pay the most
(who has the highest marginal benefit, given the existing distribution of wealth and income).
The allocation of campus parking spots makes a nice parallel.
question, then discuss their answers before moving to the next question.
Common Answers and Points for Discussion
1. Write down three things that are true about the parking situation on campus.
2. What two problems do you think are most important?
The parking problem has two components in the eyes of most students. Parking permits are
too expensive and there are too few spaces.
3. What policies could the administration make to resolve these problems?
Students have many policies to alleviate the situation. The most common suggestion is to ban
Another popular policy would be to open faculty lots to student parking. Parking fees should
be lowered or better yet eliminated. Parking violations should have lower fines. More lots
should be built. Shuttles, moving sidewalks, and monorails should be installed.
5. Who would pay the most for parking?
Asking about need and willingness to pay moves the discussion away from group prohibitions;
freshmen may be just as needy and equally able to pay.
6. Use a supply-and-demand graph to analyze this problem.
3. Use the supply-and-demand diagram to see how the shift changes the equilibrium price and
quantity.
the market for ice cream.
Table 3
This three-step process is very important. Students often want to jump to the end
without thinking the change through. They should be provided with numerous
examples so that they can see the benefit of analyzing a change in equilibrium one
step at a time.
Figure 10
Go through changes in supply and demand carefully. Show students why the
equilibrium price must change after one of the curves shifts. For example, point out
that if demand rises, a shortage will occur at the original equilibrium price. This leads
to an increase in price, which causes quantity supplied to rise and quantity
demanded to fall until equilibrium is achieved. The end result is an increase in both
the equilibrium price and equilibrium quantity. Also point out that an increase in
demand leads to an increase in
quantity supplied,
not
supply
.
Many students initially have difficulty graphing this problem. They want to illustrate that
permit prices are too high, but then their graph will not show the shortage. Eventually they
can be convinced that parking, while expensive, is actually priced too low.
7. How would your policy proposals affect the market for parking?
Analysis of the various proposals in a supply-and-demand framework shows some popular
policies, like free permits, would aggravate the parking shortage. Policies to restrict demand
can reduce the shortage, although there will be inefficiencies in the resulting allocation. Make
sure that students realize that building more parking lots is not a shift in the supply curve, but
a movement along the existing supply curve. The additional costs of new parking need to be
covered by some means: higher parking fees, tuition increases, or taxpayer subsidies.
1. A shift in the demand curve is called a “change in demand.” A shift in the supply curve is
called a “change in supply.”
2. A movement along a fixed demand curve is called a “change in quantity demanded.” A
movement along a fixed supply curve is called a “change in quantity supplied.”
E. Example: A change in market equilibrium due to a shift in supply—the effect of a hurricane that
destroys part of the sugar-cane crop and drives up the price of sugar.
F. Example: Shifts in both supply and demand—the effect of hot weather and a hurricane that
destroys part of the sugar cane crop.
G. Summary
1. When an event shifts the supply or demand curve, we can examine the effects on the
equilibrium price and quantity.
Figure 12
ALTERNATIVE CLASSROOM EXAMPLE:
Go through these examples of events that would shift either the demand or supply of #2 lead
pencils:
an increase in the income of consumers
an increase in the use of standardized exams (using opscan forms)
a decrease in the price of graphite (used in the production of pencils)
a decrease in the price of ink pens
the start of a school year
new technology that lowers the cost of producing pencils.
Emphasize that students should not think about the curves shifting “up” and “down”
but rather think about the curves shifting “right” and “left” (or “out” and “in”). Point
out that an increase in demand (or supply) is an increase in the quantity demanded
(supplied) at every price. Thus, it is quantity that is getting larger. Review the same
principle with a decrease in demand (or supply).
It would helpful to students if you draw all four graphs (increase in demand,
decrease in demand, increase in supply, and decrease in supply) on the board at the
same time. Students will be able to see that the end result of each of these four
shifts is unique. Point out to students that they can use these graphs to explain
events going on in markets around them. For example, point out changes in gasoline
prices seen during the past several years. Then ask students what could have led to
these changes in price. Make sure that they realize that they would need to know the
effect on equilibrium quantity to determine the ultimate cause.
Figure 11
Chapter 4/The Market Forces of Supply and Demand ❖ 65
H.
In the News: Price Increases after Disasters
2. This article from
CNBC.com
defends price increases following natural disasters as a natural
result of market interactions.
V. Conclusion: How Prices Allocate Resources
B. Supply and demand together determine the prices of the economy’s goods and services.
1. These prices serve as signals that guide the allocation of scarce resources in the economy.
Table 4
Make sure that you explain to students that two possible outcomes might result,
depending on the relative sizes of the shifts in the demand and supply curves. Thus,
if they do not know the relative sizes of these shifts, the end effect on either
equilibrium price or equilibrium quantity will be ambiguous. Teach students to shift
each curve using the three-step method and to draw them on separate graphs.
Make a big deal about how well prices serve to allocate resources to their highest
valued uses. For example, suppose that consumers develop an increased taste for
corn and corn products. This leads to an increase in the demand for corn, pushing
the price up. This increased price provides incentives to producers to produce more
corn. Thus, price signals our wants and desires. This is one reason why markets
generally serve as the best way to organize economic activity.
Activity 3—Supply and Demand Article
Type: Take-home assignment
Topics: Shifts in supply or demand, changing equilibrium
Class limitations: Works in any class
Purpose
This assignment is an excellent way to determine which students need extra help in
understanding supply and demand. Students who have difficulty with it often need remedial
help. Allowing students to correct errors and then resubmit the assignment can be worthwhile
because it is fundamental to their understanding of how markets work.
Instructions
Give the students the following assignment:
Find an article in a recent newspaper or magazine illustrating a change in price or quantity in
some market. Analyze the situation using economic reasoning.
1. Has there been an increase or decrease in demand? Factors that could shift the
price of substitutes or complements, or changes in the number of consumers in
the market.
2. Has there been an increase or decrease in supply? Factors that could shift the
supply curve include changes in costs of materials, wages, or other inputs;
changes in technology; or changes in the number of firms in the market.
3. Draw a supply-and-demand graph to explain this change. Be sure to label your
graph and clearly indicate which curve shifts.
Ask students to turn in a copy of the article along with their explanation. Warn students to
avoid advertisements because they contain little information. They should be wary of
commodity and financial markets unless they have a good understanding of the particular
market. Markets for ordinary goods and services are most easily analyzed.
Points for Discussion
Most changes will only shift one curve—either supply or demand—not both. Remind students
Equilibrium points are not fixed. They change when supply or demand changes. Prices will not
necessarily return to previous levels nor will quantities.
Remind the students of the four graphs showing the shifts in supply and demand.
Chapter 4/The Market Forces of Supply and Demand ❖ 67
SOLUTIONS TO TEXT PROBLEMS:
Quick Quizzes
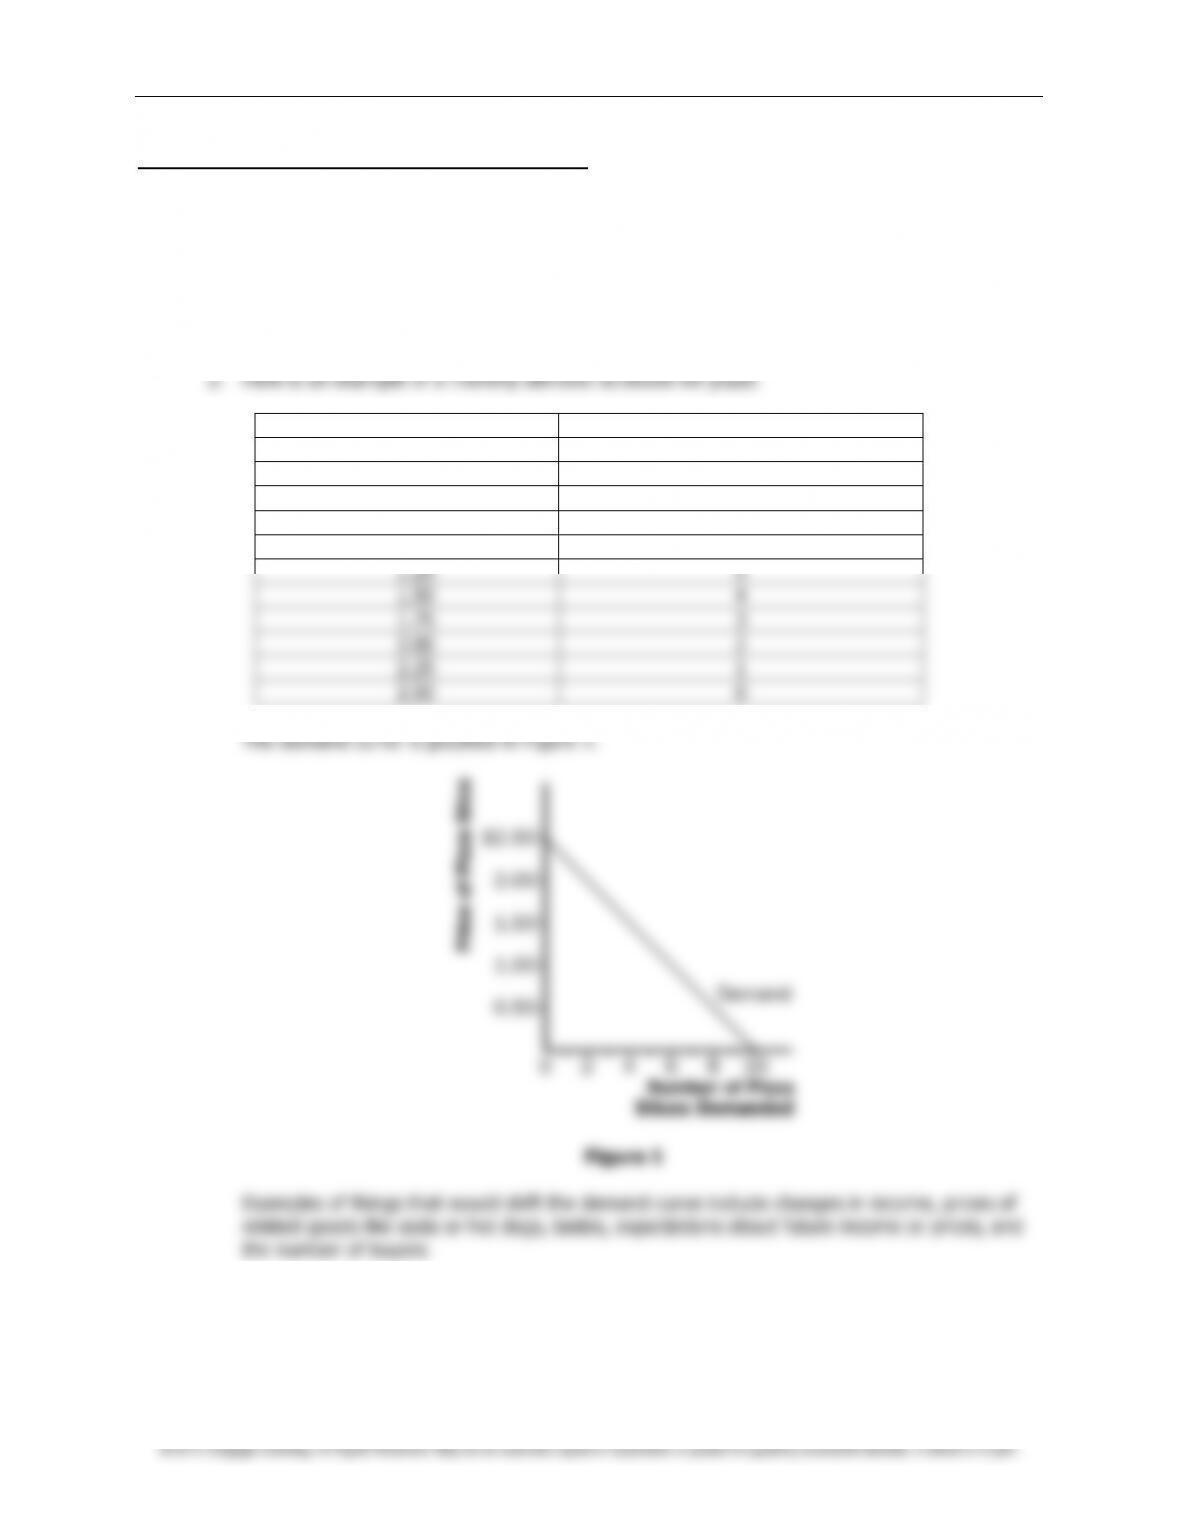
1. A market is a group of buyers (who determine demand) and a group of sellers (who
determine supply) of a particular good or service. A perfectly competitive market is one in
which there are many buyers and many sellers of an identical product so that each has a
negligible impact on the market price.
Price of Pizza Slice
Number of Pizza Slices Demanded
$ 0.00
10
0.25
9
0.50
8
0.75
7
1.00
6
1.25
5
1.50
4
1.75
3
2.00
2
2.25
1
2.50
0
A change in the price of pizza would not shift this demand curve; it would only lead to a
movement from one point to another along the same demand curve.
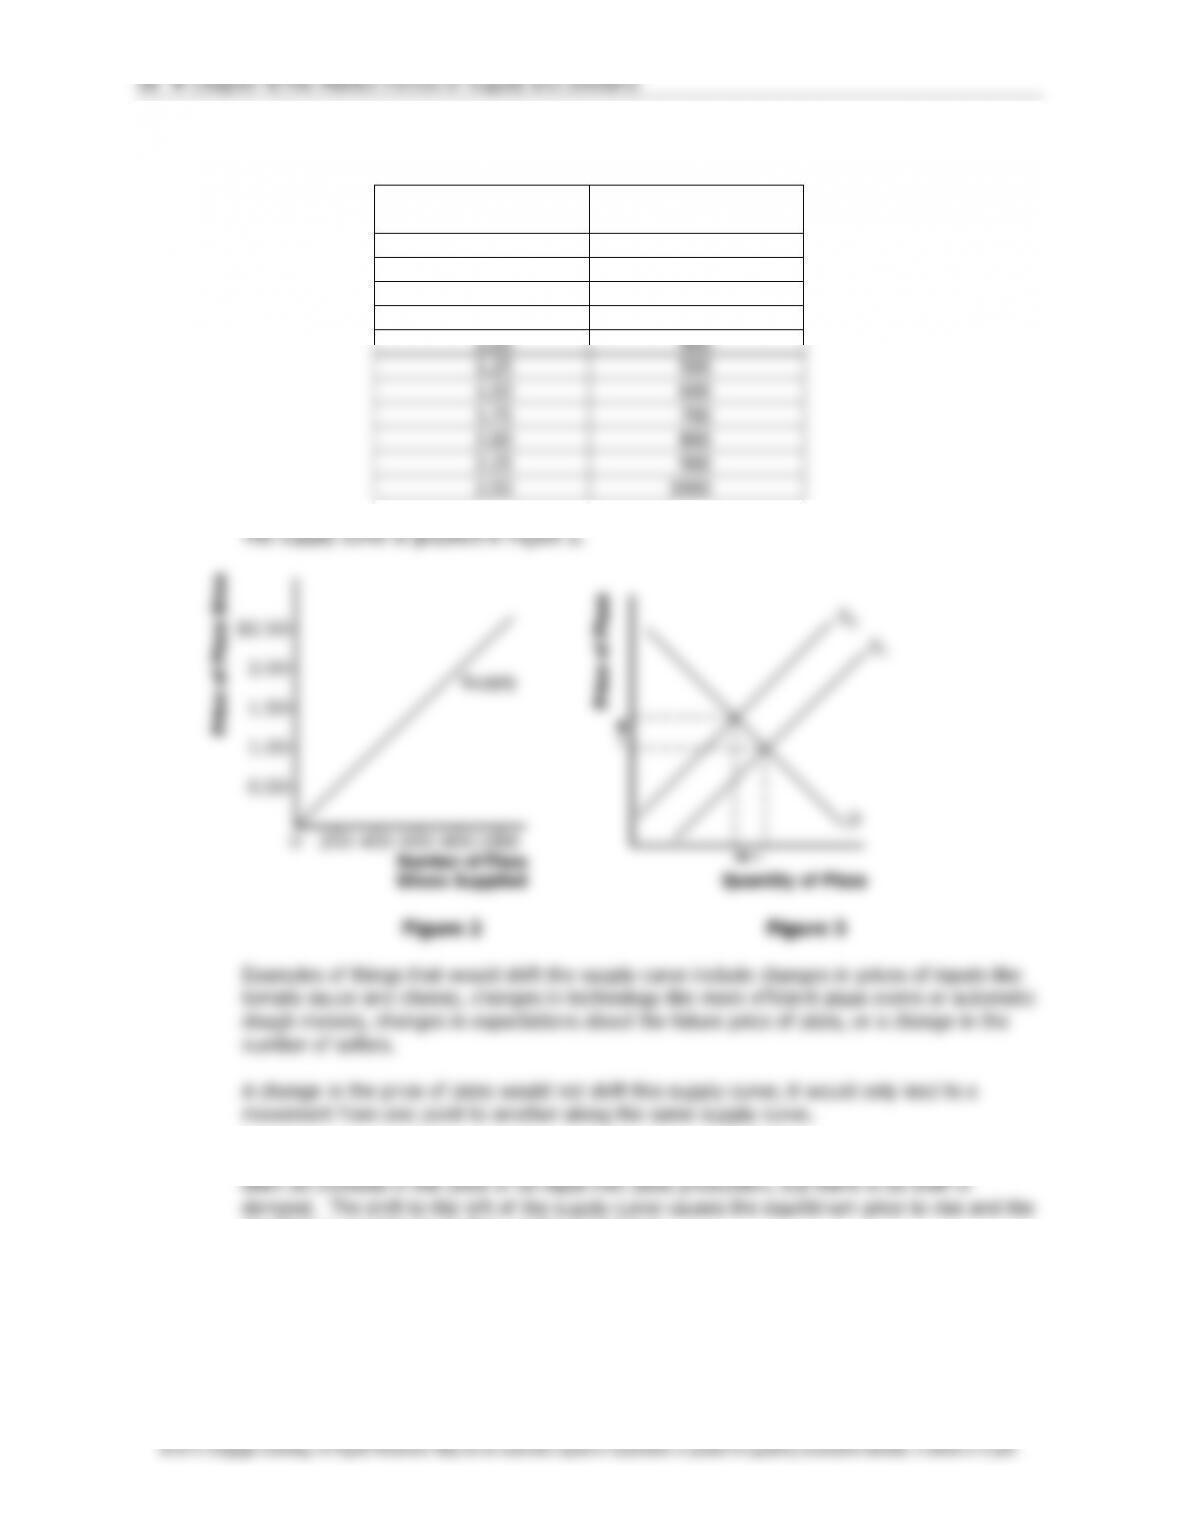
3. Here is an example of a monthly supply schedule for pizza:
Price of Pizza Slice
Number of Pizza
Slices Supplied
$ 0.00
0
0.25
100
0.50
200
0.75
300
1.00
400
1.25
500
1.50
600
1.75
700
2.00
800
2.25
900
2.50
1000
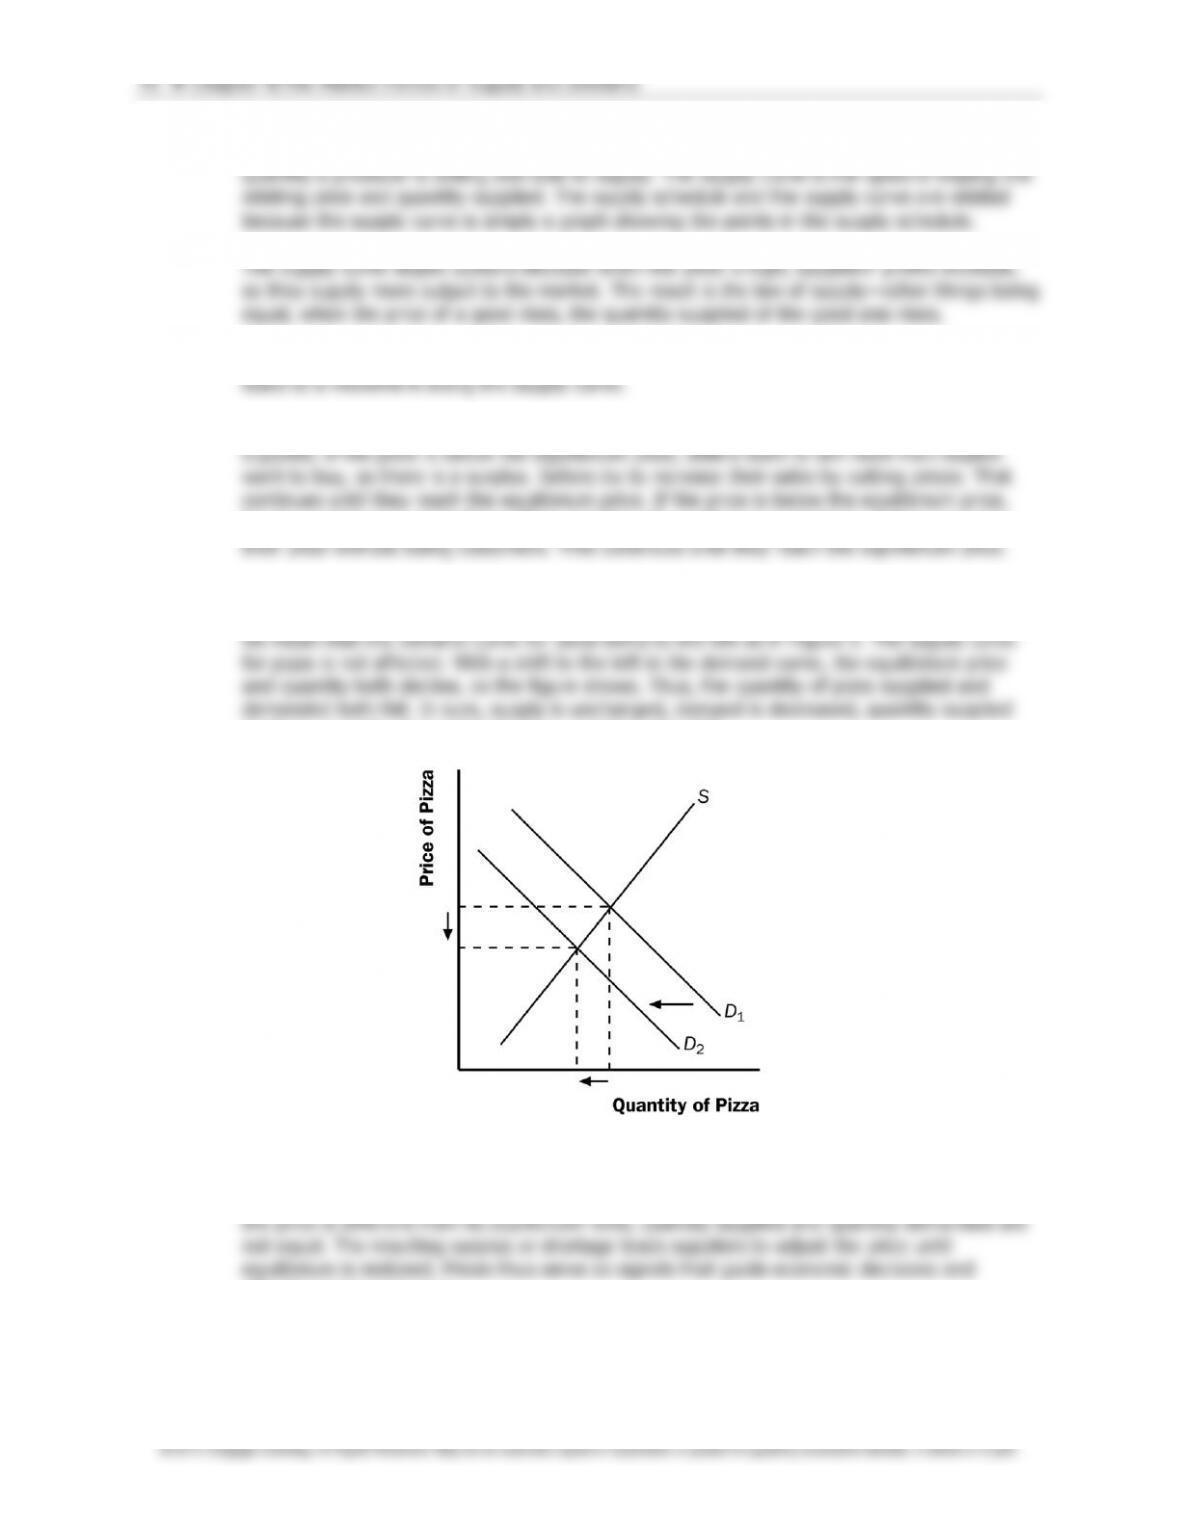
4. If the price of tomatoes rises, the supply curve for pizza shifts to the left because there has
equilibrium quantity to decline, as Figure 3 shows.
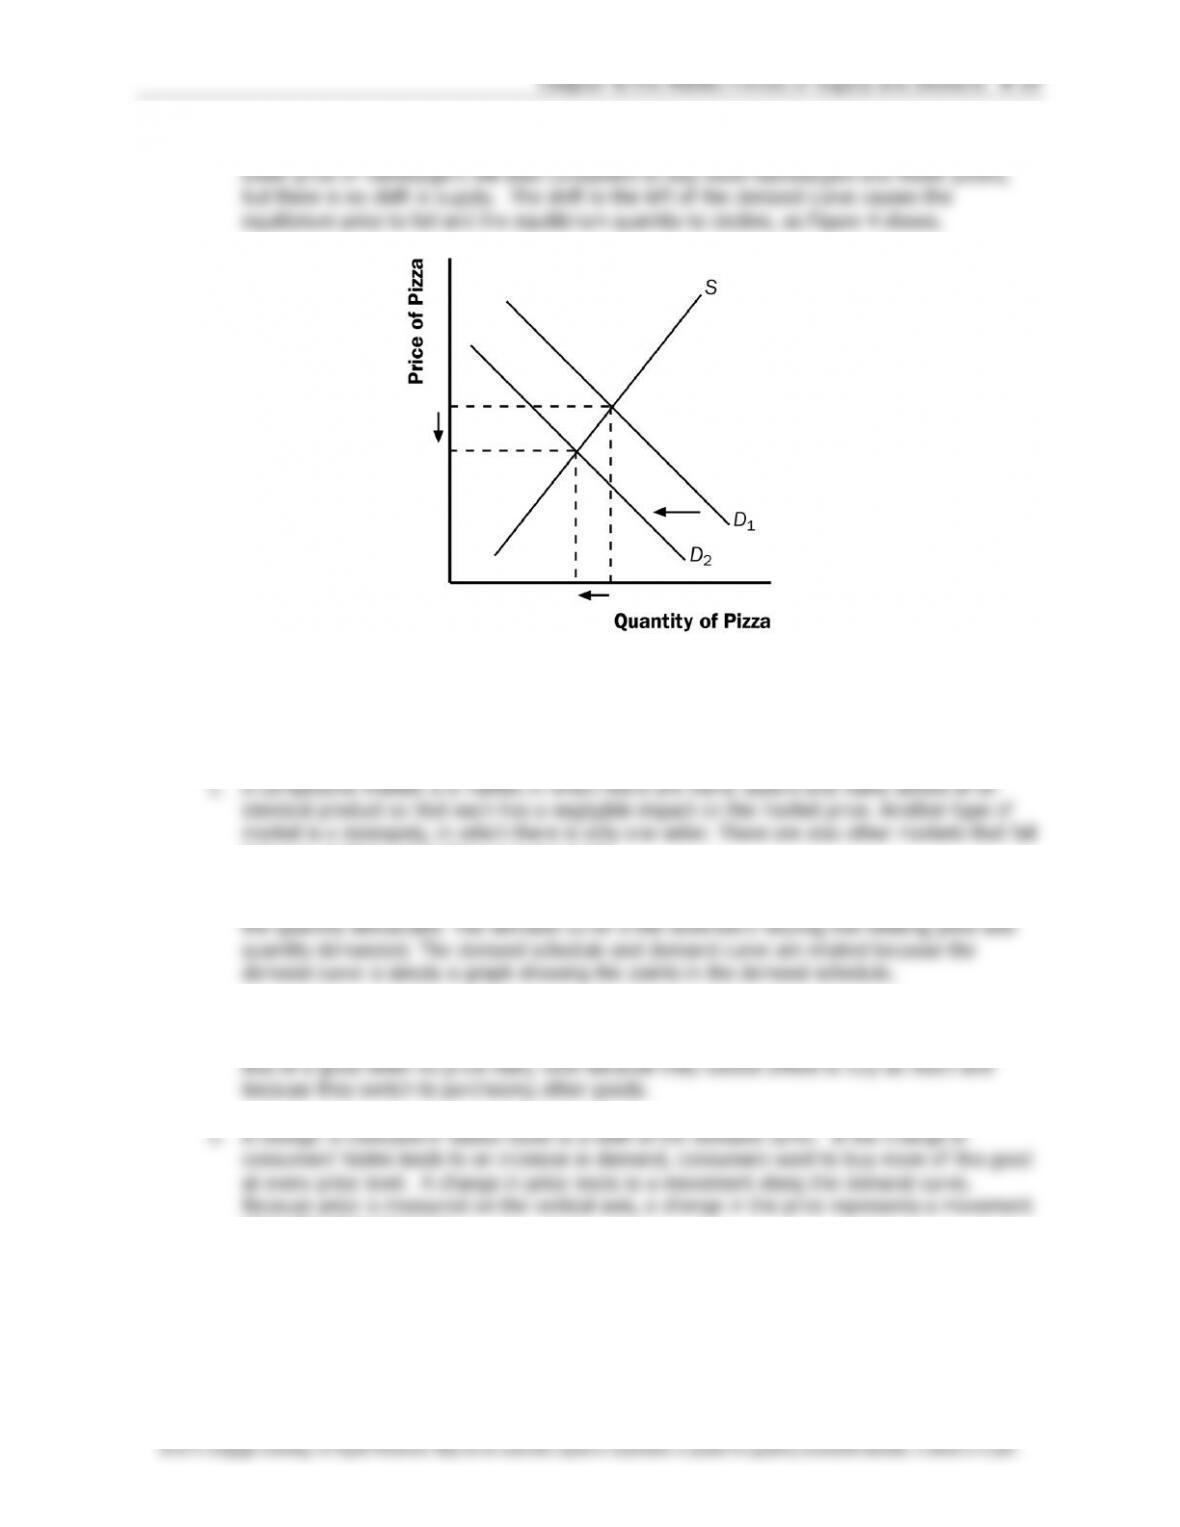
If the price of hamburgers falls, the demand curve for pizza shifts to the left because the
Figure 4
Questions for Review
between perfect competition and monopoly.
2. The demand schedule is a table that shows the relationship between the price of a good and
The demand curve slopes downward because of the law of demand—other things being
equal, when the price of a good rises, the quantity demanded of the good falls. People buy
along the demand curve.
4. Because Popeye buys more spinach when his income falls, spinach is an inferior good for
him. His demand curve for spinach shifts out to the right as a result of the decrease in his
income.
5. A supply schedule is a table showing the relationship between the price of a good and the
6. A change in producers’ technology leads to a shift in the supply curve. A change in price
7. The equilibrium of a market is the point at which the quantity demanded is equal to quantity
buyers want to buy more than sellers want to sell, so there is a shortage. Sellers can raise
8. When the price of beer rises, the demand for pizza declines, because beer and pizza are
complements and people want to buy less beer. When we say the demand for pizza declines,
declines, quantity demanded declines, and the price falls.
Figure 5
9. Prices play a vital role in market economies because they bring markets into equilibrium. If
allocate scarce resources.