51
WHAT’S NEW IN THE SEVENTH EDITION:
The
In the News
feature “Price Increases after Disasters” has been updated with a new article.
LEARNING OBJECTIVES:
By the end of this chapter, students should understand:
what a competitive market is.
what determines the supply of a good in a competitive market.
how supply and demand together set the price of a good and the quantity sold.
CONTEXT AND PURPOSE:
prices and quantities in markets.
The purpose of Chapter 4 is to establish the model of supply and demand. The model of supply and
demand is the foundation for the discussion for the remainder of this text. For this reason, time spent
studying the concepts in this chapter will return benefits to your students throughout their study of
economics. Many instructors would argue that this chapter is the most important chapter in the text.
4
THE MARKET FORCES OF
SUPPLY AND DEMAND
KEY POINTS:
Economists use the model of supply and demand to analyze competitive markets. In a competitive
price.
The demand curve shows how the quantity of a good demanded depends on the price. According to
the law of demand, as the price of a good falls, the quantity demanded rises. Therefore, the demand
curve slopes downward.
The supply curve shows how the quantity of a good supplied depends on the price. According to the
law of supply, as the price of a good rises, the quantity supplied rises. Therefore, the supply curve
slopes upward.
curve shifts.
The intersection of the supply and demand curves determines the market equilibrium. At the
equilibrium price, the quantity demanded equals the quantity supplied.
the market price to rise.
To analyze how any event influences a market, we use the supply-and-demand diagram to examine
how the event affects equilibrium price and quantity. To do this we follow three steps. First, we
decide whether the event shifts the supply curve or the demand curve (or both). Second, we decide
In market economies, prices are the signals that guide economic decisions and thereby allocate
and how much sellers choose to produce.
CHAPTER OUTLINE:
I. Markets and Competition
A. What Is a Market?
2. Markets can take many forms and may be organized (agricultural commodities) or less
organized (ice cream
B. What Is Competition?
1. Definition of competitive market: a market in which there are so many buyers and
2. Each buyer knows that there are several sellers from which to choose. Sellers know that each
1. Characteristics of a perfectly competitive market:
2. Because buyers and sellers must accept the market price as given, they are often called
“price takers.”
3. Not all goods are sold in a perfectly competitive market.
b. Other markets fall between perfect competition and monopoly.
You may want to provide students with examples of markets other than the
traditional retail store or the stock market. These include the online advertising sites
such as eBay and Craigslist, the college “career services” department through which
they can look for employment upon graduation, or the market for illegal drugs on a
college campus. Be sure to list the good or service being sold, the buyers, and the
sellers in each example.
Students may find the name for this type of market misleading. You will have to
point out that firms in a competitive market do not face head–to-head rivalry as in
sports competitions.
54 ❖ Chapter 4/The Market Forces of Supply and Demand
D. We will start by studying perfect competition.
1. Perfectly competitive markets are the easiest to analyze because buyers and sellers take the
price as a given.
complicated markets.
II. Demand
1. Definition of quantity demanded: the amount of a good that buyers are willing and
able to purchase.
a. Quantity demanded is negatively related to price. This implies that the demand curve is
downward sloping.
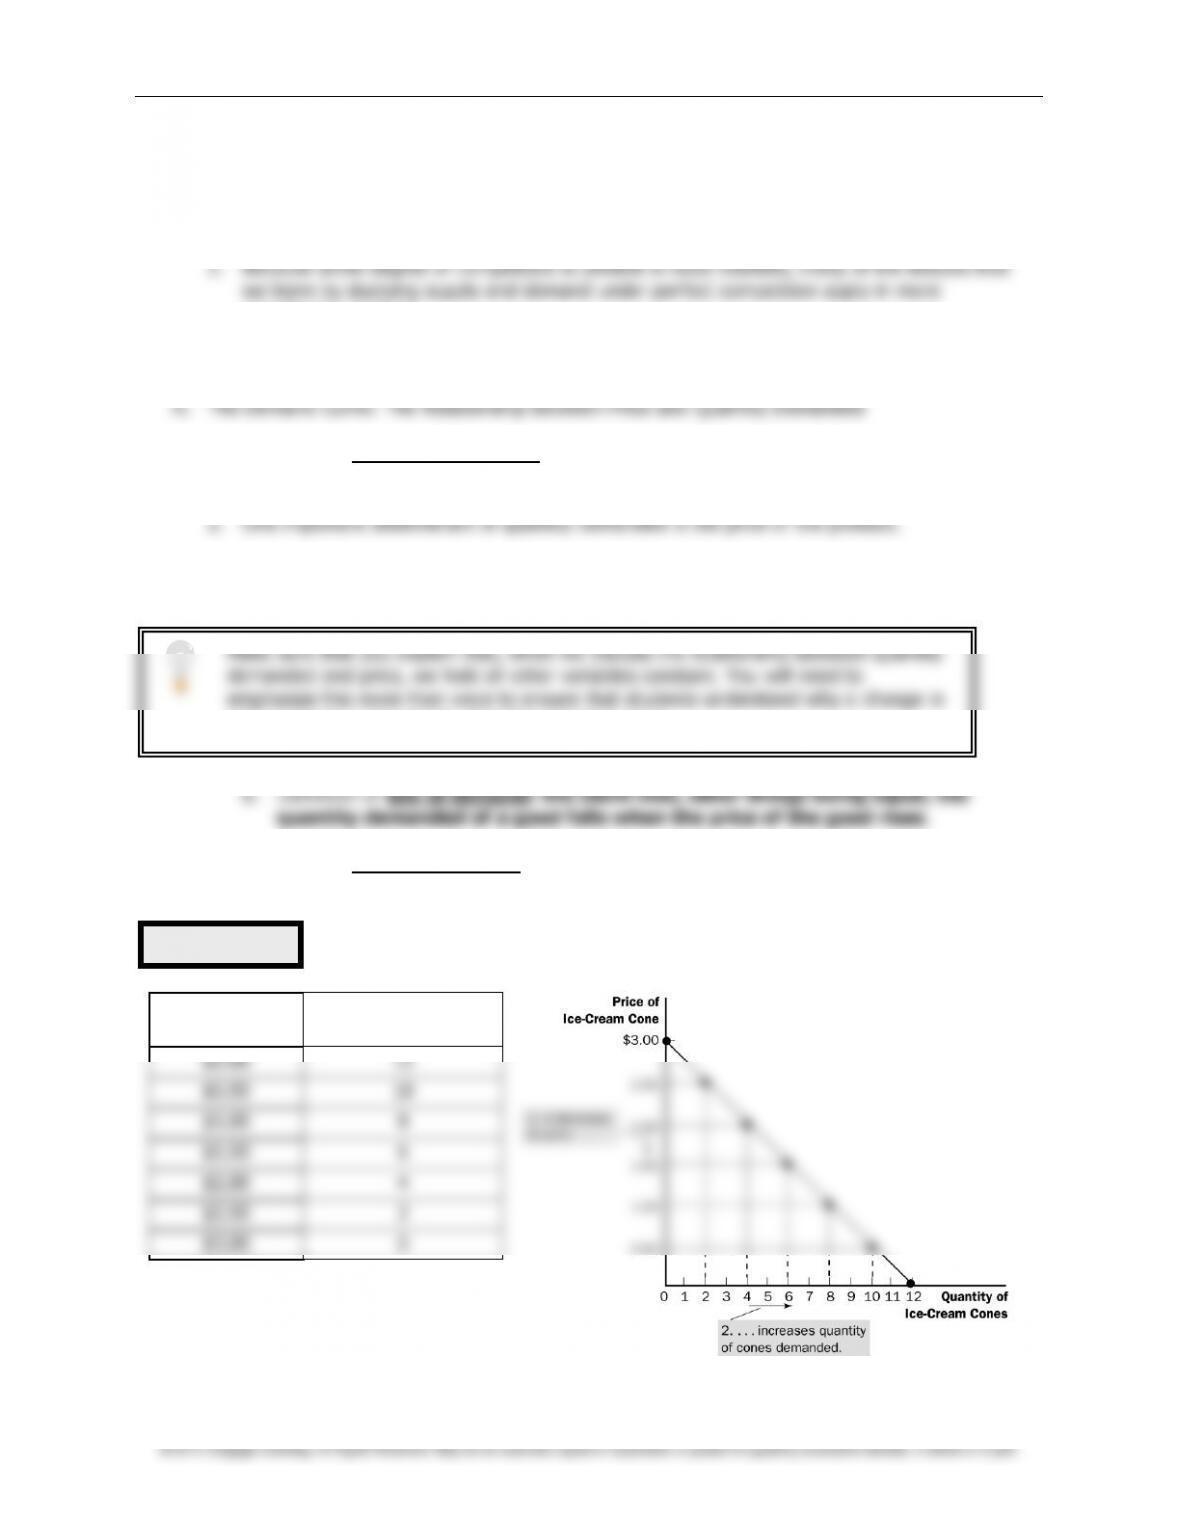
3. Definition of demand schedule: a table that shows the relationship between the
price of a good and the quantity demanded.
Price of Ice-
Cream Cone
Quantity of Cones
Demanded
$0.00
12
$0.50
10
$1.00
8
$1.50
6
$2.00
4
$2.50
2
$3.00
0
Figure 1
Make sure that you explain that, when we discuss the relationship between quantity
demanded and price, we hold all other variables constant. You will need to
emphasize this more than once to ensure that students understand why a change in
price leads to a movement
along
the demand curve.
Chapter 4/The Market Forces of Supply and Demand ❖ 55
4. Definition of demand curve: a graph of the relationship between the price of a good
and the quantity demanded.
a. Price is generally drawn on the vertical axis.
b. Quantity demanded is represented on the horizontal axis.
B. Market Demand versus Individual Demand
1. The market demand is the sum of all of the individual demands for a particular good or
service.
2. The demand curves are summed horizontally—meaning that the quantities demanded are
added up for each level of price.
3. The market demand curve shows how the total quantity demanded of a good varies with the
price of the good, holding constant all other factors that affect how much consumers want to
buy.
C. Shifts in the Demand Curve
time.
Figure 2
When you draw the demand curve for the first time, take the time to plot each of the
points from the demand schedule. This way, students who have difficulty with graphs
can see the relationship between the demand schedule and the demand curve. This
is a good opportunity to see if students understand the (
x
,
y
) coordinate system.
ALTERNATIVE CLASSROOM EXAMPLE:
Here is a demand schedule for ink pens:
Price ($)
Quantity Demanded
.05
1000
.10
800
.15
600
.20
400
.25
200
Students have a difficult time understanding the difference between a change in
price (which causes a movement along the demand curve) and a change in another
determinant (which shifts the demand curve). You will have to emphasize what is
meant by “change in quantity demanded” and “change in demand” several times
using different examples. The
Case Study
on smoking will help to explain this
difference as well.
56 ❖ Chapter 4/The Market Forces of Supply and Demand
2. If any of these other factors change, the demand curve will shift.
b. A decrease in demand is represented by a shift of the demand curve to the left.
3. Income
the product is.
b. Definition of normal good: a good for which, other things equal, an increase in
income leads to an increase in demand.
4. Prices of Related Goods
b. Definition of complements: two goods for which an increase in the price of one
good leads to a decrease in the demand for the other.
5. Tastes
6. Expectations
a. Future income
b. Future prices
7. Number of Buyers
Figure 3
Be careful! Students often confuse inferior goods with what economists call “bads.”
One way to differentiate them is to ask students whether they would ever be willing
to pay for such things as pollution or garbage.
Table 1
It would be a good idea to work through an example changing each of these
variables individually. Students will benefit from the discussion and the practice
drawing graphs.
Chapter 4/The Market Forces of Supply and Demand ❖ 57
D.
Case Study: Two Ways to Reduce the Quantity of Smoking Demanded
1. Public service announcements, mandatory health warnings on cigarette packages, and the
prohibition of cigarette advertising on television are policies designed to reduce the demand
for cigarettes (and shift the demand curve to the left).
2. Raising the price of cigarettes (through tobacco taxes) lowers the quantity of cigarettes
demanded.
a. The demand curve does not shift in this case, however.
b. An increase in the price of cigarettes can be shown by a movement along the original
demand curve.
3. Studies have shown that a 10% increase in the price of cigarettes causes a 4% reduction in
the quantity of cigarettes demanded. For teens, a 10% increase in price leads to a 12% drop
in quantity demanded.
4. Studies have also shown that a decrease in the price of cigarettes is associated with greater
use of marijuana. Thus, it appears that tobacco and marijuana are complements.
III. Supply
A. The Supply Curve: The Relationship between Price and Quantity Supplied
able to sell.
a. Quantity supplied is positively related to price. This implies that the supply curve will be
upward sloping.
2. Definition of supply schedule: a table that shows the relationship between the price
of a good and the quantity supplied.
Figure 4
If you have taken enough time teaching demand, students will catch on to supply
more quickly. However, remember that as consumers, students can understand
demand decisions more easily than supply decisions. You may want to point out to
them that they are suppliers (of their time and effort) in the labor market.
Again you will want to point out that everything else is held constant when we
discuss the relationship between price and quantity supplied. Students should
understand that a change in price causes a movement along the supply curve.
58 ❖ Chapter 4/The Market Forces of Supply and Demand
© 2012 Cengage Learning. All Rights Reserved. May not be scanned, copied or duplicated, or posted to a publicly accessible website, in whole or in part.
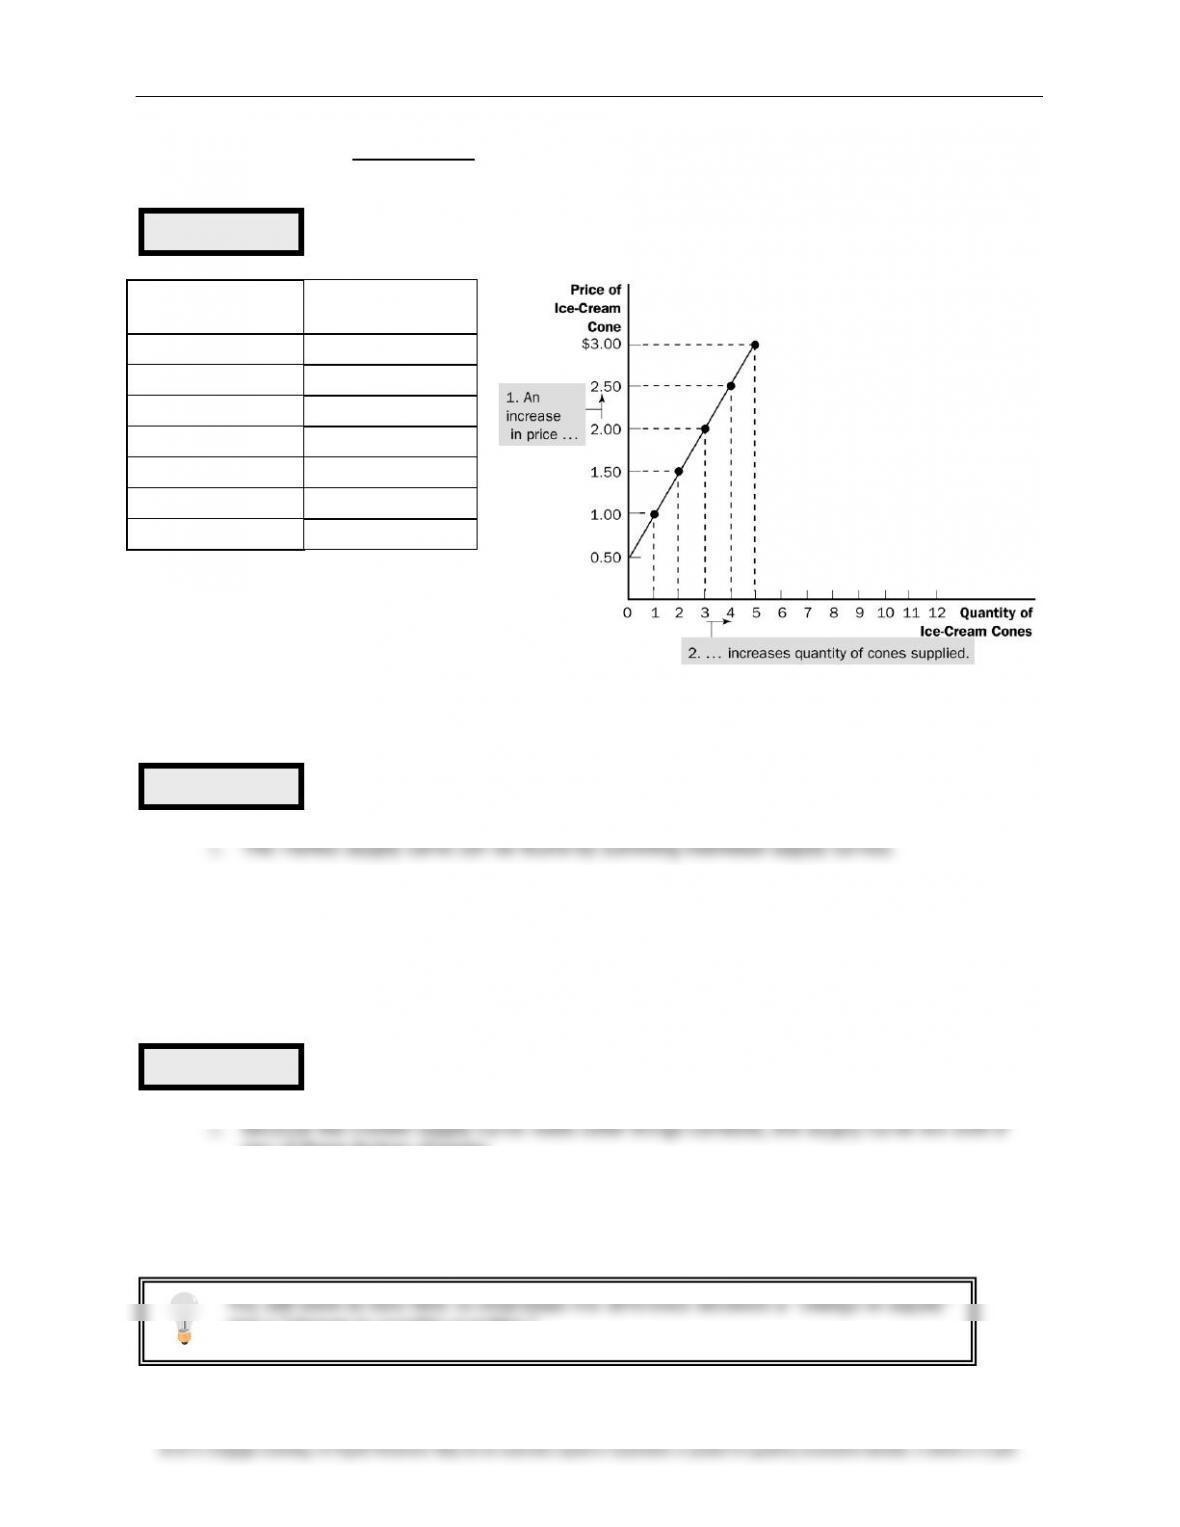
3. Definition of supply curve: a graph of the relationship between the price of a good
and the quantity supplied.
Price of Ice-
Cream Cone
Quantity of
Cones Supplied
$0.00
0
$0.50
0
$1.00
1
$1.50
2
$2.00
3
$2.50
4
$3.00
5
B. Market Supply versus Individual Supply
2. Individual supply curves are summed horizontally at every price.
3. The market supply curve shows how the total quantity supplied varies as the price of the
good varies.
C. Shifts in the Supply Curve
any of these factors changes.
a. An increase in supply is represented by a shift of the supply curve to the right.
b. A decrease in supply is represented by a shift of the supply curve to the left.
Figure 5
Figure 7
Figure 6
You will want to take time to emphasize the difference between a “change in supply”
and a “change in quantity supplied.”
Chapter 4/The Market Forces of Supply and Demand ❖ 59
2. Input Prices
3. Technology
4. Expectations
5. Number of Sellers
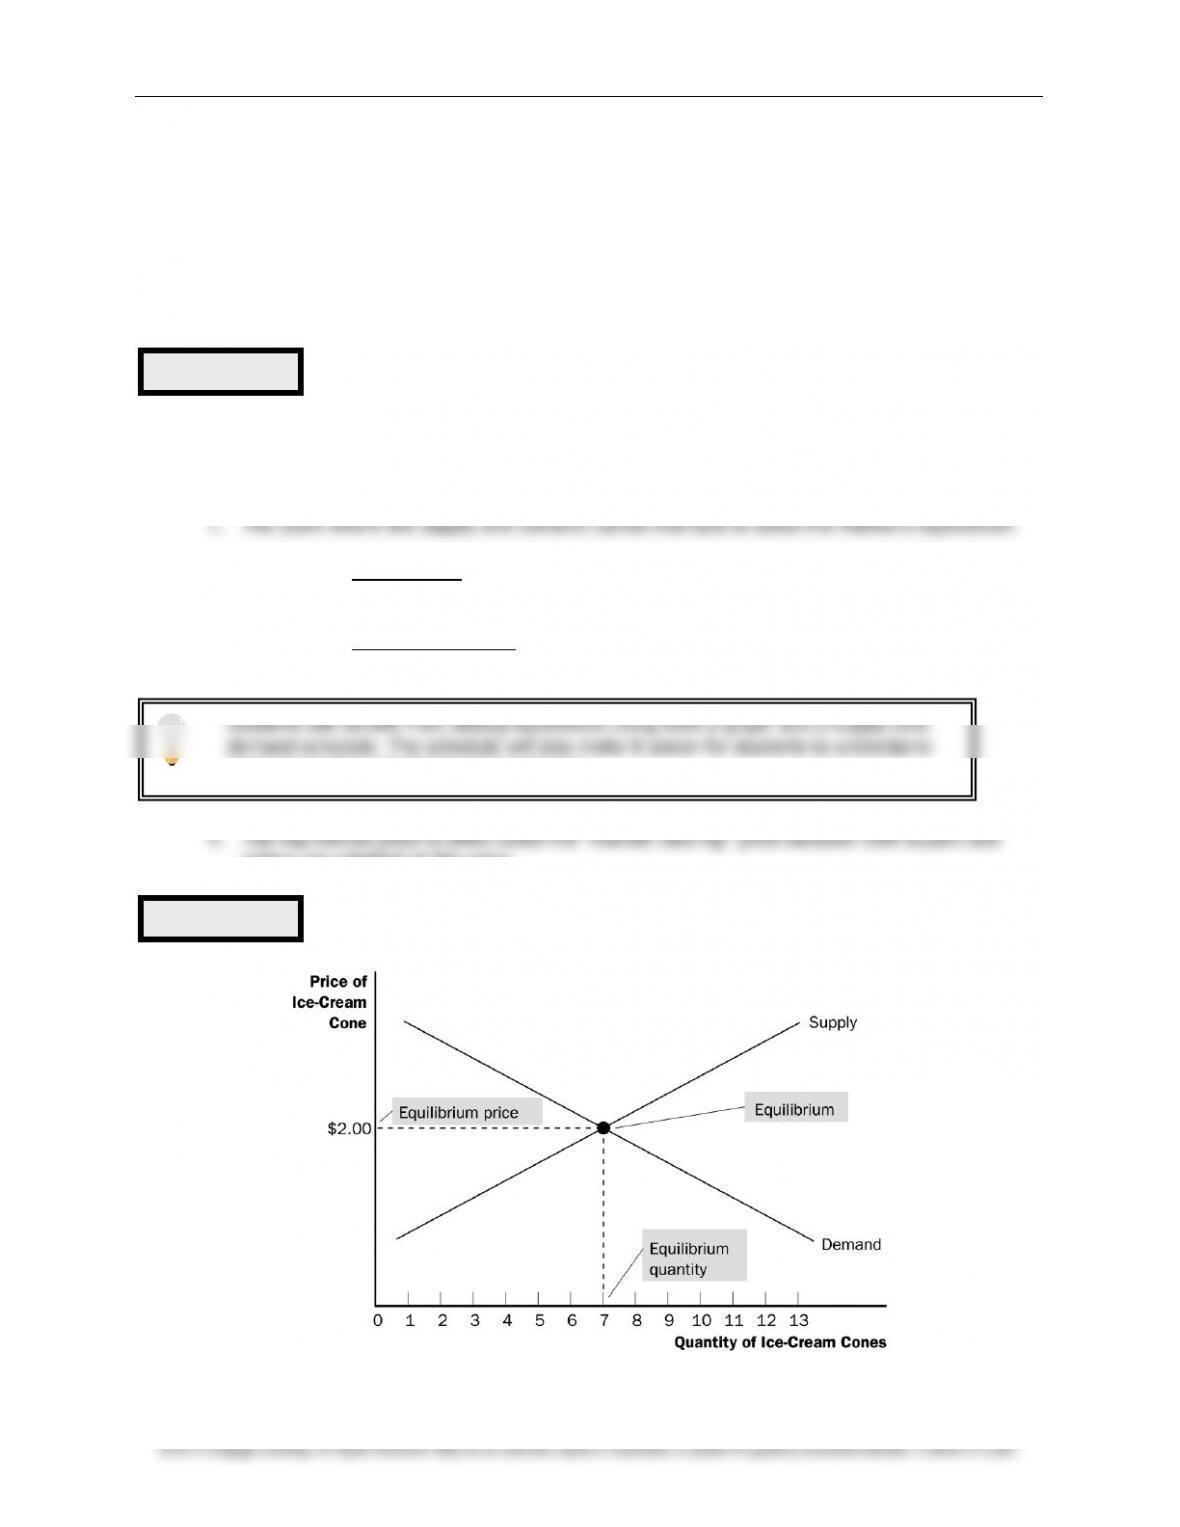
IV. Supply and Demand Together
A. Equilibrium
2. Definition of equilibrium: a situation in which the market price has reached the
level at which quantity supplied equals quantity demanded.
3. Definition of equilibrium price: the price that balances quantity supplied and
quantity demanded.
sellers are satisfied at this price.
Table 2
Figure 8
Students will benefit from seeing equilibrium using both a graph and a supply-and-
demand schedule. The schedule will also make it easier for students to understand
concepts such as shortages and surpluses.

60 ❖ Chapter 4/The Market Forces of Supply and Demand
5. Definition of equilibrium quantity: the quantity supplied and the quantity
demanded at the equilibrium price.
Activity 1—A Market Example
Type: In-class demonstration
Topics: Individual demand, market demand, equilibrium price, allocation
Materials needed: A bag of Pepperidge Farm cookies (15 cookies), 5 volunteers
Time: 35 minutes
Class limitations: Works in large lectures or small classes with over 15 students
Purpose
This is an example of a real-world market, where real goods are exchanged for real money. It
is a free market, so there will be no coercion, but participants should think carefully about
their answers because actual trades will take place.
Instructions
Ask five volunteers to participate in a market for Pepperidge Farm cookies. Read some of the
package copy describing these “distinctively delicious” cookies. Write each volunteer’s name
on the board.
Ask the volunteers how many cookies they would be willing to buy at various prices. Record
these prices and quantities. Give the volunteers the opportunity to revise their numbers if the
figures do not accurately reflect their willingness to pay. Remind them this isn’t a hypothetical
exercise and they will have to pay real money.
At this point, there will be five individual demand curves, which can be graphed if desired.
Add the individual quantities at each price to find the market demand at that price. This
overall demand is used to find the market equilibrium. Sketch a graph of the market demand.
very short run at
Q
= 15. (Sketch the supply curve.)
Try various prices until the individual quantities sum to 15. This will give the equilibrium price
and quantity.
Distribute the cookies and collect money from each participant.
The demand curves display the typical inverse relation between price and quantity. (Remark
on any unusual patterns.) These tell us about each individual’s willingness to pay and reveal
information about the marginal benefits of additional cookies to each consumer.
Market demand is aggregated from individual demand curves.
Notice the consumers do not get an equal number of cookies. This is typical of markets,
because tastes and incomes vary across individuals.